Dietary Patterns and Socioeconomic Status in
the Very Old: The Newcastle 85+ Study
Antoneta Granic1,2*, Karen Davies1,2, Ashley Adamson1,2,3, Thomas Kirkwood1,4, Tom R. Hill3,5, Mario Siervo1,3,6, John C. Mathers1,3,6, Carol Jagger1,2
1Newcastle University Institute for Ageing, Newcastle upon Tyne, United Kingdom,2Institute of Health & Society, Newcastle University, Newcastle upon Tyne, United Kingdom,3Human Nutrition Research Centre, Newcastle University, Newcastle upon Tyne, United Kingdom,4Institute for Cell and Molecular Biosciences, Newcastle University, Newcastle upon Tyne, United Kingdom,5School of Agriculture, Food and Rural Development, Newcastle University, Newcastle upon Tyne, United Kingdom,6Institute of Cellular Medicine, Newcastle University, Newcastle upon Tyne, United Kingdom
Abstract
Background
Dietary patterns (DP) are associated with health outcomes in younger adults but there is a lack of evidence in the very old (aged 85+) on DP and their association with sociodemo-graphic factors, lifestyle, health and functioning measures. Higher socioeconomic status (SES) has been linked with healthier DP but it is not known whether these associations are sustained in the very old.
Objective
We aimed to (a) characterise DP in the very old and (b) assess the relationships between three SES indicators (education, occupational class and area-deprivation index [IMD]) and DP.
Methods
Complete dietary data at baseline (2006/07) for 793 participants in the Newcastle 85+ Study were established through 24-hr multiple pass recall. We used Two-Step clustering and 30 food groups to derive DP, and multinomial logistic regression models to assess the association with SES.
Results
We identified three distinct DP (characterised as‘High Red Meat’,‘Low Meat’, and‘High
Butter’) that varied with key sociodemographic, health and functioning measures.‘Low
Meat’participants were more advantaged (i.e. higher education and occupational class,
and lived in more affluent areas in owned homes), were least disabled, cognitively impaired, and depressed, and were more physically active than those in the other DP. After adjusting for other lifestyle factors, cognitive status and BMI, lower educational attainment remained
a significant predictor of‘High Red Meat’and‘High Butter’membership compared with‘Low
a11111
OPEN ACCESS
Citation:Granic A, Davies K, Adamson A, Kirkwood T, Hill TR, Siervo M, et al. (2015) Dietary Patterns and Socioeconomic Status in the Very Old: The Newcastle 85+ Study. PLoS ONE 10(10): e0139713. doi:10.1371/journal.pone.0139713
Editor:Consuelo Borras, University of Valencia, SPAIN
Received:March 25, 2015
Accepted:September 15, 2015
Published:October 21, 2015
Copyright:© 2015 Granic et al. This is an open access article distributed under the terms of the
Creative Commons Attribution License, which permits unrestricted use, distribution, and reproduction in any medium, provided the original author and source are credited.
Data Availability Statement:All relevant data are within the paper and its Supporting Information files. Additional information about the Newcastle 85+ Study are available from the Newcastle 85+ Study Core Research Team Leadership chaired by Prof Carol Jagger ([email protected]) and the study's website (http://research.ncl.ac.uk/85plus).
Meat’(‘High Red Meat’: OR [95% CI] for 0–9 and 10–11 years of education vs.12 years:
5.28 [2.85–9.79], p<0.001 and 3.27 [1.65–6.51], p = 0.001, respectively;‘High Butter’: 3.32
[1.89–5.82], p<0.001 and 2.83 [1.52–5.28], p = 0.001).
Conclusions
In this cohort of very old adults, we detected a favourable DP (‘Low Meat’), which was
asso-ciated with better health and functioning and higher SES.
Introduction
The importance of whole diet, dietary patterns (DP) and the consequent synergistic effects of food combinations (rather than a single food or nutrient) on healthy ageing, disease prevalence and survival in older adults is increasingly recognised [1–9]. Greater adherence to healthy DP in later life established by either dietary scores (e.g. Mediterranean-style diet [MeDi] and Die-tary Approaches to Stop Hypertension [DASH]) or derived from primary data through dimen-sion-reduction techniques have been linked with decreased risk of cardiovascular diseases [1–
3], cancer [1], stroke [4], dementia [5,6], and all-cause and disease-specific mortality [1,7–9]. Healthier DP are generally characterised by higher than average intake of beneficial foods (e.g. fruits and vegetables, fish, low-fat dairy, and whole grains), and lower intake of potentially less healthy foods (e.g. red and processed meats, refined cereals, and confectionery and desserts), which translates into a more nutrient-dense diet with lower energy density, and more favour-able nutrient status [9–12].
Several individual, social and environmental factors including age, gender, ethnicity, self-perceived health, diseases burden, social support, and socioeconomic status (SES) are determi-nants of diet quality in both the general, and older, adult populations [13–25]. In particular, diet quality is associated with SES operationalised as education, occupation or income [10,13,14,18,21–25]. For example, a higher educational attainment has been positively associ-ated with healthier‘vegetable-based’DP and lower levels of education with less healthy‘ sweet-and fat-dominated’DP among older adults (aged 60+) from nine European countries partici-pating in the European Prospective Investigation into Cancer and Nutrition (EPIC)-Elderly study [10]. In the Québec NuAge study, older adults (aged 67 to 84) with higher educational attainment and better diet knowledge had higher diet quality assessed by the Canadian Healthy Eating Index [14]. Similarly, in the 2003–2004 National Health and Nutrition Examination Survey older adults (aged 65+) with the highest education (especially college graduates) had higher dietary scores based on the 2005 Dietary Guidelines for Americans, and higher intake of fruits, vegetables, whole grains and alcohol [18]. However, diet quality and adherence to healthy DP in relation to SES among the very old (aged 85+) has not been explored. In addi-tion, very little is known about associations between DP and health and functioning status, and social, socioeconomic, and behavioural factors in this age group.
The main advantage of DP analysis in investigating the relationship between diet and healthy ageing is the ability to capture the complexity of human diet and to account for syner-gistic, additive and cumulative effect of different foods and nutrients on health. The most com-mon approach used to derive DP is ana priori, hypothesis-driven approach which assesses the level of adherence to a pre-defined healthy diet score (index) for a specific diet (i.e. MeDi and DASH) or dietary guidelines for general health (i.e. Healthy Eating Index, Healthy Diet Indica-tor) [26–28]. Limitations of ana prioriapproach include (a) the reliance on current scientific
funded by the Medical Research Council, Biotechnology and Biological Sciences Research Council and the Dunhill Medical Trust. Parts of the work have also been funded by the British Heart Foundation, Unilever Corporate Research, Newcastle University and the North of England Commissioning Support Unit (formerly NHS North of Tyne). The research was also supported by the National Institute for Health Research Newcastle Biomedical Research Centre, based at Newcastle upon Tyne Hospitals NHS Foundation Trust and Newcastle University. The views expressed are those of the authors and not necessarily those of the National Health Service, United Kingdom. The funders had no role in study design, data collection and analysis, decision to publish, or preparation of the manuscript.
evidence on what constitutes a healthy diet or on dietary guidelines which may not be accurate for the very old, and (b) the inability of dietary scores to capture the effect of the whole diet on health. On the other hand,a posterioriDP are purely data-driven and do not rely on the cur-rent state of knowledge in nutrition. They are derived by statistical methods such as factor or cluster analysis but, by being based on the total diet, may provide better characterisation of the habitual diet of a specific population group. Specifically, cluster analysis creates a latent variable by grouping individuals into distinct, non-overlapping clusters based on homogeneity of foods and nutrients consumed [29].
Despite extensive interest among the scientific community and the general public about the potential benefits of diet for heath and functioning in older adults (including the very old), there is limited epidemiological evidence about dietary habits and the determinants thereof amongst the very old. Furthermore, most studies investigating the role of diet/DP in healthy ageing in later life used ana prioriapproach and only a few derived DP empirically or included the very old despite this age group now being the most rapidly increasing sector of the popula-tion [e.g.10,14,20,23].
To the best of our knowledge, the present study is the first cohort study to (a) describe the habitual diet of very old adults using ana posterioriapproach (cluster analysis); and (b) deter-mine how DP vary by sociodemographic, lifestyle, health and functioning measures.
Methods
Subjects
Participants were drawn from the Newcastle 85+ Study, a prospective study of over 1,000 indi-viduals belonging to a single-year birth cohort (1921), who were recruited through general practices in Newcastle and North Tyneside, UK [30,31]. In brief, the study aimed to determine the health trajectories and bio-psychosocial factors (including diet) that contribute to the main-tenance of physical and mental function and independence of the very old (aged 85+). Research nurses completed a health assessment (i.e. questionnaires, measurements, function tests and collection of fasting blood samples) in each participant’s usual residence, including institutions. General practice (GP) medical records were reviewed for diagnosed diseases and prescribed medication. At baseline (2006/07), both health assessment and GP records data were obtained for 845 participants (58.2% of those eligible to participate), and a further 188 had GP record review only. In all, 805 participants consented to dietary assessment, and 793 (98.5%) com-pleted two 24-hour multiple-pass dietary recall (24-hr MPR) [32] conducted on two non-con-secutive days, and were used to derive DP. The analytic sample comprised of 791 participants who had complete diet, health assessment and GP records data at baseline.
Ethics statement
The study was approved by the Newcastle & North Tyneside Local Research Ethics Committee 1. Written informed consent was obtained from each participant or from a consultee (usually a relative or carer) if an individual lacked capacity to consent.
Measurements
Assessment of dietary intake. The methodology of dietary assessment in this cohort has
with a food frequency questionnaire (FFQ), and (b) 24-hr MPR is an acceptable dietary assess-ment approach for the very old [33].
The 24-hr MPR method has been extensively used in national surveys in the US and the UK [32,34], and it is suitable for individual dietary assessment minimizing participant burden. Compared with weighted food records or food diaries, 24-hr MPR (paper-pencil and automated version) has been accepted as a more accurate measure of diet and individual energy intake [32–34]. The method captures individuals’diet by recording detailed food intake during the previous day (i.e. food amount, type and brand, cooking method, meal occasion/ time).
Dietary intake was assessed on two different days of the week at least one week apart, with some exceptions (i.e. 23% of participants were interviewed on the same day of the week, and 25.5% had interviews<7 days apart). There were no dietary recalls for Fridays and Saturdays.
Portion sizes were estimated from the description on the food packet, or aided by use of a pho-tographic atlas, which includes images of household measuring tools [35]. The data on foods consumed were coded based on McCance and Widowson’s food composition tables [36]. Over 2,000 unique food codes were used and entered into a Microsoft Access-based dietary database. Individual foods were then grouped into 118 distinct food groups that had been previously established by the Human Nutrition Research Centre at Newcastle University. Each food group represented an average weight (in grams) of foods consumed on both days of measure-ment. The food groups were further collapsed into 33 broader groups based on food and nutri-ent composition similarities, and then categorised as absnutri-ent or presnutri-ent in food intake (coded 0 and 1, respectively). Of these 33 food groups, 30 were used in the cluster analysis (S1 Table) and contributed the most to DP separation. The Access database also provided information on food weight, and estimates of nutrient and energy intake for all 118 food groups.
SES measures. SES was determined using three independent measures over the lifespan,
which were coded into three levels (low [0], medium [1] and high [2]): (a) for early life: years of full-time education attained (9 years or less / 10–11 years / 12 years or more for low, medium and high respectively); (b) for mid to late adulthood: previous main occupation coded to the National Statistics Socio-economic Classification (NS-SEC) system [37] combined into three classes (routine and manual occupation / intermediate occupations / higher managerial, administrative and professional occupations), and (c) for very late adulthood: level of poverty in current area of residency defined by the Index of Multiple Deprivation (IMD) [38] (referred to later in the text as‘deprivation index’), and categorised into quartiles and reverse-coded (>75thpercentile [Q4:‘poor areas’] / 25th-75thpercentile [Q2+Q3:‘intermediate group’] / <25thpercentile [Q1:‘affluent areas’]).
Previous main occupation (defined as a job or role a participant performed for longest time in his/her working life) was established from the job history of each participant, except for 265 women (33.5% of analytic sample) who had their occupational class taken from husbands’
occupation. The IMD is a composite, weighted measure of multiple deprivations in seven domains (income, employment, health and disability, education, housing and services, living environment, and crime) for small geographic areas of about 1,500 inhabitants [38].
Other measures and covariates. The characteristics of participants in each of the DP were
status [normal (26 points on Mini Mental State Examination, MMSE) / impaired (25 MMSE)] [39], and supplement intake [yes / no]).
Statistical analysis. Cluster analysis:DP were established using participants with two
complete 24-hr MPR at baseline (n = 793). Two participants had incomplete health/GP records data and were excluded from multivariate analyses. The non-responders (i.e. those refusing or with dietary protocol violation; n = 54) were compared with the 791 participants (analytic sam-ple) using independent t test for continuous andχ2test for categorical variables.
DP were derived using the SPSS Two-Step cluster analysis [40–43]. The procedure is suit-able for large data sets and accommodates both categorical and continuous varisuit-ables. It uses one pass through the data to create small pre-clusters based on a log-likelihood distance crite-rion (Step 1), which are merged into distinct dietary groups using agglomerative hierarchical clustering method (Step 2). We used automatic selection and the Bayesian Information Crite-rion (BIC) to determine the optimal number of DP and the best DP solution, which was achieved with 30 food groups (Table 1). Other criteria included: (a) number of food groups with high importance factor (IF) that most readily separated the DP, excluding those which had IF<0.01 consistently; (b) ratio size between the DP; and (c) interpretability of the DP
solu-tion. The robustness and stability of the final DP solution was re-evaluated by random ordering of cases (four times) and by comparing DP solution characteristics.
Nutritional characteristics by dietary patterns:Intakes in grams/day of 10 food groups
with the highest IF across DP were compared using the Kruskal-Wallis test (S2 Table). Intakes of selected nutrients and of energy (including percent energy from nutrients) (Table 2) by DP were compared by ANOVA (with post hoc Tukey HDS or Games-Howell) for normally dis-tributed and Kruskal-Wallis for non-normally disdis-tributed variables. The nutrient contents of all foods consumed by participants belonging to each DP were included in these analyses.
Blood lipid profile by dietary patterns:Blood lipids concentrations (i.e. total cholesterol,
LDL-cholesterol, and HDL-cholesterol in mmol/L) of participants in each DP group are sum-marised inTable 3. Blood collection was carried out concurrently with dietary assessment as described previously [44].
Sociodemographic and health characteristics by dietary patterns:The sociodemographic
and health characteristics of the participants in each DP group were compared using the Krus-kal-Wallis test for ordered andχ2test for categorical variables (Table 4andS3 Table). All
sta-tistics were 2-sided atα= 0.05.
SES determinants of DP membership:We utilised multinomial logistic regression with
stepwise forward entry to examine associations between DP and each SES indicator separately (Model 1), and together (Model 2), and adjusted for other lifestyle (physical activity and smok-ing) and health-related factors (BMI and cognitive status at baseline) (Model 3) (Table 5). In sensitivity analyses, we controlled additionally for type of home, and total energy (instead of BMI), and repeated all analyses in a sub-sample which excluded participants who lived in insti-tutions (n = 70, 8.9%) (S4 Table).
We used the Kolmogorov-Smirnov test and Q-Q plots to determine normality of continu-ous variables, and multiple linear regression to evaluate covariates for multicollinearity and by inspecting correlation matrix, VIF tolerance and the condition index. All analyses were con-ducted using IBM SPSS (V.19 or 21; IBM Corporation, Armonk, NY, USA).
Results
diagnosed with dementia (p<0.001), and to be more disabled (p<0.001) and less physically
active (p = 0.002) (data not shown).
Dietary patterns classification and differentiation
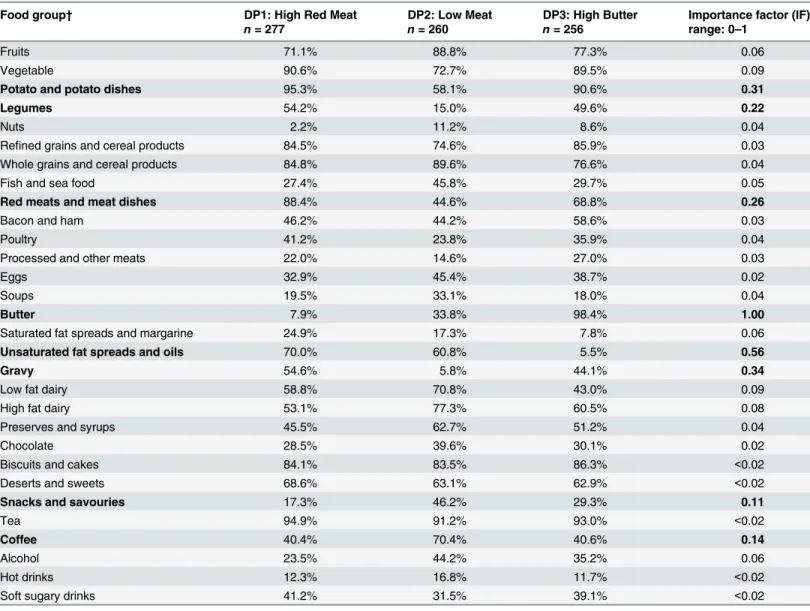
Using Two-Step clustering, a three-cluster solution proved to be optimal (Table 1) yielding approximately equal numbers of participants in each cluster. Eight food groups contributed the most to DP separation, notably butter, unsaturated fats spreads and oils, gravy, potato and potato dishes, red meats and meat dishes, and legumes. DP1 (n = 277), a‘High Red Meat’ die-tary pattern, was over-represented by red meats/meat dishes (88.4% of participants in this DP consumed red meats/meat dishes), gravy (54.6%), potato/potato dishes (95.3%), legumes (including baked beans) (54.2%) and unsaturated fats spreads (70.0%), and under-represented
Table 1. Percentages of participants consuming each of 30 food groups by dietary pattern (DP) with importance factor*.
Food group† DP1: High Red Meat DP2: Low Meat DP3: High Butter Importance factor (IF)
n= 277 n= 260 n= 256 range: 0–1
Fruits 71.1% 88.8% 77.3% 0.06
Vegetable 90.6% 72.7% 89.5% 0.09
Potato and potato dishes 95.3% 58.1% 90.6% 0.31
Legumes 54.2% 15.0% 49.6% 0.22
Nuts 2.2% 11.2% 8.6% 0.04
Refined grains and cereal products 84.5% 74.6% 85.9% 0.03
Whole grains and cereal products 84.8% 89.6% 76.6% 0.04
Fish and sea food 27.4% 45.8% 29.7% 0.05
Red meats and meat dishes 88.4% 44.6% 68.8% 0.26
Bacon and ham 46.2% 44.2% 58.6% 0.03
Poultry 41.2% 23.8% 35.9% 0.04
Processed and other meats 22.0% 14.6% 27.0% 0.03
Eggs 32.9% 45.4% 38.7% 0.02
Soups 19.5% 33.1% 18.0% 0.04
Butter 7.9% 33.8% 98.4% 1.00
Saturated fat spreads and margarine 24.9% 17.3% 7.8% 0.06
Unsaturated fat spreads and oils 70.0% 60.8% 5.5% 0.56
Gravy 54.6% 5.8% 44.1% 0.34
Low fat dairy 58.8% 70.8% 43.0% 0.09
High fat dairy 53.1% 77.3% 60.5% 0.08
Preserves and syrups 45.5% 62.7% 51.2% 0.04
Chocolate 28.5% 39.6% 30.1% 0.02
Biscuits and cakes 84.1% 83.5% 86.3% <0.02
Deserts and sweets 68.6% 63.1% 62.9% <0.02
Snacks and savouries 17.3% 46.2% 29.3% 0.11
Tea 94.9% 91.2% 93.0% <0.02
Coffee 40.4% 70.4% 40.6% 0.14
Alcohol 23.5% 44.2% 35.2% 0.06
Hot drinks 12.3% 16.8% 11.7% <0.02
Soft sugary drinks 41.2% 31.5% 39.1% <0.02
*DP were derived using the SPSS Two-Step clustering of 30 food groups (coded as binary variable: absence or presence of food group). Seven hundred and ninety-three participants had complete dietary data and were used in cluster analysis.
†Eight food groups contributing the most to dietary pattern separation are indicated in bold.
by butter (only 7.9% of them consumed butter). DP2 (n = 260), a‘Low Meat’dietary pattern, was under-represented by meat/meat dishes (44.6%), gravy (5.8%), potato/potato dishes (58.1%), and moderately represented by butter (33.8%). Compared with the others, this DP contained the highest percentage of participants reporting eating fruits, nuts, whole grains and cereal products, fish and sea food, eggs, soups, low and high fat dairy, coffee and alcohol. As a
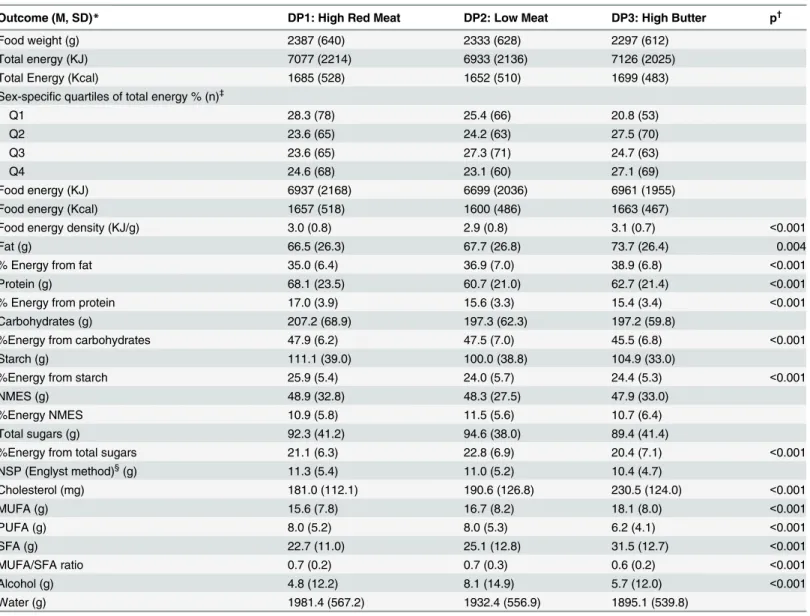
Table 2. Intakes of selected nutrients and energy consumption per day by dietary patterns.
Outcome (M, SD)* DP1: High Red Meat DP2: Low Meat DP3: High Butter p†
Food weight (g) 2387 (640) 2333 (628) 2297 (612)
Total energy (KJ) 7077 (2214) 6933 (2136) 7126 (2025)
Total Energy (Kcal) 1685 (528) 1652 (510) 1699 (483)
Sex-specific quartiles of total energy % (n)‡
Q1 28.3 (78) 25.4 (66) 20.8 (53)
Q2 23.6 (65) 24.2 (63) 27.5 (70)
Q3 23.6 (65) 27.3 (71) 24.7 (63)
Q4 24.6 (68) 23.1 (60) 27.1 (69)
Food energy (KJ) 6937 (2168) 6699 (2036) 6961 (1955)
Food energy (Kcal) 1657 (518) 1600 (486) 1663 (467)
Food energy density (KJ/g) 3.0 (0.8) 2.9 (0.8) 3.1 (0.7) <0.001
Fat (g) 66.5 (26.3) 67.7 (26.8) 73.7 (26.4) 0.004
% Energy from fat 35.0 (6.4) 36.9 (7.0) 38.9 (6.8) <0.001
Protein (g) 68.1 (23.5) 60.7 (21.0) 62.7 (21.4) <0.001
% Energy from protein 17.0 (3.9) 15.6 (3.3) 15.4 (3.4) <0.001
Carbohydrates (g) 207.2 (68.9) 197.3 (62.3) 197.2 (59.8)
%Energy from carbohydrates 47.9 (6.2) 47.5 (7.0) 45.5 (6.8) <0.001
Starch (g) 111.1 (39.0) 100.0 (38.8) 104.9 (33.0)
%Energy from starch 25.9 (5.4) 24.0 (5.7) 24.4 (5.3) <0.001
NMES (g) 48.9 (32.8) 48.3 (27.5) 47.9 (33.0)
%Energy NMES 10.9 (5.8) 11.5 (5.6) 10.7 (6.4)
Total sugars (g) 92.3 (41.2) 94.6 (38.0) 89.4 (41.4)
%Energy from total sugars 21.1 (6.3) 22.8 (6.9) 20.4 (7.1) <0.001
NSP (Englyst method)§(g) 11.3 (5.4) 11.0 (5.2) 10.4 (4.7)
Cholesterol (mg) 181.0 (112.1) 190.6 (126.8) 230.5 (124.0) <0.001
MUFA (g) 15.6 (7.8) 16.7 (8.2) 18.1 (8.0) <0.001
PUFA (g) 8.0 (5.2) 8.0 (5.3) 6.2 (4.1) <0.001
SFA (g) 22.7 (11.0) 25.1 (12.8) 31.5 (12.7) <0.001
MUFA/SFA ratio 0.7 (0.2) 0.7 (0.3) 0.6 (0.2) <0.001
Alcohol (g) 4.8 (12.2) 8.1 (14.9) 5.7 (12.0) <0.001
Water (g) 1981.4 (567.2) 1932.4 (556.9) 1895.1 (539.8)
KJ, kilojoules; Kcal, kilocalories; NMES, non-milk extrinsic sugars; NSP, non-starch polysaccharides; MUFA, monounsaturated fatty acids; PUFA, polyunsaturated fatty acids; SFA, saturated fatty acids.
*Normality of data was tested using skewness and kurtosis statistics, histograms and Q-Q plots. Values are means (M, SD) or percentages (%), which were estimated based on consumption of all 118 food groups [36].
†
ANOVA (with Post Hoc Tukey HDS or Games-Howell) was used for normally distributed and Kruskal-Wallis for non-normally distributed continuous variables. Only significantpvalues are reported.
‡
The range for total energy quartiles (Kcal) are: Q1 (559–1581), Q2 (1588–1909), Q3 (1909–2283), and Q4 (2287) for men, and Q1 (513–1219), Q2 (1221–1490), Q3 (1493–1756), and Q4 (1761) for women.
§Englyst method measures NSP and is the most commonly used method in the UK.
consequence, DP2 was regarded as the healthiest and was used as a referent in subsequent anal-yses. DP3 (n = 256), a‘High Butter’dietary pattern, was over-represented by butter (98.4%), moderately represented by red meats (68.8%), and under-represented in intake of unsaturated (5.5%) and saturated fats spreads (7.8%).
The robustness of these DP was corroborated when we compared percentage of intake (fre-quency) with g/day of intake of 10 food groups with the highest IF across DP (S2 Table). DP2 was characterised by higher intake (g/day) of healthy foods, and DP1 and DP3 by higher con-sumption of potentially less healthy foods.
Nutritional characteristics by dietary patterns
The three DP did not differ according to total weight of food consumed or to intakes of total energy, food energy, carbohydrates, starch, total sugars, non-milk extrinsic sugars (NMES), non-starch polysaccharides (NSP) and water. Compared with DP1 and DP2, participants belonging to DP3 (‘High Butter’) had the highest consumption of total fat (p = 0.004), choles-terol, monounsaturated fatty acids (MUFA), and saturated fatty acids (SFA) (p<0.001), the
lowest intake of polyunsaturated fatty acids (PUFA) (p<0.001) and MUFA/SFA ratio
(p<0.001), the highest percent energy from fat (p<0.001) and SFA (p<0.001), and the highest
food energy density (p<0.001), but the lowest percent energy from carbohydrates (p<0.001)
(Table 2). Those in DP2 (‘Low Meat’) had the lowest intake of protein (p<0.001) and the
high-est consumption of alcohol (p<0.001), whereas DP1 (‘High Red Meat’) was highest in percent
energy from protein (p<0.001) and starch (p<0.001).
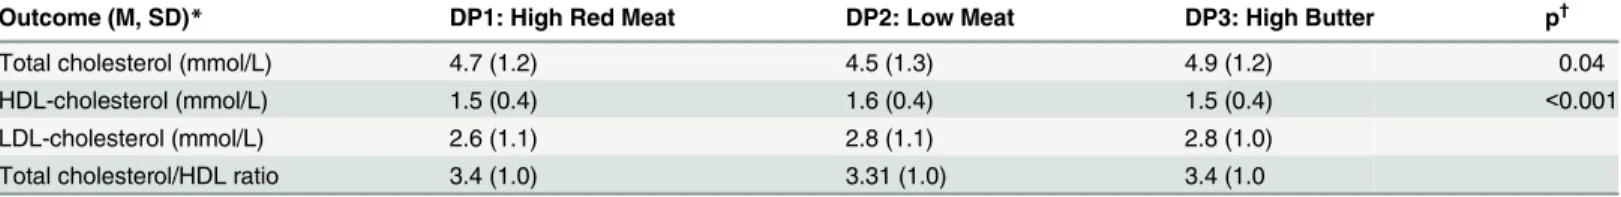
Blood lipid profile by dietary patterns
Compared with participants in DP1 and DP3, those in DP2 (‘Low Meat’) had the lowest total plasma cholesterol (p = 0.04) and the highest HDL-cholesterol concentration (p<0.001).
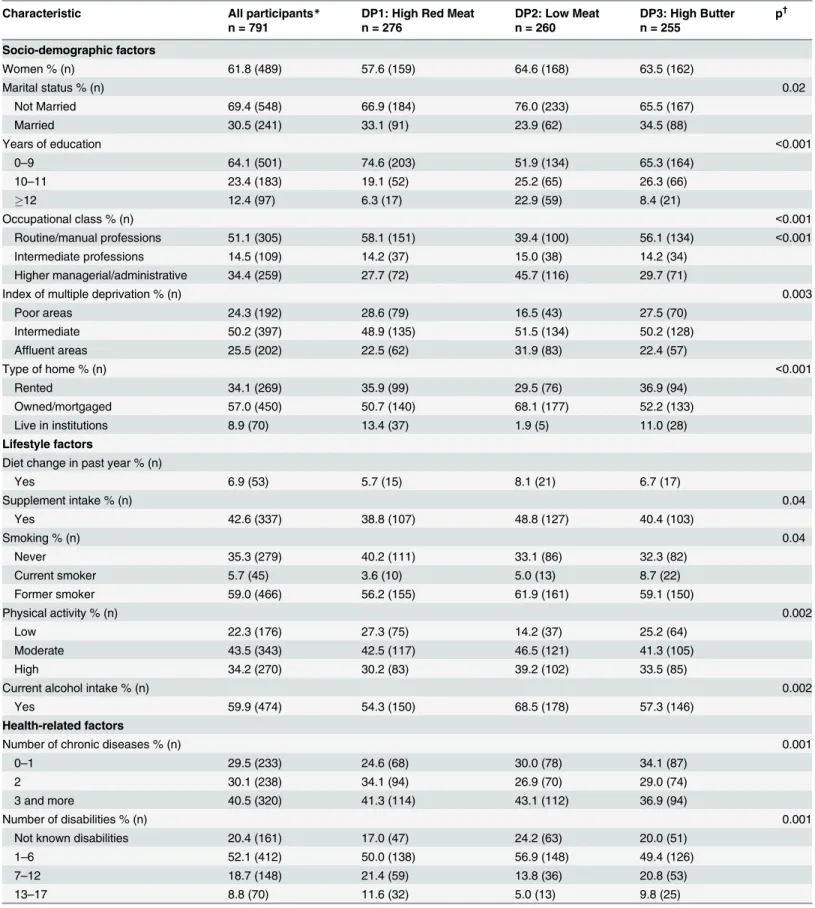
Sociodemographic and health characteristics by dietary pattern
Compared with other DP, those in DP2 (‘Low Meat’) were less likely to be married (p = 0.02), were more educated (p<0.001), had higher managerial/administrative occupations (p<0.001),
were more likely to own their homes (p<0.001), live in affluent areas (p = 0.003), be more
physically active (p = 0.002), drink alcohol (p = 0.002), and were the least likely to be disabled (p = 0.001), to be obese (p = 0.02), to have dementia (p<0.001) or cognitive impairment (25 MMSE) (p<0.001), renal disease (p = 0.02), depressive symptoms (p = 0.009) or to beAPOE
ε4positive (p = 0.002) (Table 4andS3 Table). Those in DP1 (‘High Red Meat’) were more
Table 3. Blood lipid profile of study participants by dietary patterns.
Outcome (M, SD)* DP1: High Red Meat DP2: Low Meat DP3: High Butter p†
Total cholesterol (mmol/L) 4.7 (1.2) 4.5 (1.3) 4.9 (1.2) 0.04
HDL-cholesterol (mmol/L) 1.5 (0.4) 1.6 (0.4) 1.5 (0.4) <0.001
LDL-cholesterol (mmol/L) 2.6 (1.1) 2.8 (1.1) 2.8 (1.0)
Total cholesterol/HDL ratio 3.4 (1.0) 3.31 (1.0) 3.4 (1.0
HDL, high density lipoprotein; LDL, low density lipoprotein.
*Normality of data was tested using skewness and kurtosis statistics, histograms and Q-Q plots.
†
ANOVA (with Post Hoc Tukey HDS or Games-Howell) was used for normally distributed and Kruskal-Wallis for non-normally distributed continuous variables. Only significant p values are reported.
Table 4. Baseline characteristics of study participants by dietary patterns.
Characteristic All participants* DP1: High Red Meat DP2: Low Meat DP3: High Butter p†
n = 791 n = 276 n = 260 n = 255
Socio-demographic factors
Women % (n) 61.8 (489) 57.6 (159) 64.6 (168) 63.5 (162)
Marital status % (n) 0.02
Not Married 69.4 (548) 66.9 (184) 76.0 (233) 65.5 (167)
Married 30.5 (241) 33.1 (91) 23.9 (62) 34.5 (88)
Years of education <0.001
0–9 64.1 (501) 74.6 (203) 51.9 (134) 65.3 (164)
10–11 23.4 (183) 19.1 (52) 25.2 (65) 26.3 (66)
12 12.4 (97) 6.3 (17) 22.9 (59) 8.4 (21)
Occupational class % (n) <0.001
Routine/manual professions 51.1 (305) 58.1 (151) 39.4 (100) 56.1 (134) <0.001
Intermediate professions 14.5 (109) 14.2 (37) 15.0 (38) 14.2 (34)
Higher managerial/administrative 34.4 (259) 27.7 (72) 45.7 (116) 29.7 (71)
Index of multiple deprivation % (n) 0.003
Poor areas 24.3 (192) 28.6 (79) 16.5 (43) 27.5 (70)
Intermediate 50.2 (397) 48.9 (135) 51.5 (134) 50.2 (128)
Affluent areas 25.5 (202) 22.5 (62) 31.9 (83) 22.4 (57)
Type of home % (n) <0.001
Rented 34.1 (269) 35.9 (99) 29.5 (76) 36.9 (94)
Owned/mortgaged 57.0 (450) 50.7 (140) 68.1 (177) 52.2 (133)
Live in institutions 8.9 (70) 13.4 (37) 1.9 (5) 11.0 (28)
Lifestyle factors
Diet change in past year % (n)
Yes 6.9 (53) 5.7 (15) 8.1 (21) 6.7 (17)
Supplement intake % (n) 0.04
Yes 42.6 (337) 38.8 (107) 48.8 (127) 40.4 (103)
Smoking % (n) 0.04
Never 35.3 (279) 40.2 (111) 33.1 (86) 32.3 (82)
Current smoker 5.7 (45) 3.6 (10) 5.0 (13) 8.7 (22)
Former smoker 59.0 (466) 56.2 (155) 61.9 (161) 59.1 (150)
Physical activity % (n) 0.002
Low 22.3 (176) 27.3 (75) 14.2 (37) 25.2 (64)
Moderate 43.5 (343) 42.5 (117) 46.5 (121) 41.3 (105)
High 34.2 (270) 30.2 (83) 39.2 (102) 33.5 (85)
Current alcohol intake % (n) 0.002
Yes 59.9 (474) 54.3 (150) 68.5 (178) 57.3 (146)
Health-related factors
Number of chronic diseases % (n) 0.001
0–1 29.5 (233) 24.6 (68) 30.0 (78) 34.1 (87)
2 30.1 (238) 34.1 (94) 26.9 (70) 29.0 (74)
3 and more 40.5 (320) 41.3 (114) 43.1 (112) 36.9 (94)
Number of disabilities % (n) 0.001
Not known disabilities 20.4 (161) 17.0 (47) 24.2 (63) 20.0 (51)
1–6 52.1 (412) 50.0 (138) 56.9 (148) 49.4 (126)
7–12 18.7 (148) 21.4 (59) 13.8 (36) 20.8 (53)
13–17 8.8 (70) 11.6 (32) 5.0 (13) 9.8 (25)
likely to have never smoked (p = 0.04), but to be diagnosed with cardiovascular disease (p = 0.04) at baseline compared with the other DP.
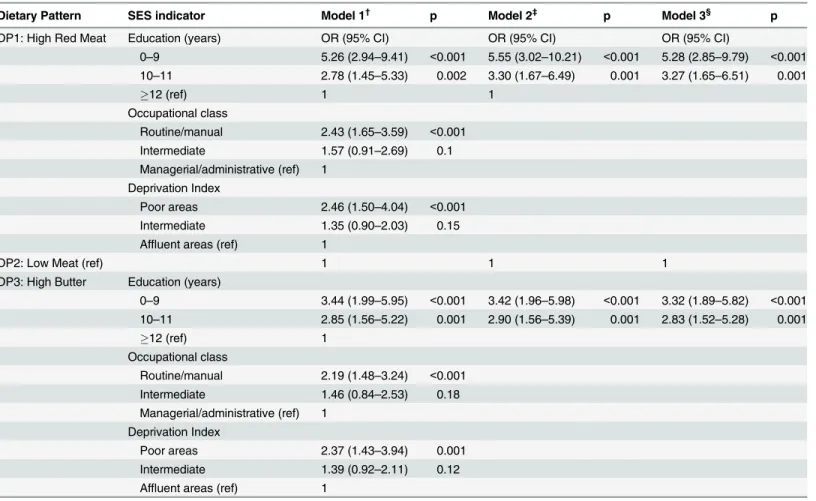
SES determinants of DP membership
Utilizing multinomial logistic regression, we examined the likelihood of belonging to a less healthy DP (‘High Red Meat’[DP1] and‘High Butter’[DP3]) compared with the healthier DP (‘Low Meat’[DP2]) based on SES indicators over the lifespan (i.e. education, occupation, and deprivation index) (Table 5). All three SES measures separately predicted DP1 and DP3 mem-bership (Model 1). For example, participants with low education level (0–9 years) were more likely to belong to DP1 (OR [95% CI]: 5.26 [2.94–9.41], p<0.001) and DP3 (3.44 [1.99–5.95],
p<0.001) compared with those with higher education attainment (12 years). Similar associa-tions were observed for those living in poorer compared with more affluent areas (DP1: 2.46 [1.50–4.04], p<0.001; DP3: 2.37 [1.43–3.94], p = 0.001). However, in a model with all three
SES indicators, only lower educational attainment (both low and middle) predicted‘High Red Meat’and‘High Butter’membership. This effect remained significant after adjusting for life-style (physical activity and smoking) and health-related factors (BMI and cognitive status at baseline) (e.g. OR [95% CI] for low vs. higher education for DP1: 5.55 [3.02–10.21], p<0.001;
DP3: 3.42 [1.96–5.98], p<0.001) (Model 3).
Adjusting for total energy intake in the final model or additionally adjusting for type of home, sex and marital status did not change the associations between education and both less healthy DP (details not shown). Similar results were obtained when models were fitted to a sub-sample of participants after excluding those living in institutions (n = 70). Lower com-pared with higher educational attainment was associated with 4 to 7-fold increased likelihood
Table 4. (Continued)
Characteristic All participants* DP1: High Red Meat DP2: Low Meat DP3: High Butter p†
n = 791 n = 276 n = 260 n = 255
BMI‡
% (n) 0.02
Underweight (<18.5) 6.1 (48) 4.3 (12) 6.2 (16) 7.8 (20)
Normal (>18.5–25) 55.0 (435) 51.4 (142) 57.3 (149) 56.5 (144)
Overweight (>25–30) 29.8 (236) 31.2 (86) 30.4 (79) 27.8 (71)
Obese (>30) 9.1 (72) 13.0 (36) 6.2 (16) 7.8 (20)
Depressive symptoms§% (n) 0.009
0-5/none 75.3 (591) 72.7 (197) 81.5 (212) 71.7 (182)
6-7/mild 12.5 (98) 13.3 (36) 10.4 (27) 13.8 (35)
8/severe 7.8 (61) 7.7 (21) 6.9 (18) 8.7 (22)
MMSE<15 4.5 (35) 6.3 (17) 1.2 (3) 5.9 (15)
Cognitive status % (n) <0.001
impaired (25 MMSE score) 27.2 (214) 34.4 (94) 18.1 (47) 28.6 (73)
normal (26–30) 72.8 (574) 65.6 (179) 81.9 (213) 71.4 (182)
BMI, body mass index; MMSE, Mini-Mental State Examination; COPD, chronic obstructive pulmonary disease.
*Two participants with assigned dietary pattern did not have complete health assessments and GP records data, and were excluded from the analyses.
†
Kruskal-Wallis test for ordered and non-normally distributed continuous variables andχ2test for categorical variables. In thepost hocχ2test analyses,
adjusted residuals were used to determine which cells were major contributors to rejecting the null hypothesis atα= 0.05.
‡
BMI was imputed with sex-specific means for 62 participants.
§Fifteen point Geriatric Depression Scale (GDS).
of belonging to DP1 (p<0.001) and 2 to 3-fold increased likelihood of belonging to DP3
(p = 0.001) among community-dwelling participants (S4 Table).
Discussion
Utilising dietary data collected by 24-hr MPR on two occasions from participants in the New-castle 85+ Study, we identified three unique DP in very old adults living in the community including those in institutions in the North East of England. DP varied with key sociodemo-graphic, lifestyle, health and functioning factors.‘High Red Meat’(DP1) was characterised by higher intake of red meats/meat dishes (pork, beef, lamb), gravy, potato/potato dishes, unsatu-rated fats spreads and lower intake of butter, and had the highest percent energy from protein and starch.‘Low Meat’(DP2) was under-represented by potentially less healthy foods (e.g. red meat/meat dishes, potato/potato dishes), and over-represented in healthier foods (e.g. fruits, whole grains, fish). Participants in the‘High Butter’(DP3) cluster were most likely to be butter consumers, had very low intake of unsaturated fat spreads, and had the highest percent energy
Table 5. Socioeconomic determinants of dietary pattern membership*.
Dietary Pattern SES indicator Model 1† p Model 2‡ p Model 3§ p
DP1: High Red Meat Education (years) OR (95% CI) OR (95% CI) OR (95% CI)
0–9 5.26 (2.94–9.41) <0.001 5.55 (3.02–10.21) <0.001 5.28 (2.85–9.79) <0.001 10–11 2.78 (1.45–5.33) 0.002 3.30 (1.67–6.49) 0.001 3.27 (1.65–6.51) 0.001
12 (ref) 1 1
Occupational class
Routine/manual 2.43 (1.65–3.59) <0.001 Intermediate 1.57 (0.91–2.69) 0.1 Managerial/administrative (ref) 1
Deprivation Index
Poor areas 2.46 (1.50–4.04) <0.001 Intermediate 1.35 (0.90–2.03) 0.15 Affluent areas (ref) 1
DP2: Low Meat (ref) 1 1 1
DP3: High Butter Education (years)
0–9 3.44 (1.99–5.95) <0.001 3.42 (1.96–5.98) <0.001 3.32 (1.89–5.82) <0.001 10–11 2.85 (1.56–5.22) 0.001 2.90 (1.56–5.39) 0.001 2.83 (1.52–5.28) 0.001
12 (ref) 1
Occupational class
Routine/manual 2.19 (1.48–3.24) <0.001 Intermediate 1.46 (0.84–2.53) 0.18 Managerial/administrative (ref) 1
Deprivation Index
Poor areas 2.37 (1.43–3.94) 0.001
Intermediate 1.39 (0.92–2.11) 0.12 Affluent areas (ref) 1
ref, referent
*Multinomial logistic regression with stepwise forward entry
†each SES indicator entered separately ‡
SES indicators entered together
§additionally adjusted for lifestyle (physical activity, smoking) and health-related factors (BMI, cognitive status)
from total fat and SFA. Compared with DP1 and DP3, participants in DP2 were healthier (i.e. less cognitive impairment and depressive symptoms) and less disabled, and were more advan-taged in all three indicators of SES (i.e. education, occupation, and deprivation index). Mem-bership of this favourable DP was predicted by higher educational attainment irrespective of other SES measures and important covariates, and was unrelated to the type of residence.
Diet and dietary patterns (DP) as modifiable lifestyle factors have been intensively investi-gated in relation to various health outcomes in middle and later life, but the extent to which diet/DP affects health and functioning in the very old (those aged 85+) is poorly understood. Equally, there is a paucity of data addressing the socioeconomic (SES) determinants of dietary choices in this age group. To our knowledge, the present study is the first cohort study to show associations between education and dietary habits in very late life. This apparent effect of edu-cation was in addition to other SES advantages associated with higher social class (occupation) and the prosperity of the area of residency.
Because of the lack of studies evaluating diet in the very old, we contrasted our findings with the results from several recent studies conducted in Europe and North America which included older adults aged 85+ and employeda posteriori(exploratory) approaches to derive DP. How-ever, dissimilarities in the methodology for dietary assessment (e.g. food frequency question-naires (FFQ) versus 24-hr MPR) and the exploratory statistical techniques (e.g. factor analysis versus clustering) used to characterise DP in a specific population of older adults make these comparisons difficult—a recognized disadvantage ofa posterioriapproaches to DP analysis [45]. We opted for a clustering method (i.e. Two-Step) which described total, habitual dietary patterns in this cohort by creating unique and mutually exclusive dietary groups based on simi-larities of food/nutrient intake of individuals within each DP [29]. As a composite measure for complex combinations of foods/nutrients, such DP can act as a single measure of dietary expo-sure which can be linked with various health outcomes, lifestyle, and SES determinants. How-ever, the utility of the derived DP depends critically on the robustness of the dietary assessment method used to collect the primary dietary data and the resultant clustering variables [27,28]. To assess diet in the very old we employed the 24-hr MPR, which was validated for use in this age group in a pilot study, and yielded more realistic estimates of energy and nutrients com-pared with a FFQ [33].
Despite some methodological differences across these studies, and demographic, cultural and geographic dissimilarities of the populations included,‘healthier’DP were apparent in all studies which examined associations with health-promoting behaviours and with higher SES (i.e. higher education and income) [10–13,22,46]. On the other hand,‘less healthy’DP domi-nated among older adults with lower educational attainment and less income [10,12,46] (S5 Table).
of the type of residency (i.e. living in institution or not). This finding is in agreement with the cumulative disadvantage hypothesis which posits that the negative effect of low education attainment on health and health-related behaviors (e.g. diet) increases with age [48]. In relation to health, higher education not only offers possibilities for greater economic resources and higher social status associated with more prestigious occupation, but also may provide greater interest in health risks and in implementing sustained healthier lifestyles which enhance the individual’s sense of control over life outcomes [49,50]. Whilst this emphasises the likely importance of education on lifelong health, it should not be seen as an impediment to the development of suitably-tailored interventions to promote healthier dietary choices in later life [51,52], and consequently to preserve and improve health and functioning of very old
‘survivors’.
This is the first study to characterise the dietary patterns of the very old (aged 85+), includ-ing those in institutions. Strengths of this study include: (a) diet assessment by the 24-hr MPR which has been validated in this cohort/age group [33]; (b) use of an exploratory approach and clustering analysis to derive DP, which provided descriptions of the habitual dietary behaviours of the target population; (c) use of several analytic techniques to ensure the robustness of the final DP solution, and (e) use of a range SES indicators across the lifespan.
The present analysis is limited by its cross-sectional design and by a single measure of die-tary exposure—therefore no causality can be inferred. As the DP derived here are based on the dietary intake of the population under study, our findings may not be generalizable to other populations of very old adults who have different dietary habits for cultural or other reasons. Although the 24-hr MPR provided a better estimate of energy intake (EI) than the FFQ in this cohort [33], dietary mis-reporting remains a potentially significant issue [53]. The Cardiovas-cular Seniors and Built Environment Study of older adults aged 60 to 99 [20] excluded those reporting<500 kcal and>5000 kcal per day prior to DP analysis, although in our sample we
had no participants below 500 or above 5000 kcal. Use of biomarker-based approaches which do not rely on self-reported dietary intake may enhance the robustness of future dietary assess-ments in very old people [54]. We used the IMD as a more current SES indicator in very late life. However the IMD is a weighted, aggregatedarealevel of deprivation in seven domains [38], and therefore does not conceptualise individual experiences of deprivation. Lastly, our sample as other late-life cohorts, may be underrepresented in older adults with low SES who may have experienced increased mortality by the age of 85, and therefore our sample may have reduced power to detect SES differences.
To summarise, we established three distinct DP in the very old adults living in the NE England, which varied by sociodemographic, health and functioning, lifestyle and nutritional factors. Higher educational attainment was strongly associated with a healthier diet 60+ years later above and beyond advantages provided by higher social class (occupation) and the afflu-ence of residential area. Future studies in this cohort will determine associations between DP and health outcomes over time, in particular whether these DP appear to modulate trajectories in cognition, disability and frailty beyond the age of 85 years.
Supporting Information
S1 Table. Food items included in 30 food group used in the cluster analysis.
(DOCX)
S2 Table. Mean daily intake (g) of 10 food groups with highest to lowest importance factor by dietary patterns.
S3 Table. Major baseline chronic diseases by dietary patterns.
(DOCX)
S4 Table. Socioeconomic determinants of dietary pattern membership in community-dwellers.
(DOCX)
S5 Table. Selected studies of older adults reporting inverse relationship between DP
deriveda posterioriand SES indicators.
(DOCX)
Acknowledgments
We acknowledge the operational support of the North of England Commissioning Support Unit and of the local general practitioners and their staff. We thank the research, management and clerical team of the Newcastle 85+ Study Core Team for outstanding work throughout, as well as many colleagues for their expert advice. Thanks are due especially to the study partici-pants and, where appropriate, their families and carers.
Author Contributions
Conceived and designed the experiments: AG CJ. Performed the experiments: AG. Analyzed the data: AG. Contributed reagents/materials/analysis tools: AG CJ. Wrote the paper: AG KD JCM CJ. Design, conduct and acquisition of the Newcastle 85+ Study: KD TK CJ. Critical revi-sion of the manuscript for important intellectual content: AG KD AA TK TRH MS JCM CJ. Obtained funding for the Newcastle 85+ Study funding: TK CJ. Final approval of the version to be submitted: AG KD AA TK TRH MS JCM CJ. Full responsibility for the integrity of the data and the accuracy of the data analysis: AG.
References
1. Sofi F, Macchi C, Abbate R, Gensini GF, Casini A. Mediterranean diet and health status: an updated meta-analysis and a proposal for a literature-based adherence score. Public Health Nutr 2014; 17: 2769–2782. doi:10.1017/S1368980013003169PMID:24476641
2. Siervo M, Lara H, Chowdhury S, Ashor A, Oggioni C, Mathers JC. Effects of the Dietary Approach to Stop Hypertension (DASH) diet on cardiovascular risk factors: a systematic review and meta-analysis. Br J Nutr 2014 Nov 28: 1–15. doi:10.1017/S0007114514003341
3. Atkins J, Whincup PH, Morris RW, Lennon LT, Papacosta O, Wannamethee SG. High diet quality is associated with a lower risk of cardiovascular disease and all-cause mortality in older men. J Nurt 2014; 144: 673–680.
4. Larsson SC, Akesson A, Wolk A. Healthy diet and lifestyle and risk of stroke in a prospective cohort of women. Neurology 2014; 83: 1699–1704. doi:10.1212/WNL.0000000000000954PMID:25298305
5. Tangney CC, Li H, Wang Y, Barnes L, Schneider JA, Bennett DA, et al. Relation of DASH- and Mediter-ranean-like dietary patterns to cognitive decline in older persons. Neurology 2014; 83: 1410–1416. doi: 10.1212/WNL.0000000000000884PMID:25230996
6. Gu Y, Scarmeas N. Dietary patterns in Alzheimer’s disease and cognitive aging. Curr Alzheimer Res 2011; 8: 510–519. PMID:21605048
7. Reedy J, Krebs-Smith SM, Miller PE, Liese AD, Kahle LL, Park Y, et al. Higher diet quality is associated with decreased risk of all-cause, cardiovascular disease, and cancer mortality among older adults. J Nutr 2014; 144: 881–889. doi:10.3945/jn.113.189407PMID:24572039
9. Anderson AL, Harris TB, Tylavsky FA, Perry SE, Houston DK, Hue TF, et al. Dietary patterns and sur-vival in older adults. J Am Diet Assoc 2011; 111: 84–91. doi:10.1016/j.jada.2010.10.012PMID: 21185969
10. Bamia C, Orfanos P, Ferrari P, Overvad K, Hundborg HH, Tjønneland A, et al. Dietary patterns among
elderly Europeans: the EPIC-Elderly study. Br J Nutr 2005; 94: 100–113. PMID:16115339
11. Willcox DC, Scapagnini G, Willcox BJ. Healthy aging diets other than the Mediterranean: a focus on the Okinawan diet. Mech Ageing Dev 2014; 136–137: 148–162. doi:10.1016/j.mad.2014.01.002PMID: 24462788
12. Hsiao PY, Mitchell DC, Coffman DL, Allman RM, Locher JL, Sawyer P, et al. Dietary patterns and diet quality among diverse older adults: The University of Alabama at Birmingham Study of Aging. J Nutr Health Aging 2013; 17: 19–25. doi:10.1007/s12603-012-0082-4PMID:23299373
13. Corrêa Leite ML, Nicolosi A, Cristina S, Hauser WA, Pugliese P, Nappi G. Dietary and nutritional pat-terns in an elderly rural population in Northern and Southern Italy: (I). A cluster analysis of food compo-sition. Eur J Clin Nutr 2003; 57: 1514–1521. PMID:14647215
14. Shatenstein B, Gauvin L, Keller H, Richard L, Gaudreau P, Giroux F, et al. Baseline determinants of global diet quality in older men and women from the NuAge cohort. J Nutr Health Aging 2013; 17: 419–
425. doi:10.1007/s12603-012-0436-yPMID:23636542
15. Payette H, Shatenstein B. Determinants of healthy eating in community-dwelling elderly people. Can J Public Health 2005; 96 Suppl 3: S27–31, S30–5. PMID:16042161
16. Larrieu S, Letenneur L, Berr C, Dartigues JF, Ritchie K, Alperovitch A, et al. Sociodemographic differ-ences in dietary habits in a population-based sample of elderly subjects: the 3C study. J Nutr Health Aging 2014; 8: 497–502.
17. Conklin AI, Forouhi, Surtees P, Khaw K-T, Wareham NJ, Monsivais P. Social relationship and healthful dietary behaviour: Evidence from over-50s in the EPIC cohort, UK. Soc Sci Med 2014; 100: 167–175. doi:10.1016/j.socscimed.2013.08.018PMID:24035440
18. Hiza AB, Casavale KO, Guenther PM, Davis C. Diet quality of Americans differs by age, sex, race/eth-nicity, income, and education level. J Acad Nutr Diet 2012; 113: 297–306. doi:10.1016/j.jand.2012.08. 011PMID:23168270
19. Finger JD, Tylleskär T, Lampert T, Mensink GBM. Dietary behaviour and socioeconomic position: The role of physical activity patterns. PloS ONE 2013; 8: e78390. doi:10.1371/journal.pone.0078390PMID: 24223150
20. Deierlein AL, Morland KB, Scanlin K, Wong S, Spark A. Diet quality of urban older adults age 60 to 99 years: The Cardiovascular Seniors and Built Environment Study. J Acad Nutr Diet 2013; 114: 279–287. doi:10.1016/j.jand.2013.09.002PMID:24262516
21. Lalluka T, Laaksonen M, Rahkonen O, Roos E, Lahelma E. Multiple socio-economic circumstances and healthy food habits. Eur J Clin Nutr 2007; 61: 701–710. PMID:17180154
22. Mullie P, Clarys P, Hulens M, Vansant G. Dietary patters and socioeconomic position. Eur J Clin Nutr 2010; 64: 231–238. doi:10.1038/ejcn.2009.145PMID:20087378
23. Dynesen AW, Haraldsdóttir J, Holm L, Astrup A. Sociodemographic differences in dietary habits described by food frequency questions—results from Denmark. Eur J Clin Nutr 2003; 57: 1586–1597. PMID:14647224
24. Galobardes B, Morabia A, Bernstein MS. Diet and socioeconomic position: does the use of different indicators matter? Int J Epidemiol 2001; 30: 334–340. PMID:11369739
25. Shahar D, Shai I, Vardi H, Shahar A, Fraser D. Diet and eating habits in high and low socioeconomic groups. Nutrition 2004; 21: 559–566.
26. Hu FB. Dietary pattern analysis: a new direction in nutritional epidemiology. Curr Opin Lipid 2002; 13: 3–9.
27. Kant AK. Dietary patterns and health outcomes. J Am Diet Assoc 2004; 104: 615–635. PMID:15054348
28. Slattery M. Analysis of dietary patterns in epidemiological research. Appl Physiol Nutr Metab 2010; 35: 207–210. doi:10.1139/H10-006PMID:20383234
29. Newby PK, Tucker KL. Empirically derived eating patterns using factor or cluster analysis: A review. Nutr Rev 2004; 62: 177–203. PMID:15212319
30. Collerton J, Barrass K, Bond J, Eccles M, Jagger C, James O, et al. The Newcastle 85+ study: biologi-cal, clinical and psychological factors associated with healthy ageing: study protocol. BMC Geriatrics 2007; 7: 14. PMID:17594470
32. Nelson M, Erens B, Bates B, Church S, Boshier T. Low Income Diet and Nutrition Survey. London: Food Standards Agency, HMSO; 2007.
33. Adamson AJ, Collerton J, Davies K, Foster E, Jagger C, Stamp E, et al. Nutrition in advanced age: die-tary assessment in the Newcastle 85+ study. Eur J Clin Nutr 2009; 63 Suppl 1:S6–S18. doi:10.1038/ ejcn.2008.60PMID:19190647
34. Moshfegh AJ, Rhodes DG, Baer DJ, Murayi T, Clemens JC, Rumpler WV, et al. The US Department of Agriculture Automated Multiple-Pass Method reduces bias in the collection of energy intakes. Am J Clin Nutr 2008; 88: 324–332. PMID:18689367
35. Nelson M, Atkinson M, and Meyer J. A Photographic Atlas of Food Portions Sizes. London: MAFF pub-lications; 1997.
36. Food Standards Agency. McCance and Widdowson's the composition of foods, sixth summary edition. Cambridge: Royal Society of Chemistry; 2002.
37. Chandola T, Jenkinson C. The new UK National Statistics Socio-Economic Classification (NS-SEC); investigating social class differences in self-reported health status. J Public Health Med 2000; 22: 182–
190. PMID:10912557
38. Noble M, Wright G, Dibben C, Smith GAN, McLennan D, Anttila C, et al. The English Indices of Depriva-tion 2004. London: Office of the Deputy Prime Minister. 2004. Available:www.communities.gov.uk/ publications/communities/englishindices. Accessed 12 October 2014.
39. Molloy DW, Standish TI. A guide to standardize Mini-Mental State Examination. Int Psychogeriatr 1997; 9: 87–94. PMID:9447431
40. Chiu T, Fang D, Chen J, Wang Y, Jeris C. A robust and scalable clustering algorithm for mixed type attributes in large database environment. In: Proceedings of the 7th ACM SIGKDD international confer-ence on knowledge discovery and data mining; 2001. pp. 263–268.
41. Bacher J, Wenzig K, Vogler M. SPSS two-step cluster—a first evaluation. In: RC33 sixth international conference on social science methodology: Recent developments and applications in social research methodology. Amsterdam; 2004.
42. Everitt BS, Landau S, Leese M. Clustering analysis. London: Arnold; 2001.
43. Romesburg HC. Clustering analysis for researchers. Morrisville, NC: Lulu Press; 2004.
44. Martin-Ruiz C, Jagger C, Kingston A, Collerton J, Catt M, Davies K, et al. Assessment of a large panel of candidate biomarkers of ageing in the Newcastle 85+ study. Mech Ageing Dev 2011; 132: 496–502. doi:10.1016/j.mad.2011.08.001PMID:21864562
45. Devlin UM, McNulty BA, Nugent AP, Gibney MJ. The use of cluster analysis to derive dietary patterns: methodological consideration, reproducibility, validity and the effect of energy mis-reporting. Proc Nutr Soc 2012; 71: 599–609. doi:10.1017/S0029665112000729PMID:22863306
46. Pryer JA, Cook A, Shetty P. Identification of groups who report similar pattern of diet among a represen-tative national sample of British adults aged 65 years of age and more. Public Health Nutr 2001; 4: 787–795. PMID:11415486
47. Turrell G, Hewitt B, Patterson C, Oldenburg B. Measuring socio-economic position in dietary research: is choice of socio-economic indicator important? Public Health Nutr 2001; 6: 191–200.
48. Dupre ME. Educational differences in age-related patterns of disease: reconsidering the cumulative disadvantage and age-as-leveler hypothesis. J Health Sci Behav 2007; 48: 1.
49. Mirowsky J, Ross CE. Education, personal control, lifestyle and health: A human capital hypothesis. Res Aging 1998; 20: 415–449.
50. Reynolds JR, Ross CE. Social stratification and health: Education’s benefit beyond economic status and social origins. Soc Probl 1998; 45: 221–247.
51. Celis-Morales C, Lara J, Mathers JC. Personalising nutritional guidance for more effective behaviour change. Proc Nutr Soc 2014 Dec 12:1–9. doi:10.1017/S0029665114001633
52. Lara J, McCrum LA, Mathers JC. Association of Mediterranean diet and other health behaviours with barriers to healthy eating and perceived health among British adults of retirement age. Maturitas 2014; 79: 292–298. doi:10.1016/j.maturitas.2014.07.003PMID:25096829
53. Penn L, Boeing H, Boushey CJ, Dragsted LO, Kaput J, Scalbert A, et al. Assessment of dietary intake: NuGO symposium report. Genes Nutr 2010; 5: 205–213. doi:10.1007/s12263-010-0175-9PMID: 21052527