www.rpped.com.br
REVISTA
PAULISTA
DE
PEDIATRIA
ORIGINAL
ARTICLE
Dietary
patterns
of
children
and
socioeconomical,
behavioral
and
maternal
determinants
Julia
Khéde
Dourado
Villa
∗,
Thanise
Sabrina
Souza
Santos,
Andréia
Queiroz
Ribeiro,
Angélica
Ribeiro
e
Silva,
Luciana
Ferreira
da
Rocha
Sant’Ana,
Milene
Cristine
Pessoa
UniversidadeFederaldeVic¸osa(UFV),Vic¸osa,MG,Brazil
Received13June2014;accepted9October2014 Availableonline30June2015
KEYWORDS
Dietarypatterns; Children; Socioeconomic conditions; Dietarybehavior
Abstract
Objective: Toidentifydietarypatternsofchildren andtoverifytheirassociationwith socio-economical,behavioralandmaternaldeterminants.
Methods: Across-sectionalstudywitharandomsampleof328children aged8and9years. Dietaryintakewasassessedbyfoodrecordsinthreenonconsecutivedaysandmeasuredingrams offoodgroupsandnutrients.Factoranalysisandsubsequentorthogonalrotation(varimax)were usedtodeterminedietarypatterns.Ordinallogisticregressionwasusedtoassessassociations betweendietarypatternsandthestudieddeterminants.
Results: Five dietary patterns were observed: ‘‘Traditional,’’ ‘‘Sweetened beverages and snacks,’’‘‘Monotonous,’’‘‘Healthy’’and‘‘Egg-dairy.’’A highermaternal levelofeducation wasdirectlyassociatedwith‘‘Sweetenedbeveragesandsnacks’’and‘‘Egg-dairy’standards. Lowincome children who were submitted togreater food restriction by parents/guardians followed themore‘‘Traditional’’standard, representedbythe consumptionofrice, beans, vegetables,cookedrootsandtubersandredmeat.The‘‘Monotonous’’pattern,represented byahighconsumptionofmilkandchocolatepowder,wasmostfollowedbychildrenfromthe middleclass.Childrenlivinginruralareasconsumedmorefoodsfromthe‘‘Egg-dairy’’pattern, whencomparedtothosefromtheurbanarea.
Conclusions: Dietarypatternsofchildren wereassociatedwithfamilysocioeconomicstatus, maternal levelofeducation,practiceoffood restriction by parents/guardiansandlocation
DOIoforiginalarticle:http://dx.doi.org/10.1016/j.rpped.2015.05.001 ∗Correspondingauthor.
E-mail:[email protected](J.K.D.Villa).
ofresidenceinurbanorruralarea.Better socioeconomicconditionscontributedtoamore nutritionallyinadequatedietarypattern.
© 2015 Sociedadede Pediatriade São Paulo. Publishedby Elsevier Editora Ltda. Allrights reserved.
PALAVRAS-CHAVE
Padrõesalimentares; Crianc¸as;
Condic¸ões socioeconômicas; Comportamento alimentar
Padrõesalimentaresdecrianc¸asedeterminantessocioeconômicos,comportamentais ematernos
Resumo
Objetivo: Identificarospadrõesalimentaresdecrianc¸aseverificarsuaassociac¸ãocom deter-minantessocioeconômicos,comportamentaisematernos.
Métodos: Estudotransversal comamostraaleatóriade 328crianc¸as deoito enoveanos. O consumoalimentarfoiavaliadoporregistrosalimentaresdetrêsdiasnãoconsecutivose quan-tificado em gramas de grupos alimentares e de nutrientes. Análise fatorial e subsequente rotac¸ãoortogonal(varimax)foramusadasparadeterminarospadrõesalimentares.Regressão logísticaordinalfoiusadaparaverificarassociac¸õesentrepadrõesalimentareseos determin-antesestudados.
Resultados: Cincopadrõesalimentaresforamextraídos:‘‘Tradicional’’,‘‘Bebidasadoc¸adase lanches’’,‘‘Monótono’’,‘‘Saudável’’e‘‘Ovo-lacto’’.Amaiorescolaridadematernaseassociou deformadiretaaospadrões‘‘Bebidasdoceselanches’’e‘‘Ovo-lacto’’.Crianc¸asdebaixonível econômicoequerecebiammaiorrestric¸ãoalimentarpelospais/responsáveisaderirammaisao padrão‘‘Tradicional’’,representadopeloconsumodearroz,feijão,hortalic¸as,raízese tubér-culoscozidosecarnevermelha.Opadrão‘‘Monótono’’,representadopeloelevadoconsumo deleiteeachocolatado,foimaisconsumidoporcrianc¸asdeclasseeconômicaintermediária. Crianc¸asqueresidiamemzonaruralconsumiammaisalimentosdopadrão‘‘Ovo-lacto’’ com-paradascomasdezonaurbana.
Conclusões: Ospadrõesalimentaresdascrianc¸asestiveramassociadosàscondic¸ões econômi-casdafamília,escolaridadematerna,práticaderestric¸ãoalimentarpelospais/responsáveis e localizac¸ão daresidência em zona urbana ourural. Melhores condic¸ões socioeconômicas contribuíramparaumpadrãoalimentarnutricionalmentemaisinadequado.
© 2015Sociedadede Pediatriade SãoPaulo. Publicado porElsevier Editora Ltda.Todosos direitosreservados.
Introduction
Childhood is a crucial period for the implementation of healthy eating and lifestyle habits, which are predictive foradultlife.1‘‘PesquisadeOrc¸amentosFamiliares’’(The
HouseholdBudgetSurvey)indicatedthatthefood consump-tionoftheBrazilianpopulationcombinesatraditionaldiet basedonriceandbeanswithfoodswithfewnutrientsand manycalories.2
Traditionally, studies that assess the population’s food intakearebasedonanalysisofmacroandmicronutrients. Currently,theassessmentofoverallfoodconsumption has been appreciated, as it better reflects the actual diet status.3 The study of dietary patterns allows associations
between food combinationsand certain health conditions tobemade,oftennotdetectedinisolatedanalysesoffood ornutrients.4Anotheradvantageofanalyzing dietary
pat-ternsisduetoitscapacitytoreducethenumberofvariables generatedinthefoodintakeanalysistoasmallnumberof factors,withhighlyinter-correlateditemsandasignificant representationofthetotaldiet.5,6
The study of health status in children should not be performed without understanding the family and social
context in which the child is inserted. Parents influence theformation of the child’sfood habitsthrough thefood available in the household.1,7 In addition, parents tend
to have their eating behaviors reproduced by the child, andtheyareimportantinestablishingrulesandstandards relatedtofoodpracticesandlifestyle.8
Socioeconomic factors are important determinants of individualfood consumption. In developing countries,the increaseinobesityhasbeenfoundmainlyinthehigher socio-economicclasses.7,9Factorssuchaswomenworkingoutside
thehome, easier preparationof food and behavior varia-blesalsocontributetothequalityofthechildren’sdiet.10
Therefore,thisstudyaimedtoidentifythedietarypatterns ofchildrenandverifytheirassociationwithsocioeconomic, behavioralandmaternalfactors.
Method
andruralareasofVic¸osa(n=1297),consideringaprevalence of 50% of metabolic syndrome, the outcome investigated inthebiggerstudyinwhichthisworkisinserted.Thereis noconsensusregardingthediagnosticcriteriaofmetabolic syndromeinchildren, andbyusing theprevalence of50% for sample calculation, the maximum sample number is guaranteed.Apermissibleerrorof 5%wasalsoconsidered for thecalculation, a 95% confidence intervaland a sam-pleloss of 20%, plus 10% for multivariate analysis, which resulted in the calculated sample of 385 children. Epi-Info 7.0 software was used for sample size calculation. Children’s participationin the study occurred by drawing lots, with proportionality preservation by type of educa-tionalinstitution(public/private)andlocationofresidence (urban/rural).Theexclusioncriteriawerethepresenceof cardiovascular disease and/or type 1 diabetes, reported by parents/guardians and/or use of hypotensive or lipid-loweringdrugs.Childrenwereexcludediftheyhadabsent orincompletedatathatwereessentialtotheanalyses.
Thefamilysocioeconomicstatuswascategorized accord-ing to the ‘‘Critério de Classificac¸ão Econômica Brasil’’ (BrazilEconomicClassificationCriteria),asclassesA,B1,B2, C1,C2andD.11Maternaleducationwascategorizedas:0---4,
5---8,9---11and12ormoreyearsofschooling.Binary varia-blesofhomelocation(urban/ruralzone)andmaternalwork outsidethe home (yes/no)were used.The mother’s time spentwiththechildwasanalyzedasacontinuousvariable (hours/day).
Thedegreeoffoodrestrictionwasevaluatedbythe atti-tudeoftheparent/guardianwhenofferingthechildeachof thefollowing15fooditems:chocolatecake,sandwich cook-ies,snacks, hamburger, fries, pizza, artificial juices, soft drinks,milkanddairyproducts,butter,popcorn,ice-cream, chocolate,sweet piesandchewinggum.The collectionof thisvariablewasperformedusingastructuredquestionnaire bythestudyauthors.Parents/guardianswereaskedifthey ‘‘always,’’‘‘sometimes,’’or‘‘never’’offeredthesefoods to their children. The degree of food restriction by par-ents/guardianswasevaluatedbythepercentageofanswers ‘‘never.’’
Children’s dietary intake was assessed by food pat-terns determined from 3-day food records. The children were asked to fill in the records, with the help of parents/guardiansandtogiveaccurateandcomplete infor-mationaboutfoodandconsumedquantities,coveringthree non-consecutivedays,withonedaybeingontheweekend.12
All records were reviewed by researchers together with the children and parents/guardians, with the help of a photo album13 and of household items commonly used
todetermine food servings, in order to reduce recording biases.The meandaily intakeoftotal caloriesand grams ofcarbohydrates, proteins, lipids,monounsaturated fatty, polyunsaturated and saturated acids, fiber and sodium, relatedtothethreedaysofrecording,wasdeterminedwith theaidoftheDietProsoftware,release5i.
All food items mentioned in 3 days of recording were listed, in grams,in a specific worksheet. Then the foods weregroupedbasedonsimilarityoftheirnutritionalprofiles ortheirculinaryuse.Mixedpreparations,suchaslasagna, pizza and sandwiches were divided into their ingredients accordingtorecipesstandardizedbythestudyauthors,and theircomponentsweredirectedtotheappropriategroups.12
Themeanindividualdailyconsumptionoffoodgroupswas calculated.
Subsequently, the identification of the dietary pat-terns was performed using principal component analysis (PCA).BeforethePCA,theKaiser---Mayer---Olkincoefficient (KMO=0.56)wasestimated,aswellastheBartlett spheric-itytest(p<0.001),whichindicatethatthedata,according to the qualityof their correlations,could be used in the PCA.14The numberoffactorstoberetainedwasbasedon
thecriterionofeigenvalues>1.0and,onthevariancechart, bythenumberofcomponents(screeplot).15Subsequently,
thefactorsweresubmittedtovarimaxorthogonalrotation for the demonstration of simpler structures,with greater interpretabilityandstatisticalindependence.
Factor loadings represent the correlation coefficients betweenthedifferentfoodgroupsineachdietarypattern, andfoodgroupswithpositivechargesdirectlycontributeto adietarypattern,whereasgroupswithnegativechargesare inverselyassociatedwithadietary pattern.16 Foodgroups
withfactorloadings>0.3wereconsideredasimportant con-tributors tothedietarypattern.Each dietarypatternwas named accordingtothe characteristicsofthefoodgroups thathadhigherfactorloading.Attheend,ascorewas cal-culatedforeachparticipantineachpattern,byaddingthe individualconsumption of eachfood groupweighed byits factorloading.15Then,theindividualscoreswere
standard-ized(zscore).Higherzscoresrepresentgreateradherence ofthechildtocertaindietarypatterns.
Descriptivestatisticswereusedtocharacterizethe sam-ple according to food consumption and socioeconomic, behavioral and maternal characteristics. Data asymmetry wasverifiedbytheShapiro---Wilktest.Differencesbetween groupswereverifiedusingtheMann---Whitneytest.
Consumption scores of each child for each pattern werecategorizedintotertilesforassociativeanalysis.The bivariateordinallogisticregressionwasusedtoassessthe associationbetweeneachpatternandeachsocioeconomic, behavioral and maternal variable assessed. These models allowed the calculation of the Odds Ratio (OR), i.e., the probabilityoftheoccurrenceofanevent.Predictor varia-blesthatshowedtohaveinfluencewithasignificancelevel <0.2inthebivariatemodelswereusedtocomposethefinal multiple model, which considered statistically significant thosewith˛<0.05.17
This study wascarriedout after approval bythe Insti-tutional Review Boardof Universidade Federal de Vic¸osa, Process N. 045/2012. Participation in the study occurred aftertheinformedconsentformwassignedbythechildren andtheirparents/guardians.
Results
Table1 Dietaryintakecharacteristicsinthesampleofchildrenaged8and9yearsenrolledinpublicandprivateschoolsof Vic¸osa,MinasGerais,2012and2013.
Foods Mean(SD) Median(Q1;Q3) Minimum Maximum
Nutrients
Calories 1619.8(437.0) 1579.9(1346;1862.2) 723.4 3615.9 Carbohydrates(g) 223.9(69.1) 215.1(181.3;255.0) 90.1 577.8 Proteins(g) 55.8(16.7) 54.1(44.6;65.4) 21.0 135.6 Lipids(g) 55.8(18.2) 53.9(44.0;65.4) 18.3 170.3 Monounsaturated(g) 15.0(6.0) 14.3(11.5;17.6) 4.1 48.5 Polyunsaturated(g) 9.7(4.2) 8.9(7.0;11.7) 2.0 30.2 Saturated(g) 16.5(6.1) 15.7(12.6;19.9) 3.1 44.4
Foodgroups(g)
Refinedpastaandgrains 141.5(70.4) 130.8(91.9;172.4) 26.7 507.3 Frenchfries,potatochipsandfried/greasypastries 35.8(39.5) 23.5(0;55.5) 0 207.0 Sweeteneddairybeverages 43.0(57.1) 25.0(0;66.7) 0 325.0
Milk 169.9(142.8) 150(56.7;239.2) 0 841.7
Cheese 10.9(20.2) 6.0(0;17.6) 0 101.5
Processedandcoldmeats 22.3(28.0) 14.7(0.1;124.0) 0 200.0 Sugarandchocolate-flavoredbeverages 18.7(15.0) 15.0(8.0;25.0) 0 96.0 Cookedrootsandtubers 26.9(51.0) 3.5(0;196.0) 0 526.4 Rice 140.2(90.4) 118.3(82.0;510.6) 0 711.5 Legumes 131.9(103.2) 110.0(57.8;170.4) 0 877.5 Artificialjuicesandsoftdrinks 170.9(178.1) 133.3(33.3;250.0) 0 1242.2 Greenvegetables 64.4(67.5) 46.4(21.2;85.5) 0 516.7 Chickenandfish 32.0(40.0) 21.6(0;43.3) 0 312.8 Beefandpork 46.1(47.1) 35.5(13.6;64.3) 0 346.2
Eggs 10.2(14.1) 0(0;16.7) 0 83.3
Fruit 90.6(109.8) 55.7(2.1;137.7) 0 767.7
Candy 30.1(43.9) 10.3(0;179.8) 0 313.3
Q1,quartile1;Q3,quartile3;SD,standarddeviation.
content. The items coffee, teas, oils and added fat were excluded, as they could be significant in many different patterns.18
SamplecharacterizationisshowninTable1.Alow con-sumptionoffruitsandvegetableswasobservedamongthe children. The mean consumption of these foods wasless than2.5 servingsa day for bothgenders, basedona 65g serving.19Artificialjuicesandsoftdrinkswereconsumedby
themajorityofchildren(76.5%).Onlycarbohydrateintake differedbetween genders,withhigherintakeamongboys (p=0.007)(datanotshown).
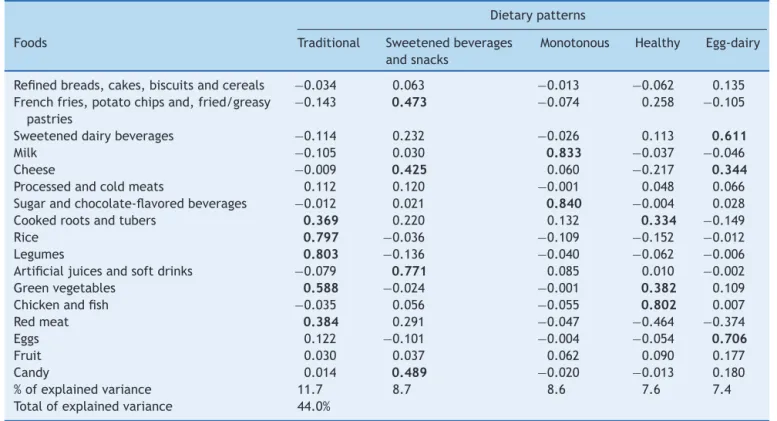
Five dietary patterns were extracted, which together explained 44.0% of the original data variance. The first pattern, entitled ‘‘Traditional,’’ explained 11.7% of the varianceand wasmainlyrepresentedby rice,beans, veg-etables,cookedrootsandtubersandredmeat.Thesecond pattern, called ‘‘Sweetened drinks andsnacks,’’ incorpo-rated8.7%ofthevarianceandwascharacterizedbyhigher intakeofartificialjuices,softdrinks,friedorgreasysnacks and sweets. The third pattern, called ‘‘Monotonous,’’ accountedfor8.6%ofthedatavariance,andwas characte-rizedonlybytheconsumptionofwholemilkandchocolate powder,foodsconsumedatahighfrequencyinthesample. The fourth pattern, called ‘‘Healthy,’’ explained 7.6% of the variance and was represented by the consumption of poultry, fish, vegetables, roots and tubers, and was inverselyassociatedwiththeconsumptionofredmeat.The lastcomponent,called‘‘Egg-dairy,’’accountedfor7.4%of
thetotalvariance, wascharacterizedbythe consumption of eggs, cheese and sweetened dairy beverages and was inverselyassociatedwithredmeat(Table2).
Therewasahighintakeofartificialjuicesandsoftdrinks amongthe children, and these were the foods that con-tributed themost tothe ‘‘Sweeteneddrinks and snacks’’ pattern, being consumed by 76.5% of the children at a meandailyamountof220mL(minimum:27.5mL;maximum: 1242.2mL).Theconsumptionofthesefoodswasassociated withtheconsumptionoffries,eatenby39%ofchildren;fried snacks,consumedby56%ofthesample;chips,eatenby18% ofchildren,andinstantnoodles,whichwaspartofthedaily consumption of approximately 10% of children. Children who consumed the highest amount of the abovemen-tionedfoods alsoreportedeatingmore fatty cheesesand sweets.
Table2 Dietarypatternsandspecificfactorloadsoffoodgroupsconsumedbychildren,Vic¸osa,MinasGerais,2012and2013.
Dietarypatterns
Foods Traditional Sweetenedbeverages andsnacks
Monotonous Healthy Egg-dairy
Refinedbreads,cakes,biscuitsandcereals −0.034 0.063 −0.013 −0.062 0.135
Frenchfries,potatochipsand,fried/greasy pastries
−0.143 0.473 −0.074 0.258 −0.105
Sweeteneddairybeverages −0.114 0.232 −0.026 0.113 0.611
Milk −0.105 0.030 0.833 −0.037 −0.046
Cheese −0.009 0.425 0.060 −0.217 0.344
Processedandcoldmeats 0.112 0.120 −0.001 0.048 0.066
Sugarandchocolate-flavoredbeverages −0.012 0.021 0.840 −0.004 0.028
Cookedrootsandtubers 0.369 0.220 0.132 0.334 −0.149
Rice 0.797 −0.036 −0.109 −0.152 −0.012
Legumes 0.803 −0.136 −0.040 −0.062 −0.006
Artificialjuicesandsoftdrinks −0.079 0.771 0.085 0.010 −0.002
Greenvegetables 0.588 −0.024 −0.001 0.382 0.109
Chickenandfish −0.035 0.056 −0.055 0.802 0.007
Redmeat 0.384 0.291 −0.047 −0.464 −0.374
Eggs 0.122 −0.101 −0.004 −0.054 0.706
Fruit 0.030 0.037 0.062 0.090 0.177
Candy 0.014 0.489 −0.020 −0.013 0.180
%ofexplainedvariance 11.7 8.7 8.6 7.6 7.4
Totalofexplainedvariance 44.0%
Factorloads>0,3(inbolds)representsignificantcontributionsoffoodgroupsforthecomponents.
Table3 Distribution ofchildren according to the socio-economic,behavioralandmaternalvariables,Vic¸osa,Minas Gerais,2012and2013.
Variables Distribution
Socioeconomiclevel
A 17(5.2)
B1 43(13.1)
B2 46(14.0)
C1 82(25.0)
C2 85(25.9)
D 55(16.8)
Maternalyearsofschooling
0---4 109(33.2)
5---8 73(22.3)
9---11 98(29.9)
12+ 48(14.6)
Homelocation
Urban 292(89.0)
Rural 36(11.0)
Maternalemployment
Yes 212(65.0)
No 114(35.0)
Mother-childlengthoftime together(hours/day)
15(12;18)
Foodrestriction
%meanof‘‘never’’answers 56.3(31.3;75.0)
Socioeconomiclevel, maternalyearsofschooling,home loca-tionandmaternalemploymentshowninnumberofindividuals (%).Mother---childlengthoftimetogether(hours/day)andfood restrictionshownasmedian(quartile1;quartile3).
Table 4 shows the final multivariate ordinal logistic regression modelsbetweeneach dietarypattern (depend-entvariables)andsocioeconomic,behavioralandmaternal variables (predictorvariables) thatshowed significance in the bivariate models. A higher socioeconomic level and greaterfoodrestrictionsbyparents/guardianswere associ-atedwithhigheradherenceofthechildtothe‘‘Traditional’’ pattern.Motherswith9ormoreyearsofschoolinghad chil-drenwhoconsumedmore‘‘Sweeteneddrinksandsnacks,’’ and when maternal education reached 12 or more years of study, the chances of having a diet rich in those itemsincreasedby4times,whencomparedtothosewith lower educational level. Childrenfrom intermediate eco-nomic level families were more strongly associated with the‘‘Monotonous’’pattern,comparedtothoseofextreme socioeconomicclasses.The‘‘Egg-dairy’’patternwasmore consumedby childrenliving inrural areasandchildren of motherswithhigherlevelsofeducation.
Discussion
Table 4 Final models of multivariate ordinal logistic regressionbetween tertiles ofdietarypatternsand socio-economic,behavioralandmaternalvariables.
OR 95%CI p-value ‘‘Traditional’’pattern
Socioeconomicclass
D 1
C2 0.54 0.28---1.03 0.063 C1 0.94 0.49---1.79 0.850 B2 0.38 0.18---0.78 0.010a B1 0.25 0.12---0.56 0.001b A 0.24 0.08---0.68 0.008b Foodrestrictionc 1.01 1.00---1.02 0.020a
‘‘Sweetenedbeveragesandsnacks’’pattern Maternallevelofschooling(yearsofstudy)
0---4 1
5---8 1.73 0.99---3.04 0.053 9---11 2.90 1.74---4.84 0.000b 12+ 4.00 2.09---7.64 0.000b
‘‘Monotonous’’pattern Socioeconomicclass
D 1
C2 1.19 0.63---2.24 0.588 C1 1.96 1.04---3.72 0.039a B2 2.44 1.19---5.04 0.015a B1 1.60 0.77---3.13 0.205 A 1.15 0.42---3.20 0.780
‘‘Egg-dairy’’pattern
Maternallevelofschooling(yearsofstudy)
0---4 1
5---8 1.87 1.07---3.26 0.028a 9---11 1.43 0.86---2.38 0.165 12+ 2.60 1.37---4.90 0.003b
Residingintheurban zone
0.43 0.23---0.82 0.011a
OR,oddsratio;95%CI,confidenceinterval. a p<0.05.
b p<0.01.
c Percentageofhigh-calorieandlow-nutrientcontentfoods,
whicharerestrictedbytheparents/guardiansinthechild’sdiet.
educationshowedadietarypatternthatwasmoredistant from that considered appropriate, with lower adherence to the ‘‘Traditional’’ pattern and greater adherence to ‘‘Sweeteneddrinks andsnacks’’pattern.Higher maternal educationallevel,aswellaslivinginruralareas,resultedin agreaterchanceofadherencetothe‘‘Egg-dairy’pattern. Childrenfromintermediatesocioeconomicclasses showed greateradherencetothe‘‘Monotonous’’pattern,compared tothoseofextremesocioeconomicclasses.Foodrestriction practices by parents/guardians were directly associated withgreateradherencetothe‘‘Traditional’’pattern.
Some similarities can be observed between the stud-ies that determine and evaluate dietary patterns. Some dietarypatternsareusuallyextractedfromthedataset:one characterized by the consumption of traditional/national foods,representingthestaplefoodofthepopulation, sim-ilartothe ‘‘Traditional’’ patternof thisstudy; onebased on processed and highly processed foods, similar to the ‘‘Sweeteneddrinksandsnacks’’patternofthisstudy,and
apatternrepresentingtheconsumptionoffoodsassociated withahealthylifestyle,suchaswhitemeats,wholegrains, productswithlow-fatcontentandvegetables,similartothe ‘‘Healthy’’patternofthisstudy.8,20---22
InastudyofobeseBrazilianadolescents,threedietary patternsweredefined:(1)‘‘Traditional,’’inwhich predomi-natedtheconsumptionofrice,pasta,beans,oils,redmeats, sausagesand sweets;(2) ‘‘In Transition,’’represented by thehigh intakeof milk anddairy products, bread,butter andmargarine, white meats, eggs, vegetablesand fruits, juicesandsugar;and(3)‘‘FastFood,’’consistingmainlyof cafeteriaproducts.Together,thethreepatternsexplained 34.8%oftheoriginaldatavariance.22
Research carried out in Salvador, Bahia, in 2011, with 1260childrenaged4---11years,identifiedfourpatternsthat explained45.9%ofthedatavarianceextractedfromafood frequencyquestionnaire.Unlikethepresentstudy,pattern 1(similartothe‘‘Traditional’’)wasassociatedwithhigher socioeconomiclevel,andpattern3(similarto‘‘Sweetened drinksandsnacks’’)wasmoreassociatedwithlower socio-economicstatus.23
Similarlytothisresearch,astudyof 667children aged 1---6 years from Pelotas, Brazil, and a study with adoles-centsinCuiabá, alsoinBrazil,verifiedgreater adherence tothe‘‘Traditional’’patternamongchildrenwhose moth-ershadlowerincome.24,25The higherfoodconsumptionof
the‘‘Traditional’’patternandthelowerfoodconsumption ofthe‘‘Sweeteneddrinksandsnacks’’patternbychildren oflowersocioeconomicstatusinthisstudymaybe associ-atedwiththepurchasingvalueofthesefoods.Foods from the‘‘Sweeteneddrinksandsnacks’’patterncanbe consid-eredmoreexpensiveand‘‘superfluous’’whencomparedto the‘‘Traditional’’pattern.
Inapopulation-basedSpanishstudywith3534individuals aged2---24years,thefoodpatternentitled‘‘Snacky,’’ sim-ilartothe‘‘Sweeteneddrinksandsnacks’’patternofthis study,wascharacterizedbyincreasedconsumptionof bak-eryproducts, savory snacks, sweetsand softdrinks.8 The
‘‘Snacky’’patternwasmoreconsumedbychildrenof moth-erswithlowereducationallevel,8andthechildrenlivingin
ruralareasconsumedlessfruitwhencomparedtothosefrom urbanareas.8Inthisstudy,differencesinfoodconsumption
betweenruralandurban areas werefound onlyregarding the consumption of the ‘‘Egg-dairy’’ pattern, more con-sumedbychildren fromrural areas.This behavior canbe explainedbythegreateravailabilityofeggsinthe country-sideduetotheself-sustainingproductionorfamilyfarming, aswellasthefactthatthisfoodisameatsubstitutewith reducedpriceand the possible decreased accesstomore processedfoodsbyruralchildren.
Inaccordancewiththepresentstudy,Jonesetal.19also
observed low consumption of fruits and vegetables when evaluating7285children,withameanintakeof201g/day, higherthan thatfound in thisstudy (193.9g/day).In that study,19 girlsconsumedmorefruitsthanboys,andchildren
whosemothershadhighereducationallevelatemorefruits andvegetableswhencomparedtochildrenofmotherswith lowereducationallevel.Thelowconsumptionoffruitswas alsoobservedinapopulation-basedstudyofindividualsaged 2---24years.8
consumption of processed foods by the child.25 McIntosh
etal.26observedthatmotherswhoconsideredworking
out-side the home as a priority gave less importance to the preparationoffamilymeals.Inthepresentstudy,however, the timemothers spent with their children and maternal workoutsidethehomewerenotassociatedwithanydietary patterninthemultivariateregressionmodels.
Food restriction practices by parents/guardians were associated with greater adherence by the child to the ‘‘Traditional’’pattern. Ina multi-ethnic studyof children aged4---6years,it wasobserved thatmaternal restrictive practiceswere associated withlowerenergydensity self-selectedbythechildren.27Thispracticecanbeconsidered
positive,aslongasitsapplication hasnonegative conno-tationsregarding theconsumption ofcertainfoods bythe child,anddoesnotstimulatecompensatoryfoodintakeof highcaloriefoods.
It is noteworthy that the cross-sectional design was a limitation of the study, making it impossible to identify causalassociationsbetweendietarypatternsandthe ana-lyzeddeterminants.Themainfindingofthisstudywasthe independentassociationbetweendietarypatternsandthe socioeconomic,behavioralandmaternalvariables.
Thus, the five dietary patterns extracted from this studydemonstratedthedietary styleofthechildren. The children’s dietary patterns were associated with family socioeconomic status, maternal level of education, food restrictionpracticesby parents/guardiansandhome loca-tioninurbanorruralarea.Theanalysisofdietarypatterns allowsusingtheexistinginter-correlationamongthefoods tocharacterize thehabitual foodintake,and enablesthe performanceofassociativeandinferentialanalyses,which areoftennotidentifiedinthestudyofindividualnutrients orfoods.
Funding
Thisstudydidnotreceivefunding.
Conflicts
of
interest
Theauthorsdeclarenoconflictsofinterest.
Acknowledgments
We thank Professors Andréia Ribeiro Queiroz and Milene CristinePersonfortheirassistancewithdataanalysis.
References
1.PeschMH,HarrellKJ,KacirotiN,RosenblumKL,LumengJC. Maternalstylesoftalkingaboutchildfeedingacross sociode-mographicgroups.JAmDietAssoc.2011;111:1861---7. 2.Brasil --- Instituto Brasileiro de Geografia e Estatística
[homepage onthe Internet]. Pesquisade Orc¸amentos Famil-iares 2008---2009:despesas, rendimento econdic¸ões de vida [accessed 02.11.13]. Available from: http://www.ibge.gov. br/home/xml/pof20082009.shtm
3.HuFB.Dietarypatternanalysis:anewdirectioninnutritional epidemiology.CurrOpinLipidol.2002;13:3---9.
4.HuFB, Rimm E,Smith-WarnerSA, et al.Reproducibilityand validity of dietary patterns assessed with a food-frequency questionnaire.AmJClinNutr.1999;69:243---9.
5.SlatteryML.Definingdietaryconsumption:isthesumgreater thanitsparts.AmJClinNutr.2008;88:14---5.
6.Ambrosini GL, O’Sullivan TA, de Klerk NH, Mori TA, Beilin LJ, Oddy WH. Relative validity of adolescent dietary pat-terns:a comparisonofaFFQand 3dfoodrecord.Br JNutr. 2011;105:625---33.
7.Balaban G, Silva GA, MottaME. Prevalência de sobrepesoe obesidadeemescolaresdediferentesclassessocioeconômicas emRecife,Pernambuco.Pediatria(SãoPaulo).2001;23:285---9.
8.ArancetaJ,Pérez-RodrigoC,RibasL,Serra-MajemL. Sociode-mographic and lifestyle determinants of food patterns in Spanishchildrenand adolescents:theenKidstudy.EurJClin Nutr.2003;57Suppl.1:S40---4.
9.Caballero B, Introduction Symposium. Obesity in develop-ing countries: biological and ecological factors. J Nutr. 2001;131:866S---70S.
10.KinseyJD. Foodand families’ socioeconomic status. JNutr. 1994;124Suppl.9:S1878---85.
11.ABEP [homepage on the Internet]. Critério de classificac¸ão econômica --- Brasil [accessed 25.01.14]. Available from:
www.abep.org/new/codigosCondutas.aspx
12.FisbergRM,MarchioniDM,ColucciAC.Assessmentoffood con-sumption and nutrient intake in clinical practice. Arq Bras EndocrinolMetabol.2009;53:617---24.
13.SalesRL,SilvaMM,CostaNM.Avaliandooconsumoalimentar porfotos[CD-Rom].Vic¸osa:UFV;2004.
14.AlvesAL,OlintoMT,CostaJS,BairrosFS,BalbinottiMA.Padrões alimentaresdemulheresadultasresidentesemáreaurbanano SuldoBrasil.RevSaudePublica.2006;40:865---73.
15.Charreire H, Kesse-Guyot E, Bertrais S, et al. Associations betweendietary patterns,physicalactivity (leisure-timeand occupational) and television viewing in middle-aged French adults.BrJNutr.2011;105:902---10.
16.KhaniBR,YeW,TerryP,WolkA.Reproducibilityandvalidityof majordietarypatternsamongSwedishwomenassessedwitha food-frequencyquestionnaire.JNutr.2004;134:1541---5.
17.AbreuMN,SiqueiraAL,CaiaffaWT.Ordinallogisticregression inepidemiologicalstudies.RevSaudePublica.2009;43:183---94.
18.SichieriR,CastroJF,MouraAS.Factorsassociatedwithdietary patternsintheurbanBrazlianpopulation.CadSaudePublica. 2003;19:47---53.
19.JonesLR,SteerCD,RogersIS,EmmettPM.Influencesonchild fruit and vegetable intake: sociodemographic, parental and childfactorsinalongitudinalcohortstudy.PublicHealthNutr. 2010;13:1122---30.
20.BalderHF,VirtanenM,BrantsHA,etal.Commonand country-specificdietarypatternsinfourEuropeancohortstudies.JNutr. 2003;133:4246---51.
21.Gimeno SG, Mondini L, Moraes SA, Freitas IC. Dietary pat-terns and correlates in adults living in Ribeirão Preto, São PauloState,Brazil:theOBEDIARPProject.CadSaudePublica. 2011;27:533---45.
22.Dishchekenian VR, Escrivão MA, Palma D, Ancona-Lopez F, AraújoEA, TaddeiJA. Dietarypatternsof obeseadolescents anddifferentmetaboliceffects.RevNutr.2011;24:17---29.
23.D’Innocenzo S, Marchioni DM, Prado MS, et al. The socio-economicconditions and patternsof foodintake inchildren aged between 4 and 11 years: the SCAALA study --- Sal-vador/Bahia.RevBrasSaudeMaterInfant.2011;11:41---9.
25.RinaldiAE,Pereira AF,Macedo CS,MotaJF,Burini RC. Feed-ingpracticesandphysicalinactivitycontributionstochildhood overweight.RevPaulPediatr.2008;26:271---7.
26.McIntoshA,KubenaKS,TolleG,etal.Determinantsofchildren’s useofandtimespentinfast-foodandfull-servicerestaurants. JNutrEducBehav.2011;43:142---9.