The article describes the results of an integral assessment of the regional social, environmental and economic systems (SEES) and the quality of life (QOL) in the regions of Russia’s Northwestern Federal District (NWFD). This work aims to give an inte-grated assessment of SEES in the Arkhan-gelsk and Murmansk regions in comparison to the Moscow region. The authors examine the QOL in 10 NWFD regions, including the Baltic ones. The significance of the re-search work lies in an integrated and com-prehensive assessment of the regional SEES and QOL in 2006, 2009, 2012, and 2013 in view of the effect of priorities wi-thin and between groups of assessment pa-rameters. Another important result is the identification of ‘stability limits’, when gions retain their QOL whereas their re-gional environmental characteristics chan-ge. The proposed methodology is based on multi-criteria and integrated approaches, the composite indicator method, and the method of parameter analysis and synthesis in the conditions of information deficit (IASID).
The assessment of SEES and QOL was performed for five classes (from ‘1 — high’ to ‘5 — poor’) based on calculating statis-tics for 3—6 groups of assessment criteria at two levels of convolution. The analysis of the data obtained shows an upward trend in QOL in the regions. The authors suggest assessing stability of SEES on the basis of critical values of aggregate indices, at which a given SEES maintains its characte-ristics and regime properties within a cer-tain QOL class.
Key words: regional social, environ-mental and economic system, quality of li-fe, integrated assessment, aggregate index method, regions of Russian Federation
In the recent years, Earth and social sciences have been actively developing methods for analysing, evaluating, and forecasting changes in natural and
so-RUSSIAN NORTHWEST: AN INTEGRAL ASSESSMENT OF THE CONDITIONS OF REGIONAL SOCIAL, ENVIRONMENTAL
AND ECONOMIC SYSTEMS AND QUALITY OF LIFE
V. Dmitriev
*N. Kaledin
**
Saint Petersburg State University 7—9 Universitetskaya nab., Saint Petersburg, 199034, Russia.
Submitted on February 10, 2016.
doi: 10.5922/2079-8555-2016-2-7
cial systems and their emergent properties and transformations in natural conditions and under external impacts. Studies in this area suffer from the incompleteness and inaccuracy of current knowledge — a result of the com-plexity of the structure and functioning of natural and social systems and a combination of determinacy, stochasticity, holism, and elementarism in their development. Therefore, most evaluation studies are carried out using compo-nent-based evaluation, rating/index, or comprehensive approaches. The indi-cator approach, indexology, axiometry, and environmental qualimetry of system studies are developing as a basis for multi-criterion and integrated assessments.
The notion of ‘quality of life’ (QOL) has gained wide currency in the academic community. It describes manifold aspects of lives of different cial groups. Definitions given by different authors emphasise economic, so-cial, political, and cultural components of social systems and the condition of natural and human-transformed environment, which interacts with the hu-man community, being often identified with the ecological condition of a territory or its ecological situation. Quality of life pertains to both actual ob-jects and phenomena surrounding human beings and individuals’ and socie-ties’ ideas of anticipated and desired future (objective and subjective ap-proaches). Such ideas are rarely referred to as ‘models’. More often, they are designated by vaguer terms akin to ‘ideal image’. Such terms impart an in-congruous set of conditions, circumstances, and factors, which define a cer-tain current condition of the system, to a virtual system. This gives rise to an idealised idea of quality of life, where all living conditions — from nutrition and environmental conditions to political freedoms and opportunities to util-ize achievements of science and culture — can and should meet the desires and needs of modern human beings and their concept of a high living stan-dard. A refusal to use social/environmental/economic models to trace the influence of social, economic, and political factors on the functioning of the system leaves few possibilities for studying such systems, namely, a compo-nent-wise assessment of elements and their temporal changes or a multi-criterion evaluation based on economic, social, and environmental indices. However, this undermines basic principles of studying complex systems (for instance, the principle of emergence), according to which a composition analysis does not replace studying integrative properties immanent in the system as a whole (stability, independence, cohesions, integrity, well-being, transformation stage, etc.).
comparison of actual values calculated on the basis of statistical data with a certain standard identified for each index. However, it might happen that, according to one index (or criterion), a system would fall into one category and, according to another, into another. Setting a trajectory of changes in the index describing, for instance, a country’s ‘economic welfare’ makes it pos-sible to obtain a more or less balanced index growth rate [21].
The management process is based on monitoring several factor indica-tors and analysing these indicaindica-tors in view of their effect on the target indi-cator set using various approaches. Other important elements are a qualita-tive forecast of possible changes in the indicators, a priori parametric changes in the conditions of management object development, and an as-sessment of alternative decisions when choosing the most efficient variant. However, today, there is no unanimity in views on either the development of a theoretical and methodological framework for a unified system of assess-ing the condition of a social/environments/economic system and quality of life or methodological preferences in devising algorithms and assessment methodologies [5]. This situation is brought about by the uniqueness of Rus-sian reality — a wide range of natural conditions, social and economic po-tential of regions, and ethnic diversity. Therefore, a region’s system of indi-cators can correspond to that of another region but they will not be inter-changeable due to objective reasons [14]. All the above reduces the possibil-ity of unification and decreases the efficiency of authorities in planning sus-tainable regional development [2; 6; 9—11].
‘Quality of life’, a term widely used in human ecology and social ecol-ogy, describes the quality of satisfying the material and cultural needs of people — quality of nutrition, housing standards, quality of education, healthcare, services, environment, recreation, fashionability of clothes, the need for objective information, level of stress, etc. Moreover, quality of life can be interpreted as the correspondence of living environment to the social and psychological attitudes of an individual. Building on these definitions of quality of life, a major objective is to identify a combination of natural, so-cial, and economic conditions of human health, i.e. the correspondence of the living environment of healthy human beings to their needs [2, p. 92]. The WHO defines quality of life as an individual’s perception of their position in life in the context of the culture and value systems in which they live and in relation to their goals, expectations, standards and concerns’ [2].
The existing interpretations of ‘quality of life’ are numerous and rather ambiguous. Therefore, different researchers propose disparate approaches to measuring QOL [1].
improving social progress indicators. The OECD prepared a compendium of well-being indicators based on the findings presented in Stiglitz, Sen, and Fitoussi’s report. The governments of France, Japan, China, the US, Ger-many, and Norway have shown interest in developing a full and objective system of well-being and sustainable development indicators. Thus, one can conclude that international interest in evaluating sustainable development is rather high and that relevant methodologies are still emerging [13].
Differences in existing methodologies for measuring quality of life mani-fest themselves when solving such problems as selecting a nomenclature of QOL indicators, measuring indicators, and choosing measurement methods and procedures for formulating a general conclusion about the QOL of an individual, a group of individuals, a region, or a country. Most QOL meth-odologies and models are developed within either the subjective or objective dimension [2; 4; 9; 11; 23].
Sources and methods
Let us consider the general idea behind integrated indicators of regional SEES and QOL. In our studies, integrated indicators (II) are obtained using the composite indicator method, the randomised composite indicator method (RCIM), and the method of indicator analysis and synthesis in the conditions of information deficit (IASID) [22]. For the purpose of simplification, we will use the RCIM method, whose stages will be considered below.
Stage one consists in choosing a relevant system of criteria for evaluat-ing the condition of regional SEES and QOL. These criteria reflect the con-dition of social, economic, and political subsystems and the quality of envi-ronment (ecological state of a system). All criteria are divided into several thematic groups. Each parameter should be essential and all parameters taken together sufficient for describing SEES and QOL. However, an in-crease in the value of some parameters results in the growth of QOL (type I) and an increase in others in its decrease (type II). Moreover, there are char-acteristics, whose critical values divide the scale of parameter changes into two intervals with opposite properties defining its effect on the state of a sys-tem. At this stage, it is reasonable to set the minimum (min) and maximum (max) values of characteristics based on a preliminary analysis of their re-gional temporal changes. Further, a continuous scale of changes by quality classes is introduced for chosen criteria. In most cases, these criteria serve as key properties characterising the condition of SEES or they are results of convoluting information on the system condition, which is assigned a certain QOL class. These criteria can be presented by certain indices. A crucial ele-ment is a scale for evaluating changes in indices by classes of system condi-tions. It is possible to use classifications proposed by different authors. It is also important to specify the type of connection (type I — direct and type II — inverse) and the degree of connection nonlinearity.
em-ploy classifications and axiometric scales described in research literature. It is more apt to refer to classifications developed for all groups of criteria clas-sification as models.
The integrated approach considered in this article rectifies the deficien-cies of criterion evaluation through simultaneously considering multi-criterion and multi-level (hierarchical) features in the cases of indicator con-volution, diversity of connections, and modelling measurement priorities.
At this stage, it is always important to analyse measurement scales of pa-rameter changes by quality classes. It is preferable but not obligatory that all scales have both left and right boundaries within classes, be continuous, and take into account regional extremes of measures indicators.
At stage two, simple transformations (minimax functions taking into ac-count the non-linearity and ‘direct/inverse’ type of connection) are per-formed and one gets rid of dimensionality of initial characteristics so that the value of 0 would correspond to the best conditions for each criteria and the value of 1 to the worst (or vice versa).
The minimum (mini) and maximum (maxi) values of each scale of initial characteristics are used to this end. It is also possible to use regional mini-mums and maximini-mums. In the latter case, it is important to understand that a classification based on minimum and maximum values will also have re-gional characteristics.
It does not seem appropriate to demonstrate necessary mathematical transformations in this article. However, they are considered in detail in ear-lier publications [8; 9; 11; 15].
It is recommended to present the results of parameter standardising in a table. Further, it is reasonable to find the width of measurement scale inter-vals for each class. Deficiencies of measurement scales are identified at this stage. If one class comprises 50—70% of all scale values, this scale is not satisfactory. Uniform or rectilinear (direct and inverse) scales are of simi-larly little interest, since resulting composite indicator scales will also be uniform and rectilinear with class boundary values of 0.2, 0.4, 0.6, 0.8, and 1.0. A variety of such scales is the Harrington scale, which also has a priori known boundary values of characteristics between classes.
At stage three, the form of the integrated indicator Q (q,p) is chosen. The indicator depends on not only standardised values of qi indicators but also their significance defined by weighting coefficients pi whose sum should equal 1.0 (0 ≤pi ≤ 1).
de-creased by a certain factor, that the weight is identified based on expert evaluations, or that the weight of each parameter is identified through addi-tional calculations.
This study uses a multiple-parameter integrated evaluation performed us-ing the composite indicator method (CIM). When introducus-ing the so-called ‘weighting coefficients’ or ‘weights’ representing individual criteria’s sig-nificance for an integrated evaluation, a researcher is faced with a deficit of numerical information on these weighting coefficients. In social, economic, and environmental evaluations, the significance of individual criteria is often assessed using comparative judgements, for instance, ‘this criterion is more important for the general evaluation that the other criterion is’ or ‘these crite-ria are equally important for the integrated evaluation’, etc. Therefore, the significance of individual criteria is often measured using a non-numeric scale or all criteria are assumed to be equally significant. In other cases, a researcher would set intervals of possible variations of weighting coeffi-cients. Therefore, it is important to work with non-numeric inaccurate in-formation, which is often incomplete (nontrivial equations and inequations corresponding to interval and ordinal information are not assigned to all weighting coefficients). Non-numeric, inaccurate, and incomplete informa-tion induces a set of accessible combinainforma-tions of weighting coefficients, which complicates the application of the CIM [22]. According to N.V. Kho-vanov [22], overcoming this complication requires using the Bayesian model of uncertainty randomisation. The model suggests a transition from uncer-tain selection of weighting coefficients to random selection from a set of all possible combinations of weighting coefficients. Thus, a researcher obtains random weighting coefficients and randomised composite indicators [22]. This technique is termed the randomised composite indicators method (RCIM) and the methodology of indicator analysis and synthesis in conditions of a deficit of information on evaluation parameters is referred to as the IASID methodology [22].
At stage five, the value of Qi. is calculated for the left and right boundary of the initial classification model.
As a result, one obtains a scale of changes in the integrated (composite) indicator by class regardless of whether all evaluation parameters are con-sidered as equal or unequal. After completing this stage, it is also reasonable to analyse the obtained scale for uniformity and rectilinearity. If a single class comprises 40—50% of the interval, it is necessary to go back to the previous stages and rectify the identified deficiency.
At stage six, accumulated statistical data are used to calculate the inte-grated indicators of the first and later convolution stages following the rules of building the initial classification models. At the same time, the procedure of value standardisation is not performed at the second and following stages. However, the problem of choosing weights (evaluating priorities) is carried out at all stages.
cases of handling incomplete, inaccurate, and non-numeric information, multi-level convolutions of information on the conditions of measured sys-tems are introduced [22]. A comparison of system conditions on an inte-grated basis makes it possible to evaluate the spatial and temporal features of changes and the degree of their transformation. The value obtained through convoluting admissible (critical) values of initial parameters can be used as the ‘critical’ value of the integrated indicator.
Research results and discussion
1.An assessment of the condition of regional SEES and QOL in Russia’s Northwest. The integrated assessment was carried out based on 2006, 2009, and 2012 data for the Arkhangelsk and Murmansk regions in comparison to the Moscow region.
At the first stage, a system of criteria for regional statistics was selected to assess quality of life [3; 6; 7; 17]. All criteria were divided into three modules (six groups, seventeen criteria) — social, economic, and environ-mental. At the same time, QOL classes were identified. Five classes were used, with the first one representing the ‘highest’, the second ‘above aver-age’, the third ‘medium’, the fourth ‘below averaver-age’, and the fifth ‘the low-est’ quality [2; 8; 11; 15; 23].
Initial criteria were selected at this stage to measure quality of life. They comprised six groups of indicators:
1. level of income (per capita income, roubles; proportion of population with an income below a living wage,%);
2. culture and recreation (number of sport facilities, units; number of theatre-goers per 1,000 population, people);
3. personal security (number of registered murders and attempted mur-ders, cases);
4. population health (number of hospital beds, 1,000 units; incidence of infectious and parasitic diseases per 1,000 population, people; population per one doctor, people; life expectancy, years);
5. level of education (number of pre-school institutions, units; number of higher professional education institutions (public, units));
6. quality of the environment (stationary source atmospheric emissions, 1,000 tons; fresh water usage, million tons; recirculating water volume, mil-lion m3; wastewater discharge into surface water bodies, million m3; forest area burned by wildfire, ha).
2006, 2009, and 2012 data for Russian regions are available in [6; 7; 17—19].
For all criteria, measurement scales for the left and right boundary of each class were developed. At stage two, all initial data and measurement scales were standardised.
Linear convolution of standardised indicators in view of their weight was used to express the integrated QOL indicator in the basic variant.
weights are equal. In model 2, priority is given to income. In model 3, the priority is the environment. All three models were built for each region. QOL values were compared based on the results of composite indicator cal-culations (table 1). Evaluative scales of composite indicators for these mod-els are shown in table 2.
Table 1
Integrated indicators by groups at the first and second levels of convolution for the Arkhangelsk (Arkh),
Murmansk (Murm), and Moscow (Mos) regions
2006 2009 2012 Group
Arkh Murm Mos Arkh Murm Mos Arkh Murm Mos First level of indicator convolution (model 1)
1. Income V V IV III III III III III III
2. Health IV IV IV IV II IV III II IV
3. Environment IV III III III III III III III III
4. Culture and
rec-reation IV IV IV IV IV III IV IV III
5. Personal security I I V I I IV I I III 6. Level of
educa-tion IV IV II IV IV II IV IV II
Second level of convolution
Model-1 IV
(0.70) III (0.66) IV (0.69) III (0.64) III (0.60) III (0.60) III (0.59) III (0.53) III (0.52)
Model-2 IV
(0.78) IV (0.77) IV (0.74) IV (0.70) III (0.67) III (0.63) III (0.61) III (0.56) III (0.53)
Model-3 III
(0.59) IV (0.77) IV (0.65) III (0.55) III (0.67) III (0.56) III (0.49) III (0.56) III (0.51)
Comment. Model-1: equal priorities; Model-2 (income > culture and recreation = = health > level of education = personal security > environment); Model-3 (envi-ronment > health = level of education = personal security > culture and recreation > > income).
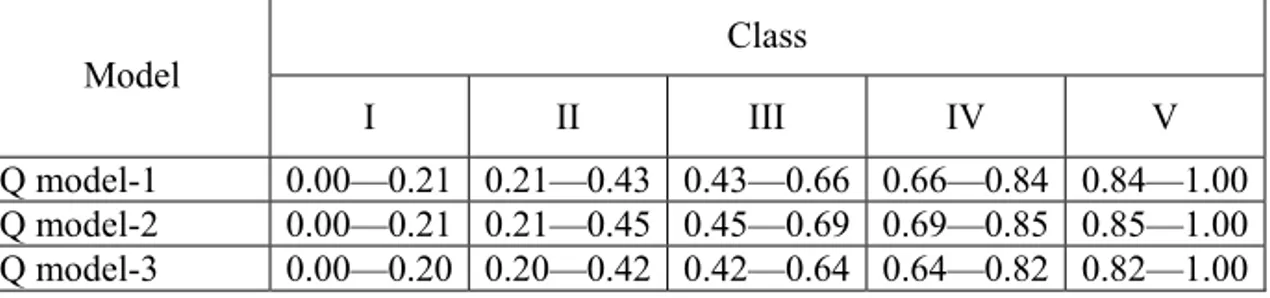
Table 2
SEES and QOL composite indicator scales (second level of convolution)
Class Model
I II III IV V
Q model-1 0.00—0.21 0.21—0.43 0.43—0.66 0.66—0.84 0.84—1.00 Q model-2 0.00—0.21 0.21—0.45 0.45—0.69 0.69—0.85 0.85—1.00 Q model-3 0.00—0.20 0.20—0.42 0.42—0.64 0.64—0.82 0.82—1.00
2012, QOL corresponded to class III and above in 13 out of 18 cases. In gen-eral, quality of life in the regions of Northwestern (two regions) and Central Russia (Moscow region) does not differ dramatically. The obtained QOL values suggested a shift from class IV to class III (the Arkhangelsk region closer to the right and the Murmansk and Moscow regions closer to the left boundary). There is a chance of the regions moving up to class II (above average).
2. An assessment of the condition of regional SEES and QOL in Russia’s Northwest.
Three modules — social, economic, and environmental — were used to obtain an integrated assessment. The official report ‘On the state and protec-tion of environment in the Russian Federaprotec-tion’ and the ‘Regions of Russia’ 2013 annual statistical compilation [19] were used as data sources.
The environmental module included the following nine criteria: waste-water discharge into surface waste-water bodies, million m3; waste generation, mil-lion tons; amount of deposited waste, milmil-lion tons; pesticide usage, kg/ha; forest wildfire, ha; atmospheric emissions, thousand tons; freshwater usage, million m3; stationary source atmospheric pollution, thousand ha; forested area, thousand ha.
The social module includes 10 criteria: marriage to divorce ratio, di-vorces per 1,000 marriages; sex ratio, women per 1,000 men; infant mortal-ity rate; mortalmortal-ity rate; disease incidence per 1,000 population; registered crime rate; Internet access; library access; life expectancy, number of sports facilities.
The economic block includes 10 criteria: population size, 1,000 people; monthly income, roubles; economically active population, 1,000 people; number of small enterprises per 10,000 population; vegetable crop yields, 100 kg/ha; livestock and poultry production (carcass weight), 1,000 tons; residential development, 1,000 m2; road density, km per 10,000 km2; cost of consumer basket, roubles; unemployment rate.
Evaluation scales of integrated indicators were devised for two levels of convolution (within and between groups) with equal and unequal priorities (weights). Four variants of coefficient correlation were considered for the second level of indicator convolution: equality of priorities: p1 = p2 = p3;
pri-ority given to the environment: p1 > p2 = p3; priority given to social
condi-tions: p2 > p1 = p3; priority given to economy: p3 > p2 = p1 (p1 stands for the
priority of the economic module, p2 for the priority of the social module, and
p3 for the priority of the environmental module). In the case of equal weights
of the first and second convolution level, QOL of ten regions falls into classes II — IV. Class II comprises two regions — Saint Petersburg and the Leningrad region. Class III includes the Kaliningrad, Vologda, Novgorod, Arkhangelsk, Murmansk, and Pskov regions and the Republic of Komi. Class IV consists of the Republic of Karelia.
‘Priority 2’ moves the Leningrad region from class II to III and the Mur-mansk region from class III to IV. ‘Priority 4’ moves the Kaliningrad region and the republic of Komi from class III to II.
indica-tors on the integrated indicator value. These calculations are performed for the first scenario (equal priorities). It is shown that an increase in the quality of the environment of below 30% does not result in a change in QOL class at the second level of convolution. It is proposed to establish the stability of regional SEES based on critical values of integrated indicators, which en-sures the preservation of the system’s properties and regime parameters within one QOL class.
This work was supported by Russian Foundation for Basic Research grant No. 16-05-00715.
References
1. Biktimirova, Z. Z. 2005, Kachestvo zhizni: problemy izmerenija i ocenki [Quality of life: problems of measurement and evaluation], Jekonomika regiona [The region's economy], no. 2, p. 147—162.
2. Boblakova, L. ., Dmitriev, V. V. 2014, Integral'naja ocenka kachestva zhizni naselenija g. Sankt-Peterburga i g. Mosvy [Integral assessment of the quality of life of the population of St. Petersburg and Moscow], Mezhdunarodnyj zhurnal jeksperimental'nogo obrazovanija [International Journal of Experimental Educa-tion], Vol. 3, Part. 1, p. 91—95.
3. Vinogradova, V. V. 2015, Prirodno-klimaticheskie i bioklimaticheskie us-lovija zhizni naselenija Murmanskoj oblasti [Natural and climatic and environmental conditions of life of the population of the Murmansk region], Izvestija RAN. Serija geograficheskaja [Izvestiya RAN. Geographical Series], no. 6, p. 90—99.
4. Vozmitel, . . 2013, Kachestvo zhizni v doperestroechnoj i poreformennoj Rossii [The quality of life in the pre-perestroika and post-reform Russia], Soci-ologicheskie issledovanija [Sociological studies], no. 2, p. 25—32.
5. Gershanok, G. . 2006, Social'no-jekonomicheskaja i jekologicheskaja em-kost' territorii pri ocenke ustojchivosti ee razvitija [Socio-economic and ecological capacity of the territory in the assessment of the sustainability of its development], Jekonomika regiona [The region's economy], no. 4, p. 166—180.
6. Gosudarstvennyj doklad Minprirody Rossii "O sostojanii i ob ohrane okruz-hajushhej sredy Rossijskoj Federacii v 2011 godu" [Report of the Ministry of Natu-ral Resources of the Russian Federation "On the State and the Russian Federation Environmental Protection in 2011"], 2011.
7. Gosudarstvennyj doklad Minprirody RF "O sostojanii i ob ohrane okruzha-jushhej sredy Rossijskoj Federacii v 2007 godu" [Report of the Ministry of Natural Resources of the Russian Federation "On the State and the Russian Federation Envi-ronmental Protection in 2007"], 2007.
8. Dmitriev, V. V. 2010, Integral'nye ocenki sostojanija slozhnyh sistem v pri-rode i obshhestve [Integral assessment of the state of complex systems in nature and society],Biosfera [Biosphere], T. 2, Vol. 4, p. 507—520.
10.Dmitriev, V. V. Ogurtsov, . N., Vasiliev, V. Yu., Primak, Е. ., Lobachy-ova, Yu. V., Skrygina, V. K. 2013, Ocenka jemerdzhentnyh svojstv slozhnyh sistem v prirode i obshhestve na osnove modelej integral'nogo ocenivanija [Evaluation of emergent properties of complex systems in nature and society on the basis of inte-grated assessment models]. In: Carlin, L. N., Vorobyov, V. N., Shelutko, V. ., Dmitriev, V. V. (eds.), Sbornik trudov VI mezhdunarodnoj konferencii «Jekologi-cheskie i gidrometeorologi«Jekologi-cheskie problemy bol'shih gorodov i promyshlennyh zon, JeKOGIDROMET — 2012» [Proceedings of the VII International Conference "Eco-logical and hydrometeoro"Eco-logical problems of big cities and industrial zones, EKOGIDROMET — 2012"], 2013, July 2—4, St. Petersburg, p. 18—27.
11.Dmitriev, V. V., Chistilina, V. S., Kravchenko, V. . 2015, Razrabotka i ap-robacija modelej integral'noj ocenki socio-jekologo-jekonomicheskih sistem i kachestva zhizni naselenija v regionah Rossii [Development and testing of models of integrated assessment of the socio-ecological-economic systems and the quality of life in the regions of Russia]. In: Istomin, Е. P. (ed.), Informacionnye tehnologii i sistemy: upravlenie, jekonomika, transport, pravo, sbornik trudov [Information tech-nology and systems: management, economics, law, Proceedings], International "In-fogeo 2015" scientific conference, no. 4(15), St. Petersburg, p. 86—94.
12.Doklad mezhuchrezhdencheskoj gruppy jekspertov po pokazateljam dostiz-henija celej v oblasti ustojchivogo razvitija. OON. Jekonomicheskij i social'nyj sovet. 47 sessija[Report of the inter-agency expert group on indicators of achieve-ments in the field of sustainable development. UN. The Economic and Social Coun-cil. 47 session], 2016, 8—11 March, E/CN.3/2016/2, 46 p.
13.Korchagina, Е. V. 2012, Analiz i ocenka ustojchivogo razvitija socio-jeko-logo-jekonomicheskih sistem [Analysis and evaluation of sustainable social, ecolo-gical and economic systems], PhD Thes., Gatchina, 377 p.
14.Lapin, N. I. 2012, Izmerenie modernizacii rossijskih regionov i sociokul'tur-nye faktory ee strategii [Measurement of the modernization of the Russian regions and socio-cultural factors of its strategy], Sociologicheskie issledovanija [Sociologi-cal studies], no. 9, p. 4—23.
15.Osipova, . ., Dmitriev, V. V. 2014, Integral'nye ocenki kachestva zhizni naselenija i kachestva gorodskoj sredy g. Sankt-Peterburga [Integral estimates of the quality of life of the population and the quality of the urban environment of St. Pe-tersburg], Mezhdunarodnyj zhurnal jeksperimental'nogo obrazovanija [International Journal of Experimental Education], no 3, Part. 1, p. 96—102.
16.Preobrazovanie nashego mira: Povestka dnja v oblasti ustojchivogo raz-vitija na period do 2030 goda. Rezoljucija, prinjataja General'noj Assambleej OON 25 sentjabrja 2015 goda [Transforming Our World: The Sustainability Agenda for the period up to 2030. Resolution adopted by the UN General Assembly on Septem-ber 25, 2015], 2015, A/RES/70/, 44 p.
17.Regiony Rossii. Social'no-jekonomicheskie pokazateli. 2007 [Regions of Rus-sia. Socio-economic indicators. 2007], 2007, p. 991 p.
18.Regiony Rossii. Social'no-jekonomicheskie pokazateli. 2010 [Regions of Rus-sia. Socio-economic indicators. 2010], 2010, 996 p.
19.Regiony Rossii. Social'no-jekonomicheskie pokazateli. 2013 [Regions of Rus-sia. Socio-economic indicators. 2013], 2013 990 p.
21.Tretyakova, V. Е. 2014, Ocenka ustojchivosti razvitija jekologo-jekonomi-cheskih sistem: dinamicheskij metod [Evaluation of sustainable development of eco-logical and economic systems: the dynamic method], Problemy prognozirovanija [Problems of forecasting], no. 4, p. 143—154.
22.Hovanov, N. V. 1996, Analiz i sintez pokazatelej pri informacionnom defici-te [Analysis and synthesis of indicators in an information deficit], St. Petersburg, 196 p.
23.Dmitriev, V. V. 2008, Integral Estimation of Ecological Condition and Quality of Anthropogenic Transforming System Environment, Building together our territories. Construire ensemble nos territories: Abstracts. Resume. 31st International Geographical Congress, Tunis 2008, August 12—15, p. 410—411.
About the authors
Prof. Vasily Dmitriev, the Department of Land Hydrology, the Institute of Earth Sciences, Saint Petersburg State University, Russia.
E-mail: vasiliy-dmitriev@rambler.ru
Dr Nikolai Kaledin, Head of the Department of Regional Politics and Political Geography, the Institute of Earth Sciences, Saint Petersburg State University, Russia.
E-mail: kaledin@politreg.pu.ru
To cite this article: