Adv. Sci. Res., 8, 143–147, 2012 www.adv-sci-res.net/8/143/2012/ doi:10.5194/asr-8-143-2012
©Author(s) 2012. CC Attribution 3.0 License.
Advances
in
Science & Research
Open Access Proceedings
EMS
Ann
ual
Meeting
and
10th
European
Conf
erence
on
Applications
of
Meteorology
(ECAM)
2011
The influence of the new ECMWF Ensemble Prediction
System resolution on wind power forecast accuracy and
uncertainty estimation
S. Alessandrini1, S. Sperati1, and P. Pinson2 1RSE, Ricerca Sistema Energetico, Milano, Italy
2Technical University of Denmark (DTU), DTU Informatics, Lyngby, Denmark
Correspondence to:S. Alessandrini ([email protected])
Received: 17 January 2012 – Revised: 14 May 2012 – Accepted: 21 June 2012 – Published: 27 July 2012
Abstract. The importance of wind power forecasting (WPF) is nowadays commonly recognized because it represents a useful tool to reduce problems of grid integration and to facilitate energy trading. If on one side the prediction accuracy is fundamental to these scopes, on the other it has become also clear that a reliable estimation about their uncertainty is paramount. In fact prediction accuracy is unfortunately not constant and can depend on the location of a particular wind farm, on the forecast time and on the atmospheric situation. Previous studies indicated that the spread of power forecasts derived from the Ensemble Prediction System (EPS) in use at the European Centre for Medium-Range Weather Forecast (ECMWF) could be used as indicator of a three-hourly, three days ahead, wind power forecast’s accuracy. In this paper a new application of the EPS, whose horizontal resolution was increased on January 2010 from T399/T255 (60 km) to T639/T319 (32 km), shows an improvement in the results implying that the power spread has actually enough correlation with the error calculated on the deterministic forecast in order to be used as an accuracy predictor. The periods for this comparison are from January 2008 until October 2008 (T399/T255) and from January 2011 until October 2011 (T639/T319). Moreover we have focused our attention on the influence of the new EPS configuration on the performance of a deterministic WPF conducted with the ensemble mean: the results show that increasing the EPS resolution yields a single-valued WPF whose performance is comparable with that of the new ECMWF deterministic high-resolution meteorological model, whose spatial resolution increased from T799 (25 km) to T1279 (15 km).
1 Introduction
Short-term forecasting of wind energy production is becom-ing increasbecom-ingly important due to the constant growth of this renewable source, whose uncertainty require a signifi-cant commitment to meet the needs of the transmission net-works operators and of other agents of the power systems and electricity markets. Wind is in fact a variable energy source, which does not allow a management similar to that of other traditional sources: in order to be able to better control its in-tegration into the electric grids and its dispatching priority, an adequate insight of its dynamics is necessary, in particular for the short-term time horizon (0–48 h) in which trading opera-tions are carried out in the electricity markets. The accuracy
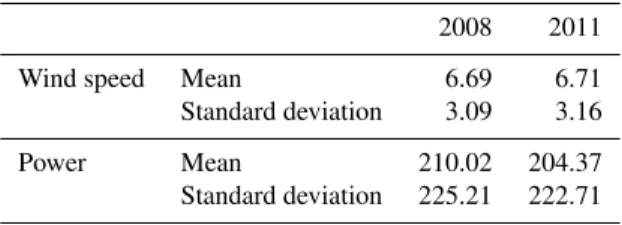
Table 1. Mean and standard deviation of measured wind speed (m s−1) and power (kW) for the two periods.
2008 2011
Wind speed Mean 6.69 6.71
Standard deviation 3.09 3.16
Power Mean 210.02 204.37
Standard deviation 225.21 222.71
2 Site and wind data description
The wind farm used in the application is located in a complex-terrain mountain area of Northern Sicily. It has 9 equal turbines, each one of 850 kW Nominal Power (NP). Time series power data for the single turbines are available for the years 2008 and 2011, in each case covering the period January–October. To consider valid power data we computed an average over the active turbines for each time step ob-taining a single power series. Wind data has been measured at 50 m a.g.l. (same height of the hubs) by an anemometer located inside the park. Measured data have been averaged from 10-minutes timesteps to hourly periods.
The total fraction of missing hourly data is similar and lower than 5 % for both periods of the comparison. Some concerns may rise regarding the fact that we compared two models with different resolution on two different years in-stead of the same period. However, the mean and standard deviation of measured wind speed and power reported in Ta-ble 1 are quite similar. This allowed us to consider the two periods suitable enough for the comparison, using the same forecast system and post-processing configuration for both cases.
3 The wind power forecast system
The wind power forecast system used consists in the applica-tion of the ECMWF meteorological model, which produces three-hourly wind forecasts at 10 m a.g.l., for the three days ahead period and for each year using respectively the two dif-ferent model resolutions. In order to reduce systematic errors and, at the same time, to convert wind to power, a single-layer, feedforward Neural Network (NN) has been applied (Cali et al., 2008). The NN has been configured linking di-rectly the forecasted meteorological data with the measured power on the training period, in order to obtain a three-hourly forecast power series. This WPF structure has been applied also in Alessandrini et al. (2010) showing similar or better performances to those of other WPF topology (i.e. Numeri-cal Weather Prediction+Model Output Statistic (MOS) cor-rection+power curve).
4 The deterministic application
In both cases the first 4 months have been used as training period for the NN described above, while the remaining 6 months have been considered as test period. However, the NN application is recursive (i.e. self-adapting algorithm that uses recent errors to correct its weights at regular intervals), therefore the training period is continuously increased in-cluding the part of the test period previous to the forecast window. The performances have been evaluated with some statistical indices reported in Table 2, in which RMSE, MAE and bias are normalized by NP. The indices are calculated averaging over all the three hours forecast horizon between time 0 h to+24 h (Day 1),+24 h to+48 h (Day 2) and+48 h to+72 h (Day 3) where 0 h refers to 00:00 UTC, the begin-ning of each 3 days forecast run updated every 24 h. On the first day prediction the new resolution shows a small im-provement in terms of RMSE apart from that the other in-dices look comparable, suggesting that the increase in reso-lution does not necessary assure better performances. Look-ing at the MAE indices, the results are in both cases in line with that of other state of the art models applied on complex terrain cases (Giebel et al., 2011).
5 The probabilistic application
The ECMWF EPS members are generated with perturbation of the initial conditions (ECMWF report, 2010) using singu-lar vectors with maximum total energy growth, obtaining 50 pair of wind components plus a non-perturbed member (the control run). The 50+1 wind forecasts have been first pro-cessed by a MOS (correction), training a NN on the ensem-ble mean and then applying it recursively on the test period. In this case the NN (with the same structure as indicated in Sect. 4) has been configured to link the wind forecasted data with measured wind speed instead of wind power, as done in the deterministic application, in order to obtain 50+1 cor-rected wind speed ensemble members, on which performing a statistical calibration procedure (Pinson, 2012).
The procedure employed is based on logit-transformation of the wind speed forecasted and measured data in order to reproduce a Gaussian distribution; the ratio between the RMSE, calculated on the training period between measured wind speed and the MOS-corrected ensemble mean, and the mean of the standard deviation of the ensemble members has been used as a variance deficit to adaptively correct the mean and the variance of the transformed wind speed forecasts on the test period. The time series have been finally transformed back with the inverse logit-transformation.
Table 2.Statistical indices for three-hourly power forecast evaluation computed using measured data for the two case periods. RMSE, MAE and bias are normalized by the nominal power (NP). The indices are calculated averaging over all the three hours forecast horizon between time 0 h to+24 h (Day 1),+24 h to+48 h (Day 2) and+48 h to+72 h (Day 3) where 0 h refers to 00:00 UTC, the beginning of each 3 days forecast run updated every 24 h.
Day 1 Day 2 Day 3
Deterministic T799 (25 km) RMSE/NP 14.5 % 15.2 % 16.0 % MAE/NP
Pearson Correlation bias/NP
10.3 % 0.77
−0.02
10.6 % 0.75
−0.01
11.7 % 0.71 0.0
Deterministic T1279 (15 km) RMSE/NP 13.8 % 15.5 % 16.0 % MAE/NP
Pearson Correlation bias/NP
10.1 % 0.78 0.01
11.2 % 0.71 0.01
12.1 % 0.69 0.02
EPS mean T399/T255 (60 km) RMSE/NP 15.3 % 15.8 % 16.7 % MAE/NP
Pearson Correlation bias/NP
11.1 % 0.74
−0.02
11.7 % 0.71
−0.01
12.6 % 0.67 0.0
EPS mean T639/T319 (32 km) RMSE/NP 14.3 % 15.6 % 15.9 % MAE/NP
Pearson Correlation bias/NP
10.2 % 0.76 0.0
11.2 % 0.70 0.0
11.7 % 0.69 0.0
Figure 1.Rank histograms, calibrated wind speed ensemble members; EPS T399/T255 and EPS T639/T319 resolution.
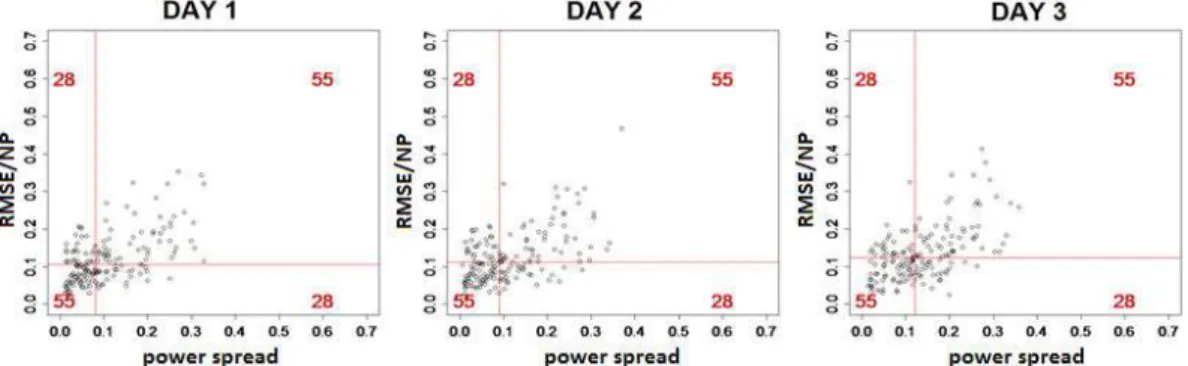
Table 3.Correlation between power spread averaged on daily basis and daily RMSE, and ratio between cases falling simultaneously above or below their respective median value and total number of cases (Day 1, 2 and 3 interval are explained in Table 2 caption).
spread/error correlation diagonal ratio
Day 1 Day 2 Day 3 Day 1 Day 2 Day 3
2008 0.57 0.55 0.57 0.66 0.66 0.66
2011 0.5 0.68 0.63 0.71 0.73 0.73
shown in Fig. 1. It is noticeable that for 2011 the MOS (system)+calibration scheme seems to work slightly bet-ter than for the 2008 case. There are probably two reasons for that. First the increase in spatial resolution slightly
Figure 2.ECMWF deterministic power forecast error (RMSE/NP) vs. ensemble power spread computed as a daily average for three lead times. EPS T399/T255 (60 km). The lines are plotted at the statistical median value of the data reported in x- and y-axis. The red numbers indicate the points inside each quadrant (Day 1, 2 and 3 interval are explained in Table 2 caption).
Figure 3.ECMWF deterministic power forecast error (RMSE/NP) vs. ensemble power spread computed as a daily average for three lead times. EPS T639/T319 (32 km). The lines are plotted on the statistical median. The red numbers indicate the points inside each quadrant (Day 1, 2 and 3 interval are explained in Table 2 caption).
indices (Pearson) and ratio between cases falling simultane-ously above or below their respective median value and total number of cases. Note that contingency tables only comprise one approach to assess the potentially existing spread-skill relationship for ensemble forecasts and that other approaches may be used in order to compare several ensemble forecast-ing systems for the wind power application. As an example, Pinson et al. (2009) compared ensemble forecasts of wind power based on lagged-averaged poor man’s ensembles, as well as NCEP and ECMWF ensemble predictions. The re-sults presented here are not directly comparable, even though our analysis and conclusions are qualitatively similar. More work is required in the future for the thorough comparison of rival approaches to ensemble forecasting of wind power gen-eration based on different meteorological ensemble forecasts used as input.
6 Deterministic approach using the ensemble mean
We conducted a WPF in a deterministic approach using the calibrated ensemble mean and comparing the obtain-able performances with those of the ECMWF deterministic model; Table 2 shows that for the low resolution case the
re-sults are slightly worse, showing an increase in RMSE/NP and MAE/NP between 0.5 and 1 %. For 2011, however, the increase in resolution allows to obtain comparable perfor-mances between the power forecast based on high resolu-tion deterministic meteorological model and on the ensemble mean.
7 Conclusions
In this work we showed that the increase in resolution of the ECMWF deterministic model does not necessary assure better performances of corresponding power forecasts in this test case. However, higher resolution of the EPS allowed us to obtain better performances in a WPF deterministic ap-proach (using the ensemble mean as a deterministic model) than with lower resolution. Furthermore, the new ensemble spread seems to be usable as an indicator of a WPF accuracy with slightly better results than with the lower resolution, at least for the time horizon until 72 h ahead.
Ministry of Economic Development – General Directorate for Nu-clear Energy, Renewable Energy and Energy Efficiency stipulated on 29 July 2009 in compliance with the Decree of 19 March 2009.
The authors also acknowledge Federico Fioretti and Umberto Deangelis of Enel Spa for providing meteorological and power data for the test case.
Edited by: L. Wald
Reviewed by: three anonymous referees
The publication of this article is sponsored by the European Meteorological Society.
References
Alessandrini, S., Decimi, G., and Ronzio, D.: Studio della re-lazione energia producibile/prodotta per un campo eolico su ter-reno complesso con modelli meteorologici dinamici, Rapporto di Ricerca RSE no. 10000262, 2010.
Alessandrini, S., Pinson, P., Hagedorn, R., Decimi, G., and Sperati, S.: An application of ensemble/multi model approach for wind power production forecasting, Adv. Sci. Res., 6, 35–37, doi:10.5194/asr-6-35-2011, 2011.
Cali, Ue., Lange, B., Dobschinski, J., Kurt, M., Moehrlen, C., and Ernst, B.: Artificial neural network based wind power forecast-ing usforecast-ing a multi-model approach, 7th International Workshop on Large Scale Integration of Wind Power and on Transmission Networks for Offshore Wind Farms, Madrid, 2008.
ECMWF internal report: Horizontal resolution increase (www. ecmwf.int), 2010.
Giebel, G., Brownsword, R., Kariniotakis, G., Denhard, M., and Draxl, C.: The State of the Art in Short-Term Prediction of Wind Power, Anemos.plus deliverable report, 2011.
Holmgren, E., Siebert, N., and Kariniotakis, G.: Wind Power Pre-diction Risk Indices Based on Numerical Weather PrePre-diction En-sembles, Proceedings of the EWEC 2010 Conference, Warsaw, Poland, 20–23 April, 2010.
Pinson, P.: Adaptive recalibration of ensemble forecasts of (u,v
)-winds, Q. J. Roy. Meteorol. Soc., doi:10.1002/qj.1873, in press, 2012.
Pinson, P., Nielsen, H. A., Madsen, H., and Kariniotakis, G.: Skill forecasting from different wind power ensemble pre-diction methods, J. Phys. Conf. Ser., 75, doi:10.1088/1742-6596/75/1/012046, 2007.
Pinson, P., Nielsen, H. A., Madsen, H., and Kariniotakis, G.: Skill forecasting from ensemble predictions of wind power, Appl. En-erg., 86, 1326–1334, 2009.