IMPACT OF DIFFERENT TOPOGRAPHIC CORRECTIONS ON PREDICTION
ACCURACY OF FOLIAGE PROJECTIVE COVER (FPC)
IN A TOPOGRAPHICALLY COMPLEX TERRAIN
S. Ediriweera a *, S. Pathirana a, T. Danaher b, D. Nichols a, T. Moffiet c
a
Southern Cross University, Lismore, Australia (s.ediriweera.10, sumith.pathirana, doland.nichols) @scu.edu.au b
New South Wales Department of Environment, Climate Change and Water, Alstonville, Australia [email protected]
c
The University of Newcastle, Australia - [email protected]
Commissions VII, WG VII/4
KEY WORDS: Vegetation, Correction, Monitoring, Landsat, Landcover
ABSTRACT:
Quantitative retrieval of land surface biological parameters (e.g. foliage projective cover [FPC] and Leaf Area Index) is crucial for forest management, ecosystem modelling, and global change monitoring applications. Currently, remote sensing is a widely adopted method for rapid estimation of surface biological parameters in a landscape scale. Topographic correction is a necessary pre-processing step in the remote sensing application for topographically complex terrain. Selection of a suitable topographic correction method on remotely sensed spectral information is still an unresolved problem. The purpose of this study is to assess the impact of topographic corrections on the prediction of FPC in hilly terrain using an established regression model. Five established topographic corrections [C, Minnaert, SCS, SCS+C and processing scheme for standardised surface reflectance (PSSSR)] were evaluated on Landsat TM5 acquired under low and high sun angles in closed canopied subtropical rainforest and eucalyptus dominated open canopied forest, north-eastern Australia. The effectiveness of methods at normalizing topographic influence, preserving biophysical spectral information, and internal data variability were assessed by statistical analysis and by comparing field collected FPC data. The results of statistical analyses show that SCS+C and PSSSR perform significantly better than other corrections, which were on less overcorrected areas of faintly illuminated slopes. However, the best relationship between FPC and Landsat spectral responses was obtained with the PSSSR by producing the least residual error. The SCS correction method was poor for correction of topographic effect in predicting FPC in topographically complex terrain.
1. INTRODUCTION
Operational mapping and monitoring of vegetation cover and vegetation cover changes is an important application of remote sensing. Large area monitoring of vegetation cover depends on the relationship between field measurements of vegetation cover and spectral reflectance measured by remote sensors. However, variation of reflectance by measured sensors, caused by factors other than variation in foliage cover, reduces the accuracy of the derived vegetation cover estimates if not accounted for. A change in atmospheric conditions and sun and sensor elevations will alter the amount of light scattered and absorbed by the atmosphere (Gill et al., 2010). However, remote sensing of rugged terrain, mainly characterized by high topographic relief, presents unique challenges in monitoring biophysical attributes not encountered on flat terrain. This change affects both the amount of light illuminating the surface and the amount of light entering the sensor. Thus, topographic correction is a necessary pre-processing step in the remote sensing application for topographically complex terrain. It is possible, however, for a spectral greenness algorithm to be developed which is independent of terrain induced brightness variation and therefore will not need topographic correction. The principal polar spectral greenness (PPSG) index (Moffiet et al., 2010) exhibits that property and, in a later, paper will be subject to evaluation against the best terrain correction methods which we find here. However, that is not the subject of this report. ______________________
There have been many attempts to correct topographic effects, with varying degrees of success. However, unlike atmospheric correction, topographic correction is quite challenging due to a lack of standard accepted models (Riano et al., 2003). Hence identifying a suitable topographic correction method is still an unresolved problem.Several studies (Riano et al., 2003; Richter et al., 2009) have assessed different topographic corrections on multispectral data for vegetation studies; however a few studies have comparatively assessed the impact of different topographic corrections on multispectral data in the tropical or subtropical forest conditions. Furthermore, a quantitative assessment in correction accuracy for different topographic corrections on biophysical properties of multispectral remotely sensed data in structurally complex forests is limited. Therefore, the objective of this study is to assess the impact of the five different topographic corrections on Landsat TM5 (here in TM5) data for predicting accuracy of vegetation cover (i.e. FPC) in a topographically complex landscape. FPC is defined as the vertically projected percentage cover of photosynthetic foliage of all strata (Specht et al., 1999) and it is a widely adopted metric of vegetation cover in vegetation classification frameworks in Australia (Sun et al., 1997).
Five non- Lambertian topographic correction models which have been widely used in vegetation studies were assessed. They include: C, Minnaert (Teillet et al., 1982), SCS+ C (Soenen et al., 2005) which are empirical models, and SCS (Gu
*Corresponding author
et al., 1998) and recently developed PSSSR (Gill et al., 2010) which are physical based corrections.
1.1 Topographic corrections
If θo, θn, ϕo, ϕn denote solar zenith angle, terrain slope angle, solar azimuth angle, topographic aspect angles respectively, the local incidence angle cosi can be computed from the terrain slope and aspect and solar geometry:
cos i- solar illumination angle between solar incident angle and the local surface normal [varies from -1 (minimum) to +1 (maximum)]
If L and Ln denote the reflectance of and horizontal and inclined terrain respectively then the cosine correction (Lambertian correction) for topographic correction is obtained as:
However, it is well known that this correction method
overcorrects the images, mainly in areas of low cosi (Duguay et al., 1992 ; Meyer et al., 1993; Teillet et al., 1982).Hence, the Lambertian method was not evaluated in this study.
The Minnaert correction (Smith et al., 1980; Teillet et al., 1982) an approach developed to minimise overcorrection of cosine correction and is widely applied for topographic correction in vegetation studies.
The Minnaert constant k models the extent to which a surface has non Lambertian reflectance properties. Since k is wavelength dependent, separate constants need to be computed for each band.
(Teillet et al., 1982) suggested the C correction is based on a semi empirical approach similar to Minnaert correction. This correction introduces C constant to counterbalance and prevent the overcorrection of images. C constant is wavelength dependent, and that is the quotient between the slope (bk) and intercept (ak) of the regression so C = a/b
The SCS correction was introduced (Gu et al., 1998) as a improved version of cosine correction for all wavelengths. This correction is more appropriate for topographic correction in forested areas since it preserves sun canopy sensor geometry (Gu et al., 1998). It also assumes that radiation from the sunlight canopy is largely dependent of topography due to geotropic nature of tree growth.
where α is the terrain slope.
(Soenen et al., 2005) introduced SCS+C, adding the C constant to the SCS correction to moderate the overcorrection in areas where low cosi. It is assumed the improvement of SCS correction occurs in a similar ways as the C correction improves on the cosine correction.
The PSSSR is an applications of bi-directional reflectance modelling to remove the effect of topography and bi-directional reflectance (Gill et al., 2010). The result is surface reflectance standardised to a fixed viewing and illumination geometry (an incidence angle of 45 degrees and exitance angle of 0 degrees). According to (Gill et al., 2010), summarised methodology for converting image digital values to standardised surface reflectance is as follows
Converting digital numbers of images into top of atmospheric radiance
The apparent surface radiance, and horizontal-surface direct and diffuse irradiances were computed using 6S
Converting horizontal-surface irradiance into sloped surface equivalents
The standardised surface reflectance was computed using the BRDF model parameters with equation (7).
(7)
Where standardised direct reflectance, is correction factor that transforms a measured direct reflectance to , is surface radiance, is measured direct irradiance, is the diffuse reflectance multiple for the measured reflectance and
is measured diffuse irradiance.
The quantities of , and computed from the atmospheric transfer modelling software, 6S (Vermote et al., 1997). The and correction factors were computed from bi-directional reflectance modelling as follows
(8) Where e, is exitance angle, is the relative azimuth angle.
Where the subscripts m and p refer to the measured and standardised angle respectively and is isotropic scattering,
is volume scattering were modelled using the kernel of (Ross, 1981) and is geometric scattering that modelled using the geometric shadow casting kernel of (Li et al., 1992).
A set of pairs of bi-directional observation to model BRDF of
the land’s surface for the PSSSR was obtained using
atmospherically corrected overlapping Landsat images. A detail description of this procedure is documented by (Gill et al., 2010). It was specifically chosen as this method has been used for vegetation mapping topographically undulated forested areas in Queensland and New South Wales.
2 MATERIALS AND METHOD
Two distinct forested areas were selected, the Richmond Range National Park (Latitude, 28.69ºS and Longitude, 152.72º E) and the Border Ranger National Park (Latitude, 28.36ºS and Longitude, 153.86º) to represent the broad range of vegetation characteristics found throughout north-eastern NSW, Australia. The sites vary from rolling hills to fairly rugged terrain with elevation ranges in the Richmond Range National Park (herein, RRNP) around 150 to 750m, and slope value reaching an average of 30o. Elevation ranges of the Border Ranger National Park (herein, BRNP) vary between 600m to 1200m with average slope values reaching up to 40o. Closed canopy tall subtropical rainforest species are comprised in the overstorey in
BRNP and vegetation in RRNP characterised as open canopy eucalyptus dominated overstorey with mesic understory. 2.1 Field data
The methodology developed by the Queensland Remote Sensing Centre (QRSC) for ground cover measurement (Armston et al., 2009) was used to estimate field foliage projective cover. FPC was estimated from three 50m point intercept transects laid in a North-South, Northeast-Southwest and Northwest-Southeast orientation using a compass and the area of each sampling site was approximately 0.5ha. Selected sampling sites had relatively homogenous canopy cover with mature stands in uniform slopes and aspects. Twenty five sampling sites representing each study area and all together fifty, sites were surveyed in both RRNP and BRNP. At 1 m intervals along each transect, overstorey (woody plants greater than or equal to 2 m height) and understorey (woody or herbaceous plants less than 2 m height) were recorded. The overstorey woody plant intercepts were recorded using the GRS Densitometer with intercepts classified as green leaf, dead leaf, branch or sky by the observer as described by (Johansson, 1985). The understorey herbaceous measurements were made with a laser pointer at a zenith of zero with intercepts classified as green leaf, dead leaf, bare, rock, cryptogam or litter by the observer. The centre of each plot was located at the intersection of the three transects and was determined accurately by using a GPS unit (GARMIN GPSMAP (R) 62stc). Five GPS points were recorded of the centre of each sampling plot over a 20 minute period and then averaged. The accuracy of the GPS under the trees varied with the density of overstorey canopy with standard deviation of the five measurements ranging from 5m to 8m in closed canopy BRNP and from 3m to 6m in open canopy RRNP.
2.2 Dataset
Two Cloud and haze free TM 5 (Level 1 G) images (path/row: 89/80) and Shuttle Radar Topography Mission (SRTM) digital elevation model (DEM) with 25m resolution were acquired from the United States Geological Survey (USGS). Acquired TM5 images comprised a summer (high sun elevation angle), and a winter (low sun elevation angle) images. See image information listed in table 1.
Table 1. Characteristics of TM5 data used for the study
2.3 Geometric and atmospheric correction
The imagery was acquired from the USGS as calibrated and rectified imagery. An empirical radiometric calibration was applied to top-of-atmosphere (TOA) reflectance to remove combined surface and atmospheric bi-directional reflection distribution function (BRDF) effects (Danaher, 2002).
2.4 Topographic corrections applied
All targeted corrections are based on DEM of the scene to compute incidence and exitance angles. DEM subsets were nearest neighbour resampled into 30mx30m pixel to match the base image and to be equivalent to the pixel size of TM5. Standardised surface reflectance was obtained by PSSSR
applying a sequence of steps described (Gill et al., 2010). All other mentioned topographic corrections were tested separately based on illumination map (equation 1) derived from DEM data. 2.5 Accuracy assessments
The evaluation of correction methods was based on the computation of statistical parameters and FPC using each topographically corrected image. Linear regression was used to assess the relationship between corrected and uncorrected reflectance and the cos i at each point. The statistical analysis was based on a set of 375 randomly selected pixels for each study area.
Signatures for TM5 bands 1 to 7 (except band 6) were extracted for the 2 x 2 pixel mean surrounding the field site location. The 2 x 2 block average provided the best match to the spatial extent of field measurements and also minimized the effects of geometric misregistration between the imagery of different dates. It was assumed that any increase in FPC between the date of site measurement and the image acquisition date was less than measurement error, as sites were generally located in mature vegetation. The Queensland Remote Sensing Centre (QRSC) of the Department of Natural Resources and Water (NRW) developed the regression model for predicting woody FPC (Armston et al., 2009) which was used to estimate FPC from topographically corrected images. Assessment was made on both study areas together and separately. The impact of topographic normalizations on FPC prediction accuracy was evaluated by comparing means of FPC predictions, standard deviations, means of residuals and bias and residual variation with field FPC estimates. Following topographic correction the predicted means of FPC for combined data and for each study area should be closer to the field FPC estimates. A reduction in the mean residuals, meaning a greater variation in measured radiance caused by different solar illumination has been reduced. Successful topographically induced illumination minimised images should be produced with lower bias and residual variation in FPC prediction.
3 RESULTS AND DISCUSSION
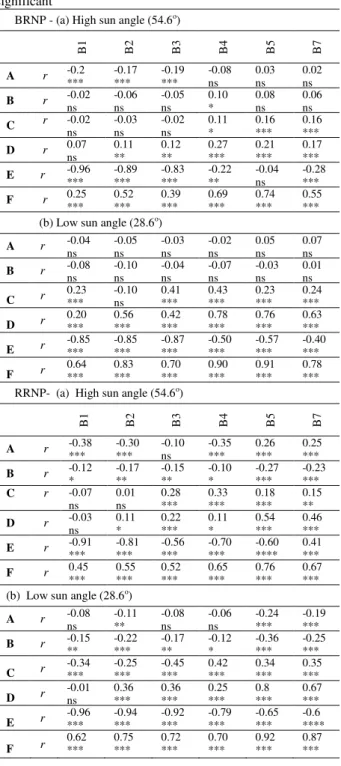
Table 2 depicts the correlation coefficient r of the uncorrected and corrected images of each correction method in the two structurally different forested areas, distinguishing different sun elevation angles. In an ideal correction, the variation in the uncorrected data caused by the influence of terrain would be reduced to zero since all reflectance values would be identical to those for horizontal or flat terrain for a given set of vegetation structural attributes in similar species composition.
Results showed that correlation coefficient (r) is negative for most of the TM5 bands (1-5 and 7) for both low and high sun angles, after the SCS correction has overcorrected the images. This overcorrection is critical in RRNP and faintly illuminated on slopes and images with low sun elevation angle conditions in both study areas. Like cosine correction, SCS correction also neglects the effect of diffuse irradiance thus overcorrection appeared in slopes facing away from the sun. These findings corroborate other studies (Soenen et al., 2005; Vincini et al., 2003). In all images the SCS+C and PSSR corrections led to very similar results in terms of very low residual topographic correlation (Table 2). However, the results clearly indicated that the PSSSR tended to create large negative overcorrection values under the both low and high sun elevation conditions in both study areas. This was specially marked for visible bands (TM 1-3) and it appeared that the PSSSR was not effective at equally normalizing reflectance for the same value of cosi from the band to band. C and Minnaert corrections produced Acquisition date Sun elevation Sun azimuth
2011-10-15 54.6o 61.2o
2011-07-11 28.6o 37.8o
intermediate results however; Minnaert tends to produced more under corrected product than others. This finding is in contrast to what authors (Colby, 1991; Ekstrand, 1996). This is suggested that proposed Minnaert constants for subtropical forest were found to be inadequate.
Table 2. Correlation coefficient (r) for regression between corrected (A-PSSSR, B- SCS+C, C- C, D-Minnaert, E-SCS) and F -uncorrected (TM5 bands and illumination cos i) for (a) high (b) low sun elevation angle images
Degree of significance: ***P<0.001, **P<0.01,*P<0.05, ns- not significant
Figure 4 and 5 illustrate relationships between field measured overstorey FPC estimates, and high and low sun angle TM5 data predicted overstorey FPC estimates, after the application of the topographic corrections. It is observed that the PSSSR applied to high sun angle data shows a strong relationship (r2-51) between filed measured FPC and TM5 predicted FPC in both study sites, where as SCS correction provides a weak relationship (r2-13).
According to Table 4, the PSSSR applied high sun angle image yielded the highest accuracy in terms of prediction of overstorey FPC by giving approximated means for actual FPC and lower residuals for both combined data and for each study areas separately. Furthermore it can be seen that application of PSSSR on the high sun angle data worked well in predicting FPC regardless of vegetation conditions (i.e. for BRNP true FPC 87 and predicted 81; RRNP true 71 and predicted 65). The simplest alternative way to account for the predicting accuracy is to scrutinise the residual means and overall bias and residual variation. This allows understanding of the degree of deviation on biological properties of spectral data from actual ground data after applying topographic corrections. Thus PSSSR showed the lowest residual mean and the least overall bias and residual variation by correcting topographically induced illumination and preserving data variability not related with topographic effect. Concerning the impact on FPC prediction accuracy, PSSSR seems to reduce internal variability of spectral characteristics induced by topography. Thus PSSSR corrected reflectance likely to be more related to the biological properties of the vegetation than the original reflectance. Alternatively, the SCS correction actually deteriorates biophysical properties in spectral data by overcorrection even more than before the correction.
SCS+C correction leads to fairly similar results to PSSSR in terms of predicting FPC by depicting a relationship (r2 47) between field measured FPC estimates under the high sun angle. However, it can be seen that the prediction accuracy of SCS+C is varied with the vegetation structure (see Table 3). It appears to be SCS+C is more effective in normalizing the topographic effect of closed canopy condition than the open vegetation. It is likely that such trend indicates the c constant as doesn’t well account for indirect illumination in open canopy conditions.
It is evident that C and Minnaert applied images produced moderate overall results for overstorey predicting FPC for high sun angle data. None of topographic correction shows a better improvement in correction accuracy of the image acquired in low solar angle condition (Figure 4 and Table 5). It was noted that the topographic corrected low sun angle image yields significantly lower FPC estimates than the field measured FPC.
Table.3.Statistics for field measured FPC estimates and topographically corrected TM5 predicted FPC estimates
High sun angle (54.6o)
Tr u e F P C
PSSSR SC
S
+
C
C Min
n ae rt S C S
Mean 80 73.5 71 65.8 68 63 SD 9.8 10 11.5 10.2 9.8 9.5 Mean (BRNP) 87 81 79 75.8 75.2 66 SD (BRNP) 6.2 7.5 6.6 7.6 4.8 9.3 Mean (RRNP) 71 65 60 59 59.4 58.4 SD (RRNP) 5.5 6.6 6.6 7.6 7 8.2 Residuals (Mean) -6.4 -9.3 -14 -12 -17 Residuals (SD) 8.5 8.4 10 7.8 11 Bias 10.5 12.5 17.2 14 20.5 Low sun angle (28.6o)
Mean 80 70 58 47 46 36 SD 9.8 10 15.5 10 15.7 17 Mean (BRNP) 87 72 65 65 46 40 SD (BRNP) 6.2 7.8 11 14.8 15.5 10 Mean (RRNP) 71 66.7 50 71 45 30 SD (RRNP) 5.5 11 15 13.8 16 20 Residuals (Mean) -10 22 -33 34 -44 Residuals (SD) 12.8 15 19.5 18 17.5 Bias 16.2 26.4 38 38.5 47.5 BRNP - (a) High sun angle (54.6o)
B1 B2 B3 B4 B5 B7
A r -0.2 *** -0.17 *** -0.19 *** -0.08 ns 0.03 ns 0.02 ns
B r -0.02 ns -0.06 ns -0.05 ns 0.10 * 0.08 ns 0.06 ns
C r -0.02
ns -0.03 ns -0.02 ns 0.11 * 0.16 *** 0.16 ***
D r 0.07 ns 0.11 ** 0.12 ** 0.27 *** 0.21 *** 0.17 ***
E r -0.96 *** -0.89 *** -0.83 *** -0.22 ** -0.04 ns -0.28 ***
F r 0.25 *** 0.52 *** 0.39 *** 0.69 *** 0.74 *** 0.55 *** (b) Low sun angle (28.6o)
A r -0.04 ns -0.05 ns -0.03 ns -0.02 ns 0.05 ns 0.07 ns
B r -0.08 ns -0.10 ns -0.04 ns -0.07 ns -0.03 ns 0.01 ns
C r 0.23 ***
-0.10 ns 0.41 *** 0.43 *** 0.23 *** 0.24 ***
D r 0.20 *** 0.56 *** 0.42 *** 0.78 *** 0.76 *** 0.63 ***
E r -0.85 *** -0.85 *** -0.87 *** -0.50 *** -0.57 *** -0.40 ***
F r 0.64 *** 0.83 *** 0.70 *** 0.90 *** 0.91 *** 0.78 *** RRNP- (a) High sun angle (54.6o)
B1 B2 B3 B4 B5 B7
A r -0.38 *** -0.30 *** -0.10 ns -0.35 *** 0.26 *** 0.25 ***
B r -0.12 * -0.17 ** -0.15 ** -0.10 * -0.27 *** -0.23 ***
C r -0.07 ns 0.01 ns 0.28 *** 0.33 *** 0.18 *** 0.15 **
D r -0.03 ns 0.11 * 0.22 *** 0.11 * 0.54 *** 0.46 ***
E r -0.91 *** -0.81 *** -0.56 *** -0.70 *** -0.60 **** 0.41 ***
F r 0.45 *** 0.55 *** 0.52 *** 0.65 *** 0.76 *** 0.67 *** (b) Low sun angle (28.6o)
A r -0.08 ns -0.11 ** -0.08 ns -0.06 ns -0.24 *** -0.19 ***
B r -0.15 ** -0.22 *** -0.17 ** -0.12 * -0.36 *** -0.25 ***
C r -0.34 *** -0.25 *** -0.45 *** 0.42 *** 0.34 *** 0.35 ***
D r -0.01 ns 0.36 *** 0.36 *** 0.25 *** 0.8 *** 0.67 ***
E r -0.96 *** -0.94 *** -0.92 *** -0.79 *** -0.65 *** -0.6 ****
F r
0.62 *** 0.75 *** 0.72 *** 0.70 *** 0.92 *** 0.87 ***
Figure 4. The relationship between field estimated overstorey FPC and high sun angle TM5 predicted overstorey FPC: A- PSSSR, B- SCS+C correction, C- C correction, D- Minnaert correction and E- SCS correction. Symbols denote study area in BRNP (triangles) and RRNP (circles)
Figure 5. The relationship between field estimated overstorey FPC and low sun angle TM5 predicted overstorey FPC: A- PSSSR, B- SCS+C correction, C- C correction, D- Minnaert correction and E- SCS correction. Symbols denote study area in BRNP (triangles) and RRNP (circles)
40 60 80 100
40 60 80 100
Fi
el
d
m
ea
su
re
d
FPC
(
%
)
A
r2-0.51
40 60 80 100
40 60 80 100
Fi
el
d
m
ea
su
re
d
FPC
(
%
)
B
r2-0.47
40 60 80 100
40 60 80 100
Fi
el
d
m
ea
su
re
d
FPC
(
%
)
C
r2-0.45
40 60 80 100
40 60 80 100
Fi
e
ld
m
e
a
su
r
e
d
e
FPC
(%
)
D
r2-0.44
40 60 80 100
40 60 80 100
Fi
el
d
m
ea
su
re
d
FPC
(%
)
Landsat predicted FPC (%) E
r2-0.13
40 60 80 100
40 60 80 100
F
ie
ld
m
e
a
sur
e
d
F
P
C
(%
)
A
r2-0.08
40 60 80 100
40 60 80 100
Fi
e
ld
m
e
a
su
r
e
d
FPC
(
%
)
B
r2- <0.08
40 60 80 100
40 60 80 100
Fi
e
ld
m
e
a
su
r
e
d
FPC
(
%
)
C
r2-<0.08
40 60 80 100
40 60 80 100
F
ie
ld
m
easu
re
de
F
P
C
(%
)
D
r2-<0.08
40 60 80 100
40 60 80 100
Fi
e
ld
m
e
a
su
r
e
d
FPC
(
%
)
Landsat predicted FPC (%) E
r2-<0.08
4. CONCLUSIONS
On the basis of the results of an application of topographically corrected Landsat TM5 data to accurately estimate FPC in structurally different vegetations, it appears that PSSSR effectively corrects topographically induced illumination and preserving biological properties of spectral data. The SCS correction produced the least accurate products and deterioration of actual spectral information by overcorrection even more than before the correction. All topographic correction tested appeared to be less effective in correcting topographic effect in TM data acquired in low sun angle conditions. It can be seen that topographic corrected reflectances of open canopy RRNP site are more problematic in terms of weak correlation with field measured FPC. Further work will be carried out to compare the effectiveness of the PPSG index against topographic correction methods for predicting foliage cover in complex terrain
References
Armston, J.D., Denham, R.J., Danaher, T.J., Scarth, P.F. and Moffiet, T.N., 2009. Prediction and validation of foliage projective cover from Landsat-5 TM and Landsat-7 ETM+ imagery. J.Appl. Remote Sens., 3(1): 1-28.
Colby, J.D., 1991. Topographic normalization in rugged terrain. Photogramm. Eng. Remote Sens, 57(5): 531-537. Danaher, T.J., 2002. An empirical BRDF correction for Landsat
TM and ETM+ imagery, In: 11th Australasian Remote Sensing and Photogrammetry Conference, Brisbane, Australia.
Duguay, C.R. and Ledrew, E.F., 1992 Estimating surface reflectance and albedo from Landsat-5 Thematic Mapper over rugged terrain. Photogramm.Eng. Remote Sens, 58(5): 551-558.
Ekstrand, S., 1996. Landsat TM-based forest damage assessment: correction for topographic effects. Photogramm. Eng. Remote Sens., 62: (2:): 151-161 Gill, T., Flood, N., Gillingham, S., Danaher, T., Shepherd, J.
and Dymond, J., 2010. An operational method for deriving standaedised surface reflectance from Landsat TM and ETM+ imagery for Queensland and New South Wales, In The 15th Australasian Remote Sensing and Photogrammetry Conference (ARSPC), Alice Springs, Australia.
Gu, D. and Gillespie, A., 1998. Topographic Normalization of Landsat TM Images of Forest Based on Subpixel Sun–Canopy–Sensor Geometry. Remote Sens. Environ.,64: 166-175.
Johansson, T., 1985. Estimating canopy density by the vertical tube method. Forest Ecol. Manag., 11(1-2): 139-144. Li, X. and Strahler, A.H., 1992. Geometric-optical bidirectional
reflectance modeling of the discrete crown vegetation canopy: effect of crown shape and mutual shadowing. IEEE Trans. Geosci. Remote Sens., 30(2): pp. 276 - 292
Meyer, P., Itten, K.I., Kellenberger, T., Sandmeier, S. and Sandmeier, R., 1993. Radiometric corrections of topographically induced effects on Landsat TM data in an Alpine environment. ISPRS J. Photogramm. Remote Sens., 48(4): 17-28.
Moffiet, T., Armston, J.D. and Mengersen, K., 2010. Motivation, development and validation of a new spectral greenness index: A spectral dimension related to foliage projective cover. ISPRS J. Photogramm. Remote Sens., 65: 26-41.
Riano, D., Chuvieco, E., Salas, J. and Aguado, I., 2003. Assessment of different topographic corrections in
Landsat-TM data for mapping vegetation types. IEEE Trans. Geosci. Remote Sens., 41(5): 1056-61. Richter, R., Kellenberger, T. and Kaufmann, H., 2009.
Comparision of topographic correction methods. Remote Sens., 1: 184-196.
Ross, J.K., 1981. The radiation regime and architecture of plant stands. Springer
Smith, J., Lin, T. and Ranson, K., 1980. The Lambertian assumption and Landsat data. Photogramm.Eng. Remote Sens, 46(9): 1183-1189.
Soenen, S.A., Peddle, D.R. and Coburn, C.A., 2005. SCS+C: A modified Sun-Canopy-Sensor topographic correction in forested terrain. IEEE Trans. Geosci. Remote Sens., 43(9): 2148-2159.
Specht, R.L. and Specht, A., 1999. Australian plant communities: dynamics of structure, growth and biodiversity. Oxford University Press
Sun, D., Hantiuk, R.J. and Neldner, V.J., 1997. Review of vegetation classification and mapping systems undertaken by major forested land management agencies in Australia. Aust. J. Bot., 45: pp. 929-948. Teillet, P.M., Guindon, B. and Goodenough, D.G., 1982. On the
slope-aspect correction of multispectral scanner data. Can. J. Remote Sens., 8: pp. 84-106.
Vermote, F.E., Tanre , D., Deuze, J.L., Herman, M. and Morcrette, J.J., 1997. Second Simulation of the Satellite Signal in the Solar Spectrum, 6S: Overview. IEEE Trans. Geosci. Remote Sens., 35(3): 675-686. Vincini, M. and Frazzi, E., 2003. Multitemporal evaluation of
topographic normalization methods on deciduous forest TM data. IEEE Trans. Geosci. Remote Sens., 41(11): 2586-2590.
ACKNOWLEDGEMENTS
This study was made possible by a scholarship from the Australian Government (International Postgraduate Research Scholarship-awarded in 2009) and Southern Cross University Postgraduate Research Scholarship (SCUPRS in 2009). We especially thank Jonathan Parkyn, Thomas Watts, Jim Yates, Susan Kerridge and Agata Kula for assisting in the field.