USING THE FOURNIER INDEXES IN ESTIMATING RAINFALL
EROSIVITY. CASE STUDY -
THE SECAŞUL MARE BASIN
M. COSTEA1
ABSTRACT. - Using the Fournier Index in Estimating Rainfall Erosivity.
Case Study - The Secaşul Mare Basin. Climatic aggressiveness is one of the
most important factors in relief dynamic. Of all climatic parameters, rainfall is directly involved in versant dynamic, in the loss of soil quality and through pluvial denudation and the processes associated with it, through the erosivity of torrential rain. We analyzed rainfall aggressiveness based on monthly and annual average values through the Fournier's index (1970) and Fournier's index modified by Arnoldus (1980). They have the advantage that they can be used not only for evaluating the land susceptibility to erosion and the calculation of erodibility of
land and soil losses, but also in assessing land susceptibility to sliding (Aghiruş,
2010). The literature illustrates the successful use of this index which provides a summary assessment of the probability of rainfall with significant erosive effects. The results obtained allow observation of differences in space and time of the distribution of this index.
Keywords: rainfall erosivity, Fournier indexes, pluvial denudation, Secaşul Mare.
1. INTRODUCTION
The processes developing at the earth surface are mainly influenced by rainfall. Either as rain or as water from melting snow, water is a very important morphogenetic agent, which gives versants a strong dynamic and creates specific microshapes. Climatic conditions determine the constant or spasmodic pace, the intensity and the permanent seasonal regime of the influence of external agents, i.e. water from precipitation. Climate aggressiveness is manifested on the one hand by thermal oscillations that prepare the crust through weathering processes, and on the other hand by the erosive action of rain. The regime of rainfall reflects the aggressiveness of pluvial denudation on the geological substrate and soil through the volume, duration and intensity of rain. The more aggressive they are, especially after long periods of drought. The erosive effect is felt immediately through accelerated modeling: the impact of rain drops due to their kinetic energy, the washout of the topsoil, gully erosion, ravination, etc. This is evident in the Secaşul Mare Basin, where the brittle substrate composed of sand deposits, gravel, clay and agricultural use (cereals, viticulture, fruit growing and grazing) allow for these processes to occur and reactivate older forms.
1
2. MATERIAL AND METHOD
The rainfall analysis was based on data from weather stations in Păltiniş (1450 m), Sibiu (420 m) and Sebeş (240 m) which are representative for the Secaş basin. Sibiu and Păltiniş stations are outside the basin, near its eastern and southern borders, respectively, under bio-climatic conditions which are similar to the basin area. The analyzed period covers a total of 30 years, between 1980 and 2010, with
particularizations to the Păltiniş station - 1980-2008. Modeling of significant conditions were analyzed: mean annual precipitation and precipitation surplus, torrential rains, the maximum amounts of rainfall in 24 hours.
Rainfall erosivity can estimated through several methods, of which one of the most relevant is based on torrential rainfall intensity. This requires however daily data, and in the case of long-lasting torrential precipitation, more complex information: quantities for various time intervals (15’, 30’), the core position and intensity. These detailed data are not easily available, they are extracted from pluviograms. Obtaining data which cover a longer period of time is practically impossible, on the one hand because of the restrictions imposed on data circulation, and on the other hand due to the high costs involved.
Under these circumstances, we assessed regional rainfall erosivity based on the Fournier (1960) index and the Fournier modified index (Arnoldus, 1980). The Fournier index was calculated according to the relation (1):
(1) F =
P
p
max2where Pmax is the monthly average amount of precipitation of
the most rainy month (mm), and P is the average annual quantity of precipitation. The Fournier index modified by Arnoldus (1980) was calculated by means of the relation (2):
(2) FM =
∑
= 121 2
i i
P
P
where Pi is the monthly average amount of precipitation
for month i (mm), and P is the average annual quantity of precipitation (mm).
Table 1. The erosivity classes by Fournier index (F) and modified Fournier index (FM)
Erosivity class F Clasa de erozivitate FM
Verry low 0 – 20 Verry low 0 - 60
Low 20 – 40 Low 60 – 90
Moderate 40 – 60 Moderate 90 - 120 Severe 60 – 80 High 120 - 160 Very severe 80 - 100 Very high > 160 Extremely severe > 100
3. CIRCUMSTANCES OF RAINFALL AGGRESSIVENESS
The current modeling of the relief and soil erosion is under the direct incidence of precipitation intensity and frequency.
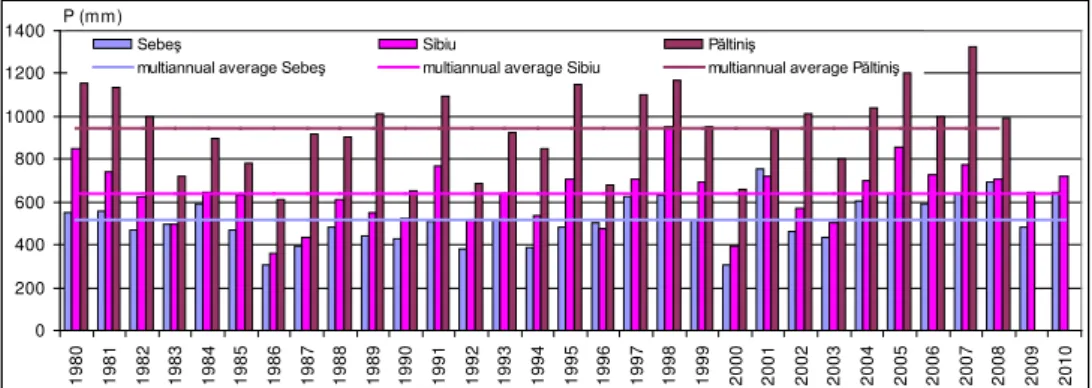
In order to determine the influence upon the versants, precipitation variation and variability should be determined. Multi-annual average quantities
increase with the altitude (516.6 mm/year in Sebeş, 638.2 mm/year in Sibiu, 943 mm/year in Păltiniş), the average increase gradient being 48.6 mm/100 m. The
rainfall vertical gradient is not constant, it is 67.6 mm in the depression and plateau sections of the basin and falls in the foothills and the lower mountain area in the southern part of the basin to around 30mm/100m). Monthly amounts of precipitation change significantly in relation to the general circulation of the atmosphere, the position of the basin and the intensity of local processes which cause precipitation. Multiannual monthly distribution shows a continuous increase in rainfall from January to June when it reaches the maximum value (72.5 mm in
Sebeş) and then falls until February to the minimum value (19.7 mm in Sebeş). In
the lower basin, the largest average amount of precipitation occurs in June and, over 400 m altitude, in July. We note that the warm season of the year is characterized by increasing precipitation, with the highest values recorded from May to July. Moreover, precipitations are greatly variable and their variability depends on atmospheric dynamic and they are influenced by the existing characteristics of the active surface (Bogdan, Niculescu, 1999; Dragotă, 2006).
In the years with intense cyclonic activity (oceanic and Mediterranean cyclones) there is a surplus of precipitation caused especially by heavy rains, in the warm season of the year. In the period under review, i.e.1980 - 1982, 1989, 1991, 1995, 1995 – 1998, 1999, 2001, 2004 – 2008 and in 2010, there was a remarkable rainfall surplus (fig.1). There were positive deviations between 100 and 200 mm in
Sebeş, in 1997, 1998, 2005, 2007, 2008 and 2010, and positive deviations above
200 mm (235 mm) in 2001. The quantity of precipitation increases from west to
east and with the altitude, and thus in Sibiu and Păltiniş positive deviations were
0 200 400 600 800 1000 1200 1400
1980 1981 1982 1983 1984 1985 1986 1987 1988 1989 1990 1991 1992 1993 1994 1995 1996 1997 1998 1999 2000 2001 2002 2003 2004 2005 2006 2007 2008 2009 2010
P (mm)
Sebeş Sibiu Păltiniş
multiannual average Sebeş multiannual average Sibiu multiannual average Păltiniş
Fig. 1. Precipitations variability during 1980 – 2010 and deviation from station amonth
Excess precipitation was recorded for short (1-2 years) or longer (4-7 years) periods of time alternating with periods of drought, which caused a much higher rainfall aggressiveness and a reactivation of slope and channel processes in the
Secaşul Mare basin.
Torrential rain has the strongest erosive effect on landscape and soil. The efficiency of pluvial erosion or aggressiveness is best measured when the intensity of torrential rain is considered for a period of 15 minutes. Rains whose torrential core has a minimum intensity of 0.6 mm/min for a period of 15 minutes are considered aggressive rain (Bojoi, 1992). Research conducted on experimental lots
in Romania (Moţoc, 1963) indicates the fact that the most aggressive are torrential rains with maximum intensity and those with the maximum intensity core located at the end of the rain. The research conducted by the Pedologic and Agrochemical Research Institute shows that pluvial aggressiveness in Romania has the following characteristics: it is lower in the west of the country (0.08), moderate in the south (0.13), east and north-east (0.10) and high in the center of the country, in the sub-Carpathian hills (0.14), in the Transylvania Plateau (0.12) and the sub-Carpathians area (0.15 – 0.16). According to these values, the Secaşul Mare Basin located in the south-western part of the Transylvanian Depression is characterized by a moderate to high pluvial aggressiveness, whose values increase from west to east and north to south. We believe, however, that the value of the rainfall erosivity indicator is not relevant due to the small differences between regional values, and to the significant differences in terms of rainfall (e.g. 0.12 for the Transylvania Depression and 0.13 for the Apuseni Mountains and the Bârlad Plateau). That is why we shall calculate the regional values of the Fournier indexes.
Most torrential rains occur in the summer, especially in June and July. Referring to the intensity of torrential rains in the Secaşelor Plateau, Raboca (1995)
argued that it is between 0.3 to 2.85 mm/min at the Sebeş station and that
the role of orographic barrier of the Carpathians, the opening to the west of the basin to moist air advection and the influence of the active surface.
Although data on torrential rains are most relevant in modeling through pluvial denudation, they are not easily accessible, and in some cases they are actually missing. This shortcoming can be eliminated by taking into account another weather-related parameter, namely the maximum absolute amount of rainfall in 24 hours. To the Secaşul Mare Basin, this parameter is particularly relevant in terms of the erosive effect because their value is about 70-90 % of average annual values of the month in which they occur. They have a torrential character, the amount exceeding 20 mm in all cases, and in 65 % of cases exceeding 30 mm. They have an extremely important erosive role on the versants through the impact of raindrops, but especially through the fact that they feed the
tributaries of the Secaşul Mare River and they cause flooding.
The yearly distribution of the maximum amount of rainfall in 24 hours is not uniform. The highest values occur in the warm season of the year, the absolute maximum being 61.3 mm in Sebeş, recorded on June 18, 1998. Daytime highs are generated as a result of the association of barometric systems with altitude. On the basin surface, there are changes of the dominant oceanic air masses and cyclonic Mediterranean areas which are in contact with the orographic barrier of the
Carpathians (Dragotă, 2006). In the cold season, due to poor thermal convection
and prevalence of anticyclone circulation, maximum amounts of precipitation fallen in 24 hours are lower and slightly erosive in comparison with the rainfall in summer. This is due to the resistance of the substrate and soil because of low temperature. There are exceptions in the cold season, when monthly averages are
exceeded (in Sebeş, the February daytime maximum was 30.7 mm on February 10,
1984, and the December daytime maximum of 40.0 mm occurred on December 30, 1989). These exceptions from the cold season are due to exceptional synoptic situations, i.e. advection of moisture laden air masses.
4. ESTIMATING EROSIVITY BY THE FOURNIER INDEXES
For the Secaşul Mare basin, the Fournier indexes were determined as
shown above, based on the monthly and yearly precipitation average data recorded at the stations which are representative for the basin; the data were provided by CMR Transilvania Sud. Differentiated altitudinal positions of the stations allow for correlation of these indices with altitude, and the position in space allows for analysis of spatial distribution of rainfall aggressiveness index. The analysis covers a period of 30 years, some with precipitation surplus and others deficient in precipitation, which will diversify over time the value of the two indices of rainfall aggressiveness depending precipitation variability (fig. 2, fig.3).
The multiannual average value of the Fournier index is 22.2 mm in Sebeş,
shows very low aggressiveness in the lower area of the basin and low to moderate aggressiveness in the higher area of the basin (fig. 2).
0 10 20 30 40 50 60 70 80 90
1980 1981 1982 1983 1984 1985 1986 1987 1988 1989 1990 1991 1992 1993 1994 1995 1996 1997 1998 1999 2000 2001 2002 2003 2004 2005 2006 2007 2008 2009 2010
F (mm)
Sebeş Sibiu Paltinis
erosivity class very low
low moderate severe very severe
Fig. 2. Fournier index variability during 1980 – 2010
0 20 40 60 80 100 120 140 160 180
1980 1981 1982 1983 1984 1985 1986 1987 1988 1989 1990 1991 1992 1993 1994 1995 1996 1997 1998 1999 2000 2001 2002 2003 2004 2005 2006 2007 2008 2009 2010
FM (mm)
Sebeş Sibiu Păltiniş
erosivity class very low low moderate
high very high
Fig. 3. Fournier modified index variability during 1980 - 2010
The F index showed a very low aggression at all stations (26 - 60 - 65% of cases), low aggression in 28-45% of cases, moderate aggression in 3-23% of cases and only at the station in Sibiu there was high aggression in 6% of cases. The average value of the F index was exceeded at all stations in 1991 (deviation 20-34 mm), in 2005-2007 (with deviations of 12-40 mm) and 2010 (with deviations of 12 to 28 mm). The values of the Fournier index grow from west to east and with the altitude, which is true also for deviations from the average values.
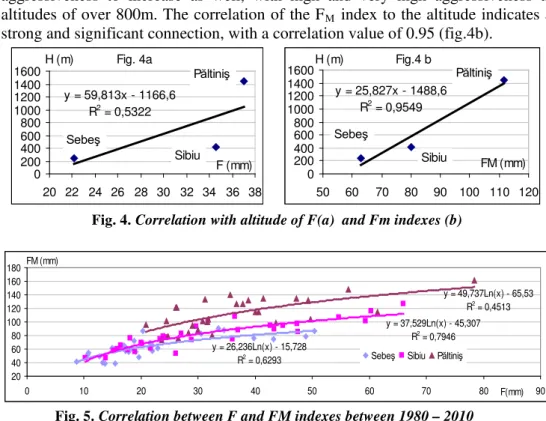
According to the aggressiveness classes of the modified Fournier index, for altitudes below 200m aggression is very low, for altitudes between 200 and 800 aggression is low and for altitudes over 800m aggression is moderate (fig.4 a , b). The values of the FM index for the lower area of the basin show a very low
aggression in 23 – 45 % of cases, low aggression in 44 – 52 % of cases and moderate aggression in 3% of cases. For the higher area of the basin, the FM index
shows a low aggressiveness in 21% of cases, moderate aggressiveness in 38% of cases, high aggressiveness in 38% of cases and very high aggressiveness in 3% of cases. In comparison to the average value of the FM index, there were positive
aggressiveness to increase as well, with high and very high aggressiveness at altitudes of over 800m. The correlation of the FM index to the altitude indicates a
strong and significant connection, with a correlation value of 0.95 (fig.4b).
Fig. 4a
y = 59,813x - 1166,6
R2 = 0,5322
0 200 400 600 800 1000 1200 1400 1600
20 22 24 26 28 30 32 34 36 38 F (mm) H (m) Sebeş Sibiu Păltiniş
Fig.4 b
y = 25,827x - 1488,6
R2 = 0,9549
0 200 400 600 800 1000 1200 1400 1600
50 60 70 80 90 100 110 120
FM (mm) H (m)
Păltiniş
Sibiu Sebeş
Fig. 4. Correlation with altitude of F(a) and Fm indexes (b)
y = 26,236Ln(x) - 15,728 R2 = 0,6293
y = 37,529Ln(x) - 45,307 R2
= 0,7946
y = 49,737Ln(x) - 65,53 R2 = 0,4513 20 40 60 80 100 120 140 160 180
0 10 20 30 40 50 60 70 80 F(mm) 90
FM (mm)
Sebeş Sibiu Păltiniş
Fig. 5. Correlation between F and FM indexes between 1980 – 2010
Figure 5 illustrates the positive and significant correlation between the two
indexes. The correlation value is higher at lower la altitudes (0.63 in Sebeş and 0.79 in Sibiu) and decreases towards higher altitudes (0.45 in Păltiniş). This
decrease may be due to the vertical pluviometric gradient which undergoes changes when altitude changes.
5. CONCLUSIONS
obtained indexes fall mostly under the moderate aggressiveness class, but there were also years when rainfall aggressiveness was high and very high, particularly at medium and high altitudes.
ACKNOWLEDGEMENTS
I would like to express my gratitude to reviewers for evaluation and to “Postdoctoral school for zootechnical biodiversity and food biotehnology based on the eco-economy and the bio-economy required by eco-san-genesys”, which cofinanced this work from the FSE through project number POSDRU/89/1.5/S/63258, 2007-2013.
REFERENCES
1. Aghiruş, Corina (2010), Culmea şi piemontul Codrului. Rezumatul tezei de
doctorat, Universitatea Babeş-Boliay, Cluj-Napoca.
2. Arnoldus, H.M.L. (1980), An approximation of rainfall factor in the Universal Soil Loss Equation. Assessment of erosion (M. De Boodt & D. Gabriels, eds.), Wiley, Chichester, U.K., 127 – 132.
3. Bojoi, I. (1992), Eroziunea solului. Edit. Universităţii „Al.I.Cuza” din Iaşi.
4. Dragotă, Carmen-Sofia (2006), Precipitaţiile excedentare în România. Edit.
Academiei, Bucureşti.
5. Fournier, F. (1960), Climat et erosion. P.U.F. Paris.
6. Gabriels, D. (1992), Rainfall erosivity for european mediterranean countries.
Seminar on Soil erosion under mediterranean conditions, Menéndez Pelayo International University, Valencia.
7. Moţoc, M. (1963), Eroziunea solului pe terenurile agricole şi combaterea ei. Edit.
Agrosilvică, Bucureşti.
8. Niculescu, Elena, Bogdan, Octavia (1999), Riscurile climatice din România.
Academia Română, Inst. De Geogr., Tipar Sega Internaţional, Bucureşti.
9. Oliver, J.E. (1980) - Distribuţia precipitaţiilor lunare: un index comparativ. Professional Geography, 32, 300-309.
10. Raboca, N. (1995), Podişul Secaşelor. Studiu de dinamica versanţilor. Edit. Sarmis, Cluj-Napoca.
11. Rice, R.M., Pillsbury, N.H. (1982), Predicting Landslides in clearcut patches.
Proceedings Exeter Symposium, Internatuinal Association of Hydological Sciences, 137, 303-311.
12. Rusan, N., Negoescu, Alina (2008), Cantităţi de precipitaţii excepţionale
înregistrate la staţia meteorologică Sibiu ( 1961 – 2007). Revista Geografică,
Institutul de Geografie, Bucureşti, XVI, 111 – 115.
13. Scrinzi, G., Gregori, E., Giannetti, F., Galvan, D., Zorn, G., Colle, G., Andreanelli, M.C. (2006), Un modello di valutazione della funzionalità protettiva del bosco per la pianificayione forestale: la componente stabilità dei versanti rispetto ai fenomeni franosi superficiali. Forest@ (Review of Italian Society of Silviculture and Forest Ecology), 3, 1, 98-155.
14. Sfîru, R., Cârdei, P., Herea, V., Ertekin, C. (2011), Calculation of rainfall erosion intensity (rainfall erosivity) in Valea Călugărească wine growing area.