ACPD
11, 27637–27659, 2011Radiative forcing via water vapor
M. A. Pfeffer et al.
Title Page
Abstract Introduction
Conclusions References
Tables Figures
◭ ◮
◭ ◮
Back Close
Full Screen / Esc
Printer-friendly Version Interactive Discussion
Discussion
P
a
per
|
Dis
cussion
P
a
per
|
Discussion
P
a
per
|
Discussio
n
P
a
per
Atmos. Chem. Phys. Discuss., 11, 27637–27659, 2011 www.atmos-chem-phys-discuss.net/11/27637/2011/ doi:10.5194/acpd-11-27637-2011
© Author(s) 2011. CC Attribution 3.0 License.
Atmospheric Chemistry and Physics Discussions
This discussion paper is/has been under review for the journal Atmospheric Chemistry and Physics (ACP). Please refer to the corresponding final paper in ACP if available.
Indirect radiative forcing of aerosols via
water vapor above non-precipitating
maritime cumulus clouds
M. A. Pfeffer1, J. E. Kristjansson1, F. Stordal1, T. Berntsen1, and J. Fast2
1
University of Oslo, Department of Geosciences, Oslo, Norway
2
Pacific Northwest National Laboratory, Richland, WA, USA
Received: 18 July 2011 – Accepted: 26 September 2011 – Published: 12 October 2011 Correspondence to: M. A. Pfeffer ([email protected])
ACPD
11, 27637–27659, 2011Radiative forcing via water vapor
M. A. Pfeffer et al.
Title Page
Abstract Introduction
Conclusions References
Tables Figures
◭ ◮
◭ ◮
Back Close
Full Screen / Esc
Printer-friendly Version Interactive Discussion
Discussion
P
a
per
|
Dis
cussion
P
a
per
|
Discussion
P
a
per
|
Discussio
n
P
a
per
|
Abstract
Aerosol-cloud-water vapor interactions in clean maritime air have been described for different aerosol sources using the WRF-Chem atmospheric model. The simulations were made over the Lesser Antilles in the region of the RICO measurement campaign where the clouds are low, patchy, typical trade-wind cumuli. In this very clean air,
5
sea salt and DMS are found to have greater effects than anthropogenic pollution on the cloud droplets’ effective radii and longwave and shortwave outgoing top of atmo-sphere radiation. The changes in radiation due to each aerosol source are a function of how each source influences aerosol concentration, cloud droplet number concentra-tion, cloud droplet sizes, and water vapor concentration. Changes in outgoing
short-10
wave radiation are due predominantly to changes in the clouds, followed by the direct aerosol effect which is about 2/3 as important, followed by the effects of water vapor which is in turn about 2/3 as important as the direct effect. Changes in outgoing long-wave radiation are due predominantly to changes in the clouds, with changes in water vapor being about 1/10 as important. The simulated changes in water vapor
concen-15
tration are due to the competing effects of aerosol particles being able to both enhance condensation of available water vapor and enhance evaporation of smaller droplets. These changes are independent of precipitation effects as there is essentially no driz-zle in the domain. It is expected that the indirect radiative forcing of aerosols via water vapor may be stronger in dirtier and more strongly convective conditions.
20
1 Introduction
Aerosol particles can change the earth’s radiation budget directly and indirectly. The direct effect is aerosol particles’ ability to scatter, absorb, and emit radiation. The in-direct effects of aerosols captured by global models are summarized in Lohmann and Feichter (2005). These indirect effects vary dependent on the state of water in a cloud,
25
ACPD
11, 27637–27659, 2011Radiative forcing via water vapor
M. A. Pfeffer et al.
Title Page
Abstract Introduction
Conclusions References
Tables Figures
◭ ◮
◭ ◮
Back Close
Full Screen / Esc
Printer-friendly Version Interactive Discussion
Discussion
P
a
per
|
Dis
cussion
P
a
per
|
Discussion
P
a
per
|
Discussio
n
P
a
per
effect” of aerosols is that they can serve as sites for liquid cloud condensation nuclei, producing more, smaller cloud droplets that can reflect more incoming radiation and decrease precipitation efficiency, increasing the lifetime of a cloud. Other effects of aerosol particles interacting with warm clouds are the “semi-direct effect”, whereby ab-sorbing aerosol particles may cause the evaporation of cloud droplets and the “surface
5
energy budget effect” whereby the increased optical thickness due to the aerosol par-ticles themselves and the increase in cloud due to its increased lifetime decrease the amount of incoming radiation that reaches the surface. An additional indirect aerosol effect on radiation is a change in the amount of water vapor in the atmosphere.
Water vapor is a very important greenhouse gas. Aerosol particles can change the
10
amount of water vapor in the atmosphere by changing cloud properties, for example producing smaller cloud droplets that are more likely to evaporate, and directly, for ex-ample by warming the atmosphere, allowing more evaporation from the earth’s surface. The Fourth Assessment Report of the IPCC says that potential human causes of water vapor increases that could have an effect on radiative forcing are “poorly understood”
15
with only the effects on water vapor by anthropogenic emissions of CH4, which can
increase the stratospheric water vapor when it oxidizes, is better understood with its “low” understanding (Forster et al., 2007).
Aerosol-cloud-water vapor interactions have been described for different types of clouds in precipitating and non-precipitating regimes. Teller and Levin (2006) found
20
that aerosol particles suppressed precipitation in mixed-phase cumulus clouds, en-hancing the ability of cloud droplets to evaporate after the ending of a precipitation event, allowing water vapor to be transported up to the mid-troposphere. Lohmann et al. (2007) found that aerosol particles can reduce shortwave heating at the sur-face, which can lead to more frequent deep convective events, which can enhance the
25
ACPD
11, 27637–27659, 2011Radiative forcing via water vapor
M. A. Pfeffer et al.
Title Page
Abstract Introduction
Conclusions References
Tables Figures
◭ ◮
◭ ◮
Back Close
Full Screen / Esc
Printer-friendly Version Interactive Discussion
Discussion
P
a
per
|
Dis
cussion
P
a
per
|
Discussion
P
a
per
|
Discussio
n
P
a
per
|
cloudier, moister lower troposphere with less precipitation. In the cases of these precip-itating clouds, changes from the aerosol particles which lead to more precipitation lead to less H2O(v). In the case of non-precipitating clouds, Xue and Feingold (2006) and
Small et al. (2009) have found that in cumulus clouds, aerosol particles can change the rates of condensation of atmospheric H2O(v)and the evaporation of cloud droplets. We
5
are interested in how aerosols’ ability to promote both condensation and cloud droplet evaporation allows them to change the concentration of H2O(v) in the air, and thereby
the top of atmosphere radiative forcing. It is clear that aerosol-cloud-water interac-tions are complex and can be different for different cloud types in different atmospheric regimes.
10
Shallow, maritime, cumulus convective clouds are one of the most common cloud types on the planet – on average they cover 12 % of the oceans (Xue and Feingold, 2006). Cumulus clouds can have different responses to aerosol particles than stratocu-mulus clouds. For example, custratocu-mulus clouds have a weaker feedback due to drizzle than do stratocumulus clouds. In our study, we have examined interactions between
15
aerosols, clouds, and water vapor in liquid shallow maritime cumulus clouds which are not precipitating. The complicated interactions between them are extremely difficult to discern by measurements and perhaps too subtle to be captured by global models. Previous research on these interactions has been performed with Large Eddy Simula-tion models, while we are utilizing the coarser, and more complicated, high-resoluSimula-tion
20
WRF-Chem model. Our case study, with verifiable atmospheric and cloud properties, is ideally suited to look for the radiative impacts of these interactions. This is the first study we know of that is attempting to quantify this effect. To summarize, we are look-ing for if in clean, non-precipitatlook-ing maritime air, can different aerosols, through their influences on cloud droplet properties, change the concentration of atmospheric water
25
ACPD
11, 27637–27659, 2011Radiative forcing via water vapor
M. A. Pfeffer et al.
Title Page
Abstract Introduction
Conclusions References
Tables Figures
◭ ◮
◭ ◮
Back Close
Full Screen / Esc
Printer-friendly Version Interactive Discussion
Discussion
P
a
per
|
Dis
cussion
P
a
per
|
Discussion
P
a
per
|
Discussio
n
P
a
per
2 Methods
The Rain In shallow Cumulus over the Ocean (RICO) campaign was a robust
re-search campaign from November 2004–January 2005 off of Antigua and Barbuda
(Rauber et al., 2007). The measurements from the campaign cover a wide range of scales and use many different kinds of instruments targeting shallow convective
5
clouds. We utilized measurements of droplet concentration, liquid water content, and effective diameter made by the Fast Forward Scattering Spectrometer Probe (Fast-FSSP) onboard the NSF/NCAR Hercules C130Q (C130) aircraft made on 11 Jan-uary 2005 to compare with our modeling results. This is the same measurement data used by Arabas et al. (2009) and Derksen and R ¨ockmann (2009) because there
10
was very little drizzle on this day. The measurement data was downloaded from http: //data.eol.ucar.edu/codiac/dss/id=87.009. The flight lasted from ∼14:00–22:30 UTC and cloud droplet data was collected from∼16:30–20:00 UTC (12:30–16:00 local time) (http://data.eol.ucar.edu/datafile/nph-get/87.009/RICO FFSSP data doc.pdf).
The version of the Weather Research and Forecasting model (WRF-Chem)
de-15
scribed in Gustafson et al. (2007) and Chapman et al. (2009) was used in this study. This model was chosen because it can simulate the direct, semi-direct, and indirect effects of aerosols in a realistic manner because aerosols, meteorology, radiation, and atmospheric chemistry are coupled in the model. Because WRF-Chem is non-hydrostatic, it can be run at high spatial resolution, approaching the resolution of
cloud-20
resolving models.
WRF-Chem was run with a modified two-moment Lin microphysics scheme with aerosol-cloud interactions. Aerosols affect cloud droplet number and cloud radiative properties while clouds alter aerosol size and composition. The CBM-Z gas-phase chemistry and MOSAIC 8 size bin aerosol schemes were used. Particle mass and
par-25
ticle number are simulated for each internally mixed aerosol bin. Among the aerosol species included are sulfate (SO24−), methanesulfonate (CH3SO−3), sodium (Na
+),
ACPD
11, 27637–27659, 2011Radiative forcing via water vapor
M. A. Pfeffer et al.
Title Page
Abstract Introduction
Conclusions References
Tables Figures
◭ ◮
◭ ◮
Back Close
Full Screen / Esc
Printer-friendly Version Interactive Discussion
Discussion
P
a
per
|
Dis
cussion
P
a
per
|
Discussion
P
a
per
|
Discussio
n
P
a
per
|
into the aerosol particle phase include H2SO4, HCl, and CH3SO3H.
In the simulations, aerosol particles have optical and direct radiative effects (Fast et al., 2006; Barnard et al., 2010). The aerosol composition and size determines the aerosol optical properties. Direct shortwave and longwave radiative aerosol effects were calculated using the Goddard and RRTM radiation schemes.
5
The indirect effects in the model include the ability of the aerosol particles to be ac-tivated (become cloud-borne): they can serve as sites of heterogeneous liquid cloud droplet nucleation (CCN). This activation is based on the calculated maximum super-saturation which is a function of a spectrum of the simulated updraft velocities and the internally mixed aerosol properties in each of the eight size bins. At 3 km horizontal
10
resolution, the model simulates updraft velocities that are much too weak compared with measurements, and as a result very few aerosol particles are activated. We re-placed the vertical velocity distribution function in the model with the one from Wang and Penner (2009) which improved the number of simulated cloud droplets. Interstitial and activated aerosol particles in each size bin are calculated every model time step.
15
When cloud droplets evaporate, the aerosols are resuspended. The first indirect effect is included by the simulated cloud droplet number concentration (CDNC) being fed to the radiation schemes which calculate the cloud’s reflectivity based on the CDNC. The second indirect effect is included by the simulated CDNC being fed to the microphysics scheme which calculates the cloud’s thickness based on the CDNC.
20
Cloud droplets autoconvert to rain droplets depending on droplet number. Cloud-borne aerosol particles and gases dissolved in cloud droplets can interact via aqueous-phase chemical reactions. These reactions can lead to the transfer of aerosol particles to a different size bin if their mass changes sufficiently. Aerosols and gases can be removed from the model domain by in- and below-cloud wet removal processes and
25
dry deposition. Ice clouds are not activated by the predicted aerosol particles, but rather by a prescribed ice nuclei distribution.
ACPD
11, 27637–27659, 2011Radiative forcing via water vapor
M. A. Pfeffer et al.
Title Page
Abstract Introduction
Conclusions References
Tables Figures
◭ ◮
◭ ◮
Back Close
Full Screen / Esc
Printer-friendly Version Interactive Discussion
Discussion
P
a
per
|
Dis
cussion
P
a
per
|
Discussion
P
a
per
|
Discussio
n
P
a
per
clouds. There were 175×130 grid boxes and 49 vertical levels, 42 of which were in the troposphere and 7 from the modeled cloud base – cloud top. ECMWF data was used as meteorological boundary and initial conditions.
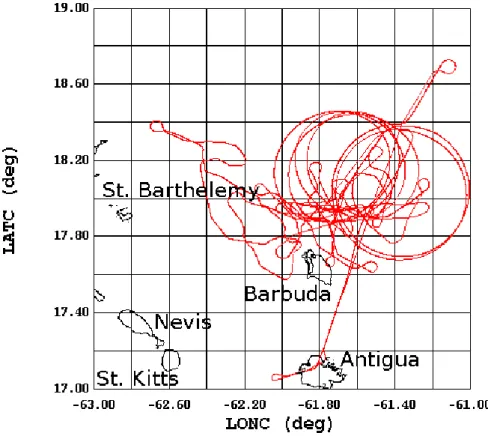
The latitude and longitude boundaries of the measurement flight track shown in Fig. 1: 63◦W–61◦W; 17◦N–19◦N is used to define a reduced domain where the
sim-5
ulation results are analyzed. The dominant wind direction in the region at this time is from the northeast. Because the model requires room in the domain to develop clouds, the reduced domain of interest was set in the southwest corner of the full simulation domain, which extended from 63.5◦W–58.5◦W; 16.5◦N–20◦N. Simulations were per-formed for 2 days, 10–11 January 2005, with the first 36 hours being spinup prior to
10
12:30 local time 11 January 2005 (when cloud droplet data started being collected). The anthropogenic emissions for the experiments have been constructed so
that the RETRO anthropogenic emissions are augmented by EDGAR SO2
emis-sions (precursor to SO24− aerosol). The RETRO emissions are monthly
grid-ded data at 0.5 × 0.5 ◦ resolution (downloaded from ftp://ftp.retro.enes.org/../pub/
15
emissions/aggregated/anthro/0.5x0.5/). The SO2emissions used are from the EDGAR
32FT2000 data which is an annual value for the year 2000 with 1×1 ◦ resolution
(downloaded from http://themasites.pbl.nl/en/themasites/edgar/emission data/edgar 32ft2000/Acidifying-gases/Sulphur-Dioxide.html). The emission of sea salt is calcu-lated online using the parametrization of Gong (2003) as described in Blechschmidt
20
et al. (2011). The emission of dust is calculated online using the parametrization of Shaw et al. (2008). The emission of DMS is calculated online using the parametriza-tion of Nightingale et al. (2000) which is based on ocean surface concentraparametriza-tions on a monthly 1×1 ◦ grid. Dust is emitted only over land, sea salt and DMS are emitted only over the ocean, and the anthropogenic emissions are emitted over both due to the
25
ACPD
11, 27637–27659, 2011Radiative forcing via water vapor
M. A. Pfeffer et al.
Title Page
Abstract Introduction
Conclusions References
Tables Figures
◭ ◮
◭ ◮
Back Close
Full Screen / Esc
Printer-friendly Version Interactive Discussion
Discussion
P
a
per
|
Dis
cussion
P
a
per
|
Discussion
P
a
per
|
Discussio
n
P
a
per
|
Three sensitivity simulations were performed including all emission sources except for the local source of interest. The “no anthropogenic” simulation excluded local an-thropogenic emissions, the “no sea salt” simulation excluded local sea salt, and the “no DMS” simulation excluded local emissions of DMS. A fourth sensitivity simulation simulated a polluted regime by multiplying the anthropogenic emissions by 1000. This
5
simulation is denoted as “1000 anthropogenic”. The emitted aerosol particles are able to change the top of atmosphere (TOA) radiation via three means- directly, indirectly by changing cloud droplet properties, and by changing the concentration of H2O(v) in the atmosphere.
3 Results and discussion
10
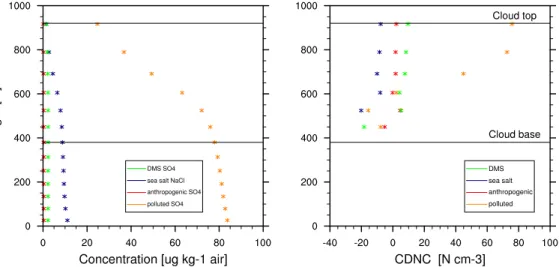
The simulated cloud base and top correspond well with the observations. The
simulated cloud base was at 380 m compared with the observed at 610 m. The
simulated cloud top was at 920 m compared with the observed at 1070 m (as de-scribed in the mission summary http://catalog.eol.ucar.edu/rico/catalog/report/ncar c-130/20050111/report.NCAR C-130.200501111400.mission summary.pdf). The
at-15
mospheric concentration (averaged horizontally over the domain of interest from 63◦W–61◦W; 17◦N–19◦N as described above and temporally over the time of the measurement flight) of sea salt aerosol is greater than the anthropogenic and DMS SO4 at the surface (Fig. 2, left). These concentrations were calculated by subtracting
the concentration of the species in the experiment excluding the local aerosol source
20
of interest from the Reference simulation. The simulated cloud top and base are in-dicated, and it can be seen that by the height of the cloud top, the concentrations of the different aerosols are approximately equal. For the polluted case, the results of the Reference simulation were subtracted from the “1000 anthropogenic” simulation, and the concentration of polluted SO4far exceeds the other emission sources.
25
ACPD
11, 27637–27659, 2011Radiative forcing via water vapor
M. A. Pfeffer et al.
Title Page
Abstract Introduction
Conclusions References
Tables Figures
◭ ◮
◭ ◮
Back Close
Full Screen / Esc
Printer-friendly Version Interactive Discussion
Discussion
P
a
per
|
Dis
cussion
P
a
per
|
Discussion
P
a
per
|
Discussio
n
P
a
per
the vertical model results from the cloud base to the cloud top (7 model levels), the hor-izontal domain of interest, and the time of the measurement flight. More than half of the measurements and model results have low concentrations of<30 cloud droplets cm−3 and low concentrations of<0.16 g m−3of liquid water.
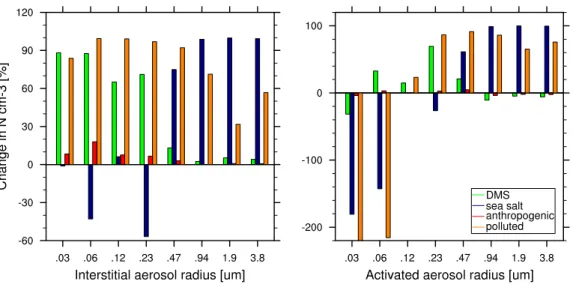
In order to elucidate the physical mechanisms by which the different aerosols change
5
the cloud droplet sizes and concentrations, we present Figs. 4 and5 which show how the aerosol radii and cloud droplet effective radii change due to each aerosol source. As above, the effect of each local aerosol source was calculated by subtracting the experiment excluding that source from the Reference simulation, except for the polluted case, where the Reference simulation was subtracted from the “1000 anthropogenic”
10
simulation.
In Fig. 4, when the values are above 0, an aerosol source has increased the number of aerosols of that size. Sea salt increases the number of large interstitial aerosol particles (0.47–3.8 µm radius) while the low to medium concentrations of SO4 from the anthropogenic and DMS sources increase the number of small interstitial aerosol
15
particles (0.03–0.23 µm radius). Sea salt increases the number of large cloud-borne aerosol particles in the same size range as for the interstitial, while the anthropogenic and DMS sources increase the number of medium-sized cloud-borne aerosol particles (0.06–0.47 µm radius). High concentrations of SO4, as in the polluted case, lead to
an increase of interstitial aerosol particles of all sizes, and an increase of activated
20
aerosols only of medium and large sizes. All aerosols lead to a reduction of the smallest aerosol particles being activated because the larger particles are more likely to be activated and the smallest less likely.
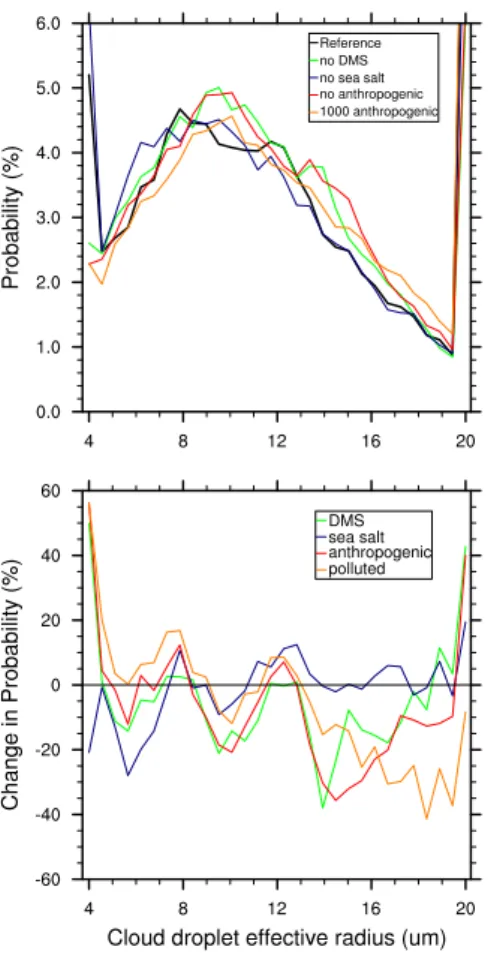
The top plot of Fig. 5 shows the changes in the PDF of cloud droplet effective radii for each sensitivity simulation and the bottom plot shows the difference in the effective
25
radius (ER) due to each aerosol source. The anthropogenic SO4aerosols have a very small influence on the cloud droplets whereby they generally lead to fewer medium size droplets. The DMS SO4 aerosols follow the same pattern as the anthropogenic
ACPD
11, 27637–27659, 2011Radiative forcing via water vapor
M. A. Pfeffer et al.
Title Page
Abstract Introduction
Conclusions References
Tables Figures
◭ ◮
◭ ◮
Back Close
Full Screen / Esc
Printer-friendly Version Interactive Discussion
Discussion
P
a
per
|
Dis
cussion
P
a
per
|
Discussion
P
a
per
|
Discussio
n
P
a
per
|
concentrations of SO4in the exaggerated polluted case also follow this trend, and due to the increased magnification of the effect, it is possible to see that SO4, in addition to
reducing the number of medium size droplets, is also increasing the number of small and large droplets. Sea salt NaCl aerosols lead to fewer small cloud droplets. The change in cloud droplet number concentration (CDNC) due to each aerosol source
5
in shown in the right panel of Fig. 2. Sea salt reduces the CDNC throughout the thickness of the cloud. SO4reduces the CDNC at the base of the cloud and increases it moving upward through the cloud. The effect is magnified as the concentration of SO4increases.
In order to understand how these changes in the cloud droplet sizes and
concen-10
trations influences the above-cloud water vapor and its resultant influence on outgoing radiation, the diagnostic Table 1 is presented. In this table, results from a sensitiv-ity simulation subtracted from the Reference simulation are denoted as ∆Ref, with significant differences marked with an asterisks. To see the effects of the additional pollution in the polluted case, the Reference simulation is subtracted from the 1000
15
anthropogenic simulation. The difference in the calculated outgoing radiation as com-pared with the all sky simulation (all possible influences on radiation are included) are denoted as∆All. This is calculated for (1) clear conditions: when the effect of clouds is excluded from the radiation calculation (denoted as Clear); (2) dry conditions: when the effect of H2O(v) is excluded (denoted as Dry); and (3) clean conditions: when the
20
direct effect of the aerosol particles is excluded (denoted as Clean). This is calculated for the five experiments, with the Reference experiment being denoted as Ref, the ex-periment excluding local sea salt being denoted as SS, the exex-periment excluding local DMS being denoted as DMS, the experiment excluding local anthropogenic emissions being denoted as Anth, and the experiment with 1000 times the anthropogenic
emis-25
sions denoted as Poll. Longwave results are denoted as LW and shortwave results as SW.
ACPD
11, 27637–27659, 2011Radiative forcing via water vapor
M. A. Pfeffer et al.
Title Page
Abstract Introduction
Conclusions References
Tables Figures
◭ ◮
◭ ◮
Back Close
Full Screen / Esc
Printer-friendly Version Interactive Discussion
Discussion
P
a
per
|
Dis
cussion
P
a
per
|
Discussion
P
a
per
|
Discussio
n
P
a
per
level above the clouds to the tropopause, (c) reduced relative to (b) with only columns where there is cloud included (39–46 % of the domain), and (d) reduced relative to (c) with only the model level directly above the clouds included. Where an experiment excluding an emission source has a higher concentration of H2O(v)than the Reference
experiment, that emission source produces a reduction in H2O(v). The∆Ref seen in the
5
third group of rows in that case will be negative. It is only at the most localized scale-column (d) where the only vertical level included is directly above the clouds and hori-zontally only those columns with clouds included- that the changes the aerosols make to the concentration of atmospheric H2O(v) is statistically significant. At this scale,
sea salt and low concentrations of SO4 from the anthropogenic emissions increase
10
the atmospheric H2O(v). Higher concentrations of SO4 from DMS and the additional anthropogenic emissions in the polluted case decrease the atmospheric H2O(v). The
changes in H2O(v) due to aerosols shown in this study are unrelated to aerosol-cloud
effects on precipitation, because there is essentially no drizzle in our model domain. Rather, as described by Xue and Feingold (2006) and Altaratz et al. (2008), aerosol
15
particles are able to enhance both condensation of atmospheric H2O(v) and
evapo-ration of cloud droplets. In our simulated region, higher concentevapo-rations of SO4 from DMS and the additional anthropogenic emissions in the polluted case enhance the condensation of atmospheric H2O(v). Sea salt and low concentrations of SO4from the
anthropogenic emissions enhance evaporation. Our SO4 results are consistent with
20
the results of Altaratz et al. (2008) for decaying, precipitating clouds. Their cloud sim-ulations showed that at the edges of old clean clouds, evaporation dominates while at the edges of more polluted clouds condensation dominates. Their simulations show the opposite behavior in younger clouds.
The next three columns of Table 1 show how the top of atmosphere (TOA)
outgo-25
pos-ACPD
11, 27637–27659, 2011Radiative forcing via water vapor
M. A. Pfeffer et al.
Title Page
Abstract Introduction
Conclusions References
Tables Figures
◭ ◮
◭ ◮
Back Close
Full Screen / Esc
Printer-friendly Version Interactive Discussion
Discussion
P
a
per
|
Dis
cussion
P
a
per
|
Discussion
P
a
per
|
Discussio
n
P
a
per
|
itive). The decrease in outgoing longwave radiation is due to cloud droplets absorbing and re-emitting radiation at a lower temperature. This effect is rather small because the clouds are very low, so the difference in temperature between the clouds and the surface is small. The increase in outgoing shortwave radiation is due to the cloud droplets scattering radiation. Aerosol particles increase the outgoing shortwave
radia-5
tion (∆All Clean Ref SW is positive) by scattering radiation. H2O(v)decreases the
out-going longwave and shortwave radiation (∆All Dry Ref LW and ∆All Dry Ref SW are negative) by absorbing radiation. This relationship between all, clear, clean, and dry sky conditions is consistent for all the sensitivity simulations.
In the longwave, the effect of H2O(v)is much greater than of clouds (|∆All Dry LW| ≫
10
|∆All Clear LW|), while the changes that the aerosols make to clouds have about 10 times the importance of the changes they make to the H2O(v) (|∆Ref Dry LW| ≫ |∆Ref Clear LW|). In the shortwave, the effect of clouds is greatest followed by H2O(v),
both of which have a much larger effect than the direct aerosol effect (|∆All Clear SW|> |∆All Dry SW| ≫ |∆All Clean SW|), except for the exaggerated 1000 anthropogenic
15
simulation, where the direct aerosol effect dominates and the effect due to clouds is minimized. The changes the aerosols make to the outgoing radiation, however, is driven mainly by changes they make to clouds, with changes they make to the di-rect aerosol effect being about 2/3 of that due to changes to the clouds, and in turn the importance of the H2O(v) is about 2/3 of that of the direct effect (|∆Ref Dry SW|>
20
|∆Ref Clean SW|>|∆Ref Clear SW|). This is again different for the exaggerated pol-luted simulation. This demonstrates the most important result of this study – that the effect of aerosols on water vapor on radiation is quantifiable and not insignificant. In these clean maritime conditions, this water vapor effect in the shortwave is about 2/3 the magnitude of the direct aerosol effect.
25
Sea salt makes the effects of clouds on radiation more
ACPD
11, 27637–27659, 2011Radiative forcing via water vapor
M. A. Pfeffer et al.
Title Page
Abstract Introduction
Conclusions References
Tables Figures
◭ ◮
◭ ◮
Back Close
Full Screen / Esc
Printer-friendly Version Interactive Discussion
Discussion
P
a
per
|
Dis
cussion
P
a
per
|
Discussion
P
a
per
|
Discussio
n
P
a
per
to deviate from the Reference simulation. Sea salt makes the effects of H2O(v)on radi-ation less important in the longwave (|∆All Dry SS LW|>|∆All Dry Ref LW|) while SO4 has the opposite effect. The model results show that both sea salt and SO4lead to a
lesser importance of H2O(v) in the shortwave (|∆All Dry SS SW|>|∆All Dry Ref SW|), but it is not clear to us what the mechanism for this is.
5
For all sky conditions, changing the aerosol sources has a much greater effect in the shortwave than in the longwave (|∆Ref All SW|>|∆Ref All LW|). ∆Ref Clear is positive for all aerosol sources in the shortwave, yet negative for the anthropogenic SO4in the longwave. This shows that excluding the effects of clouds, most aerosols increase the outgoing radiation except for very low concentrations of SO4. This is because it is only
10
the very low concentrations of SO4for which the evaporation effect dominates over the condensation effect, increasing the atmospheric concentration of H2O(v).
Broadly describing the differences of radiation calculated for each sensitivity simu-lation relative to the Reference simusimu-lation (∆Ref), it is the most highly concentrated
aerosols, sea salt and the SO4 from the exaggerated polluted case, which
gener-15
ally have statistically significant differences. It is only sea salt that decreases the outgoing longwave radiation in the all sky conditions (∆Ref All SS LW is negative). This is because sea salt particles absorb outgoing longwave radiation (Ayash et al., 2008). ∆Ref Dry SS LW is negative while for SO4 it is positive. Absent the effects of
H2O(v), the effects of sea salt on clouds leads to less outgoing longwave radiation. In
20
the shortwave, sea salt and high concentrations of SO4 increase the outgoing short-wave radiation in the all sky conditions (∆Ref All SS SW is positive) while the low and
medium concentrations of SO4 from local DMS and anthropogenic sources decrease
it. ∆Ref Clean shows what the aerosol sources do in the absence of direct aerosol effects (the effects of clouds and H2O(v)) and here only sea salt increases the outgoing
25
shortwave radiation because H2O(v)absorbs shortwave radiation and sea salt reduces
the atmospheric concentration of H2O(v). ∆Ref Dry shows what the aerosol sources do in the absence of H2O(v) (the effects of clouds and aerosols) and both sea salt and
ACPD
11, 27637–27659, 2011Radiative forcing via water vapor
M. A. Pfeffer et al.
Title Page
Abstract Introduction
Conclusions References
Tables Figures
◭ ◮
◭ ◮
Back Close
Full Screen / Esc
Printer-friendly Version Interactive Discussion
Discussion
P
a
per
|
Dis
cussion
P
a
per
|
Discussion
P
a
per
|
Discussio
n
P
a
per
|
∆Ref Dry calculations produce the same general pattern as the all sky conditions be-cause the effect of H2O(v)on the TOA radiation calculations is weaker than the effects from clouds and aerosols.
We have shown that the influences of the different aerosol sources on TOA radiation are a function of how each source changes aerosol concentration, cloud droplet
num-5
ber concentration, cloud droplet sizes, and H2O(v)concentration. The indirect radiative forcing of aerosols by H2O(v) is quantifiable and statistically significant when the
con-centration of aerosols is sufficiently high. To our knowledge, this is the first study to quantify the radiative effects of H2O(v)above warm, non-precipitating cumulus clouds. The results of this study apply only to this specific regime. Aerosol-cloud-water vapor
10
interactions are different in precipitating warm clouds, and may be completely different in mixed-phase or ice clouds due to different aerosol-cloud interactions. For exam-ple, sulfate aerosol particles may change the efficiency of ice nucleation in these cold clouds as proposed by Abbatt et al. (2006). Future work will address the aerosol-cloud-water vapor interactions in and above mixed-phase Arctic clouds. This study focuses
15
on shallow warm clouds, where there is a lot of water vapor in the air, so adding a small amount of H2O(v) has only a small impact on its atmospheric concentration. In
the cold, dry upper atmosphere, however, a small increase in H2O(v) can produce a much greater radiative effect.
4 Conclusions
20
We have shown that different aerosols change the concentration of atmospheric water vapor as a result of how they change warm cumulus clouds independent of changes in precipitation. These changes in H2O(v) are due to enhanced condensation or
evap-oration and lead to quantifiable changes in the longwave and shortwave TOA outgoing radiation. In the shortwave the change on TOA radiation due to the change in water
va-25
ACPD
11, 27637–27659, 2011Radiative forcing via water vapor
M. A. Pfeffer et al.
Title Page
Abstract Introduction
Conclusions References
Tables Figures
◭ ◮
◭ ◮
Back Close
Full Screen / Esc
Printer-friendly Version Interactive Discussion
Discussion
P
a
per
|
Dis
cussion
P
a
per
|
Discussion
P
a
per
|
Discussio
n
P
a
per
due to water vapor is about 1/10 the change due to clouds. Low concentrations of SO4 lead to enhanced evaporation of cloud droplets, leading to an increase of atmospheric H2O(v) and a reduction of the number of medium size cloud droplets. At higher
con-centrations of SO4, the condensation effect surpasses the evaporation effect leading to a reduction of atmospheric H2O(v). Sea salt aerosol leads to enhanced evaporation,
5
thereby reducing the number of small cloud droplets in warm, clean maritime air.
Acknowledgements. This work has been funded by the Norwegian Research Council through the AERO-CLO-WV project number 184714. NOTUR provided the computing resources to perform the experiments. A.-M. Blechschmidt provided the updated sea salt parametrization code and B. Gustafson assisted with the offline radiation calculations.
10
References
Abbatt, J., Benz, S., Cziczo, D., Kanji, Z., Lohmann, U., and M ¨ohler, O.: Solid ammonium sulfate aerosols as ice nuclei: a pathway for cirrus cloud formation, Science, 313, 1770– 1773, doi:10.1126/science.1129726, 2006. 27650
Altaratz, O., Koren, I., Reisin, T., Kostinski, A., Feingold, G., Levin, Z., and Yin, Y.: Aerosols’
15
influence on the interplay between condensation, evaporation and rain in warm cumulus cloud, Atmos. Chem. Phys., 8, 15–24, doi:10.5194/acp-8-15-2008, 2008. 27647
Arabas, S., Pawlowska, H., and Grabowski, W.: Effective radius and droplet spectral width from in-situ aircraft observations in trade-wind cumuli during RICO, Geophys. Res. Lett., 36, L11803, doi:10.1029/2009GL038257, 2009. 27641
20
Ayash, T., Sunling, G., and Charles, Q.: Direct and Indirect Shortwave Radiative Effects of Sea Salt Aerosols, J. Climate, 21, 3207–3220, doi:10.1175/2007JCLI2063.1, 2008. 27649 Barnard, J. C., Fast, J. D., Paredes-Miranda, G., Arnott, W. P., and Laskin, A.: Technical Note:
Evaluation of the WRF-Chem “Aerosol Chemical to Aerosol Optical Properties” Module using data from the MILAGRO campaign, Atmos. Chem. Phys., 10, 7325–7340,
doi:10.5194/acp-25
10-7325-2010, 2010. 27642
ACPD
11, 27637–27659, 2011Radiative forcing via water vapor
M. A. Pfeffer et al.
Title Page
Abstract Introduction
Conclusions References
Tables Figures
◭ ◮
◭ ◮
Back Close
Full Screen / Esc
Printer-friendly Version Interactive Discussion
Discussion
P
a
per
|
Dis
cussion
P
a
per
|
Discussion
P
a
per
|
Discussio
n
P
a
per
|
Chapman, E. G., Gustafson Jr., W. I., Easter, R. C., Barnard, J. C., Ghan, S. J., Pekour, M. S., and Fast, J. D.: Coupling aerosol-cloud-radiative processes in the WRF-Chem model: Investigating the radiative impact of elevated point sources, Atmos. Chem. Phys., 9, 945– 964, doi:10.5194/acp-9-945-2009, 2009. 27641
Derksen, J. W. B., Roelofs, G.-J. H., and R ¨ockmann, T.: Influence of entrainment of
5
CCN on microphysical properties of warm cumulus, Atmos. Chem. Phys., 9, 6005–6015, doi:10.5194/acp-9-6005-2009, 2009. 27641
Fast, J., Gustafson Jr., W., Easter, Jr., R., Zaveri, R., Barnard, J., Chapman, E., Grell, G., and Peckham, S.: Evolution of ozone, particulates, and aerosol direct radiative forcing in the vicinity of Houston using a fully coupled meteorology-chemistry-aerosol model, J. Geophys.
10
Res., 111, D21305, doi:10.1029/2005JD006721, 2006. 27642
Forster, P., Ramaswamy, V., Artaxo, P., Berntsen, T., Betts, R., Fahey, D., Haywood, J., Lean, J., Lowe, D., Myhre, G., Nganga, J., Prinn, R., Raga, G., Schulz, M., and Van Dorland, R.: Changes in Atmospheric Constituents and in Radiative Forcing, in: Climate Change 2007: The Physical Science Basis. Contribution of Working Group I to the Fourth Assessment
15
Report of the Intergovernmental Panel on Climate Change, edited by Solomon, S., Qin, D., Manning, M., Chen, Z., Marquis, M., Averyt, K., Tignor, M., and Miller, H.: Cambridge University Press, Cambridge, United Kingdom and New York, NY, USA, 2007. 27639 Gong, S.: A parameterization of sea-salt aerosol source function for sub- and super-micron
particles, Global Biogeochem. Cy., 17, 1097, doi:10.1029/2003GB002079, 2003. 27643
20
Gustafson Jr., W., Chapman, E., Ghan, S., Easter, Jr., R., and Fast, J.: Impact on modeled cloud characteristics due to simplified treatment of uniform cloud condensation nuclei during NEAQS 2004, Geophy. Res. Lett., 34, L19809, doi:10.1029/2007GL030021, 2007. 27641 Lohmann, U. and Feichter, J.: Global indirect aerosol effects: a review, Atmos. Chem. Phys., 5,
715–737, doi:10.5194/acp-5-715-2005, 2005. 27638
25
Lohmann, U., Stier, P., Hoose, C., Ferrachat, S., Kloster, S., Roeckner, E., and Zhang, J.: Cloud microphysics and aerosol indirect effects in the global climate model ECHAM5-HAM, Atmos. Chem. Phys., 7, 3425–3446, doi:10.5194/acp-7-3425-2007, 2007. 27639
Nightingale, P., Malin, G., Law, C., Watson, A., Liss, P., Liddicoat, M., Boutin, J., and Upstill-Goddard, R.: In situ evaluatino of air-sea gas exchange parameterizations using novel
con-30
servative and volatile tracers, Global Biogeochem. Cy., 14, 373–387, 2000. 27643
ACPD
11, 27637–27659, 2011Radiative forcing via water vapor
M. A. Pfeffer et al.
Title Page
Abstract Introduction
Conclusions References
Tables Figures
◭ ◮
◭ ◮
Back Close
Full Screen / Esc
Printer-friendly Version Interactive Discussion
Discussion
P
a
per
|
Dis
cussion
P
a
per
|
Discussion
P
a
per
|
Discussio
n
P
a
per
E., Brenguier, J., Brewer, W., Brown, P., Chuang, P., Cotton, W., Girolamo, L., Geerts, B., Gerber, H., Goke, S., Gomes, L., Heikes, B., Hudson, J., Kollias, P., Lawson, R., Krueger, S., Lenschow, D., Nuijens, L., O’Sullivan, D., Rilling, R., Rogers, D., Siebesma, A., Snod-grass, E., Stith, J., Thornton, D., Tucker, S., Twohy, C., and Zuidema, P.: Rain in shal-low cumulus over the ocean – The RICO campaign, Bull. Am. Met. Soc., 88, 1912–1928,
5
doi:10.1175/bams-88-12-1912, 2007. 27641
Shaw, W., Allwine, K. J., Fritz, B. G., Rutz, F. C., Rishel, J. P., and Chapman, E. G.: An evaluation of the wind erosion module in DUSTRAN, Atmos. Environ., 42, 1907–1921, 2008. 27643
Small, J., Chuang, P., Feingold, G., and Jiang, H.: Can aerosol decrease cloud lifetime?,
10
Geophys. Res. Lett., 36, L16806, doi:10.1029/2009GL038888, 2009. 27640
Teller, A. and Levin, Z.: The effects of aerosols on precipitation and dimensions of subtropical clouds: a sensitivity study using a numerical cloud model, Atmos. Chem. Phys., 6, 67–80, doi:10.5194/acp-6-67-2006, 2006. 27639
Wang, M. and Penner, J.: Aerosol indirect forcing in a global model with particle nucleation,
15
Atmos. Chem. Phys., 9, 239–260, doi:10.5194/acp-9-239-2009, 2009. 27642
Wang, M. and Penner, J.: Cirrus clouds in a global climate model with a statistical cirrus cloud scheme, Atmos. Chem. Phys, 10, 5449–5474, doi:10.5194/acp-10-5449-2010, 2010. 27639 Xue, H. and Feingold, G.: Large-eddy simulations of trade wind cumuli: Investigation of aerosol
indirect effects, J. Atmos. Sci., 63, 1605–1622, 2006. 27640, 27647
ACPD
11, 27637–27659, 2011Radiative forcing via water vapor
M. A. Pfeffer et al.
Title Page
Abstract Introduction
Conclusions References
Tables Figures
◭ ◮
◭ ◮
Back Close
Full Screen / Esc
Printer-friendly Version Interactive Discussion
Discussion
P
a
per
|
Dis
cussion
P
a
per
|
Discussion
P
a
per
|
Discussio
n
P
a
per
|
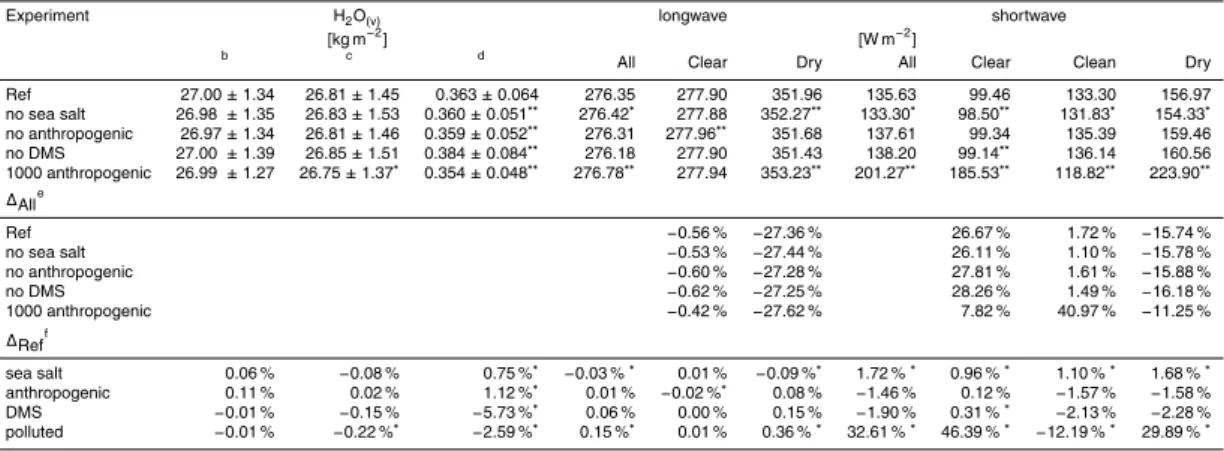
Table 1.H2O(v)and TOA Outgoing Radiationa.
Experiment H2O(v) longwave shortwave
[kg m−2] [W m−2]
b c d
All Clear Dry All Clear Clean Dry Ref 27.00±1.34 26.81±1.45 0.363±0.064 276.35 277.90 351.96 135.63 99.46 133.30 156.97 no sea salt 26.98±1.35 26.83±1.53 0.360±0.051∗∗ 276.42∗ 277.88 352.27∗∗ 133.30∗ 98.50∗∗ 131.83∗ 154.33∗ no anthropogenic 26.97±1.34 26.81±1.46 0.359±0.052∗∗ 276.31 277.96∗∗ 351.68 137.61 99.34 135.39 159.46 no DMS 27.00±1.39 26.85±1.51 0.384±0.084∗∗ 276.18 277.90 351.43 138.20 99.14∗∗ 136.14 160.56
1000 anthropogenic 26.99±1.27 26.75±1.37∗ 0.354±0.048∗∗ 276.78∗∗ 277.94 353.23∗∗ 201.27∗∗ 185.53∗∗ 118.82∗∗ 223.90∗∗
∆Alle
Ref −0.56 % −27.36 % 26.67 % 1.72 % −15.74 %
no sea salt −0.53 % −27.44 % 26.11 % 1.10 % −15.78 % no anthropogenic −0.60 % −27.28 % 27.81 % 1.61 % −15.88 %
no DMS −0.62 % −27.25 % 28.26 % 1.49 % −16.18 %
1000 anthropogenic −0.42 % −27.62 % 7.82 % 40.97 % −11.25 %
∆Reff
sea salt 0.06 % −0.08 % 0.75 %∗ −0.03 %∗ 0.01 % −0.09 %∗ 1.72 %∗ 0.96 %∗ 1.10 %∗ 1.68 %∗
anthropogenic 0.11 % 0.02 % 1.12 %∗ 0.01 % −0.02 %∗ 0.08 % −1.46 % 0.12 % −1.57 % −1.58 % DMS −0.01 % −0.15 % −5.73 %∗ 0.06 % 0.00 % 0.15 % −1.90 % 0.31 %∗ −2.13 % −2.28 % polluted −0.01 % −0.22 %∗ −2.59 %∗ 0.15 %∗ 0.01 % 0.36 %∗ 32.61 %∗ 46.39 %∗ −12.19 %∗ 29.89 %∗
aAll values shown are averaged over the reduced domain where the measurement flights occurred for the model time step at 14:00 (local time) on 11 Jan 2005±1 standard deviation. Top of atmosphere (TOA) long wave and short wave radiation are calculated for all sky (All), no clouds (Clear), no aerosols (Clean; shortwave only), and no H2O(v)(Dry) conditions. The probability that the results of a sensitivity simulation are statistically different from the Reference simulation are shown with one asterisks denoting significance atp >0.8 and two asterisks denoting significance atp >0.9.
bH
2O(v)is the integrated column concentration from above the clouds to the tropopause. cH
2O(v)is the integrated column concentration from above the clouds to the tropopause, only including columns where clouds are present. d
H2O(v)is the integrated column concentration only of the model level directly above the clouds, only including columns where clouds are present. e
∆All =% change relative to all sky calculation. f
ACPD
11, 27637–27659, 2011Radiative forcing via water vapor
M. A. Pfeffer et al.
Title Page
Abstract Introduction
Conclusions References
Tables Figures
◭ ◮
◭ ◮
Back Close
Full Screen / Esc
Printer-friendly Version Interactive Discussion
Discussion
P
a
per
|
Dis
cussion
P
a
per
|
Discussion
P
a
per
|
Discussio
n
P
a
per
Fig. 1. Flight track of the C130 aircraft on 11 January 2005. Image modified from
ACPD
11, 27637–27659, 2011Radiative forcing via water vapor
M. A. Pfeffer et al.
Title Page
Abstract Introduction
Conclusions References
Tables Figures
◭ ◮
◭ ◮
Back Close
Full Screen / Esc
Printer-friendly Version Interactive Discussion
Discussion
P
a
per
|
Dis
cussion
P
a
per
|
Discussion
P
a
per
|
Discussio
n
P
a
per
|
Fig. 2. Vertical profile of concentrations of SO4from DMS (green), NaCl from sea salt (blue),
ACPD
11, 27637–27659, 2011Radiative forcing via water vapor
M. A. Pfeffer et al.
Title Page
Abstract Introduction
Conclusions References
Tables Figures
◭ ◮
◭ ◮
Back Close
Full Screen / Esc
Printer-friendly Version Interactive Discussion
Discussion
P
a
per
|
Dis
cussion
P
a
per
|
Discussion
P
a
per
|
Discussio
n
P
a
per
Fig. 3. The PDF of cloud droplet number concentration (CDNC; left) and liquid water content
ACPD
11, 27637–27659, 2011Radiative forcing via water vapor
M. A. Pfeffer et al.
Title Page
Abstract Introduction
Conclusions References
Tables Figures
◭ ◮
◭ ◮
Back Close
Full Screen / Esc
Printer-friendly Version Interactive Discussion
Discussion
P
a
per
|
Dis
cussion
P
a
per
|
Discussion
P
a
per
|
Discussio
n
P
a
per
|
Fig. 4.The changes in the number of interstitial (not-activated; left) and activated (cloud-borne;
ACPD
11, 27637–27659, 2011Radiative forcing via water vapor
M. A. Pfeffer et al.
Title Page
Abstract Introduction
Conclusions References
Tables Figures
◭ ◮
◭ ◮
Back Close
Full Screen / Esc
Printer-friendly Version Interactive Discussion
Discussion
P
a
per
|
Dis
cussion
P
a
per
|
Discussion
P
a
per
|
Discussio
n
P
a
per
Fig. 5.The PDF of cloud droplet effective radius (ER) for the five experiments calculated using