AMTD
5, 8189–8222, 2012Improved cloud mask algorithm for
FY-3A/VIRR data
X. Wang et al.
Title Page
Abstract Introduction
Conclusions References
Tables Figures
◭ ◮
◭ ◮
Back Close
Full Screen / Esc
Printer-friendly Version Interactive Discussion
Discussion
P
a
per
|
Dis
cussion
P
a
per
|
Discussion
P
a
per
|
Discussio
n
P
a
per
|
Atmos. Meas. Tech. Discuss., 5, 8189–8222, 2012 www.atmos-meas-tech-discuss.net/5/8189/2012/ doi:10.5194/amtd-5-8189-2012
© Author(s) 2012. CC Attribution 3.0 License.
Atmospheric Measurement Techniques Discussions
This discussion paper is/has been under review for the journal Atmospheric Measurement Techniques (AMT). Please refer to the corresponding final paper in AMT if available.
Improved cloud mask algorithm for
FY-3A/VIRR data over the northwest
region of China
X. Wang, W. Li, Y. Zhu, and B. Zhao
Laboratory for Climate and Ocean-Atmosphere Studies, Department of Atmospheric and Oceanic Sciences, School of Physics, Peking University, Beijing, 100871, China
Received: 29 August 2012 – Accepted: 30 October 2012 – Published: 6 November 2012 Correspondence to: W. Li ([email protected])
AMTD
5, 8189–8222, 2012Improved cloud mask algorithm for
FY-3A/VIRR data
X. Wang et al.
Title Page
Abstract Introduction
Conclusions References
Tables Figures
◭ ◮
◭ ◮
Back Close
Full Screen / Esc
Printer-friendly Version Interactive Discussion
Discussion
P
a
per
|
Dis
cussion
P
a
per
|
Discussion
P
a
per
|
Discussio
n
P
a
per
|
Abstract
The existence of various land surfaces has always been a difficult problem for re-searchers who study cloud detection using satellite observations, especially over bright surfaces such as snow and desert. To improve the cloud mask result over complex terrain, an unbiased daytime cloud detection algorithm for the Visible and InfRared
5
Radiometer (VIRR) on board the Chinese FengYun-3A polar-orbiting meteorological satellite is applied over the northwest region of China. Based on the statistical sea-sonal threshold tests, the algorithm consists of six main channels centered on the wavelengths of 0.63, 0.865, 10.8, 1.595, 0.455, and 1.36 µm. The combination of the unbiased algorithm and the specific threshold tests for special surfaces has effectively
10
improved the cloud mask results over complex terrain and decreased the false iden-tifications of clouds. The visual images over snow and desert adopting the proposed scheme exhibit better correlations with true-color images than do the VIRR official cloud mask results. The validation with the Moderate Resolution Imaging Spectroradiometer (MODIS) cloud mask product shows that the probability of detection for clear-sky
re-15
gions over snow of the new scheme has increased nearly five times over the official method, and the false-alarm ratio for cloudy areas over desert has reduced by half compared with the official result. With regard to comparisons between ground mea-surements and cloud mask results, this approach also provides acceptable correspon-dence with the ground observations except for some cases, which are mainly obscured
20
by cirrus clouds.
1 Introduction
Satellite remote sensing has always involved the significant challenge of distinguishing cloudy from clear-sky areas. The presence of clouds contaminates radiometric ob-servations (Kidder and Vonder Haar, 1995), which may cause errors in the retrieval
25
of atmospheric compositions and parameters, especially for research on aerosols
AMTD
5, 8189–8222, 2012Improved cloud mask algorithm for
FY-3A/VIRR data
X. Wang et al.
Title Page
Abstract Introduction
Conclusions References
Tables Figures
◭ ◮
◭ ◮
Back Close
Full Screen / Esc
Printer-friendly Version Interactive Discussion
Discussion
P
a
per
|
Dis
cussion
P
a
per
|
Discussion
P
a
per
|
Discussio
n
P
a
per
|
(Kaufman et al., 2005). Considering the large effect of clouds on radiance, it is nec-essary to provide techniques to separate clouds from clear-sky areas.
Many cloud detection algorithms have been proposed, depending on the purposes of the observations and specifications of the imager. The International Satellite Cloud Cli-matology Project (ISCCP) presented statistical-threshold tests for visible and infrared
5
radiance to differentiate cloudy and clear scenes over various climate regions (Rossow, 1989; Rossow and Garder, 1993). The Advanced Very High Resolution Radiometer (AVHRR) Processing scheme Over cLouds, Land, and Ocean (APOLLO) used two vis-ible and three infrared bands to screen clouds (Saunders and Kriebel, 1988; Gesell, 1989; Kriebel et al., 2003). Clouds from AVHRR (CLAVR) used sequential
decision-10
threshold tree tests to identify the pixels, which were classified into 2×2 global
area-coverage pixel arrays over cloud-free, mixed, and cloudy regions (Stowe et al., 1991, 1994). The dynamic threshold cloud masking (DTCM) algorithm used dynamic thresh-olds to screen clouds over land for AVHRR data and correctly identified a comparable or higher number of cloud-contaminated pixels compared with the CLAVR scheme
15
(Vittorio and Emery, 2002). The cloud mask algorithm for the 36-channel Moderate Resolution Imaging Spectroradiometer (MODIS) was determined by the final confi-dence flags based on five groups of threshold tests (Ackerman et al., 1998). Based on the infrared trispectral algorithm, the cloud thermodynamic phase-discrimination method applied to MODIS data introduced three additional bands located at 0.65,
20
1.63, and 1.90 µm to improve the accuracy of phase retrieval (Baum et al., 2000). Ishida and Nakajima (2009) proposed an unbiased cloud detection scheme based on a neutral concept to restructure the final confidence flags of the MODIS cloud mask algorithm (MOD35) and applied the unbiased CLoud and Aerosol Unbiased Decision Intellectual Algorithm (CLAUDIA) to a virtual imager to investigate the efficiency of
25
AMTD
5, 8189–8222, 2012Improved cloud mask algorithm for
FY-3A/VIRR data
X. Wang et al.
Title Page
Abstract Introduction
Conclusions References
Tables Figures
◭ ◮
◭ ◮
Back Close
Full Screen / Esc
Printer-friendly Version Interactive Discussion
Discussion
P
a
per
|
Dis
cussion
P
a
per
|
Discussion
P
a
per
|
Discussio
n
P
a
per
|
Spectrometer (ENVISAT-MERIS) multispectral imagers was based on the extraction of meaningful physical features to increase cloud detection accuracy (G ´omez-Chova et al., 2007). For FengYun-3A/Visible and InfRared Radiometer (FY-3A/VIRR), the offi -cial cloud mask scheme used multiple-feature (single channel or multiple channels in combination) thresholds determined by a dynamic histogram method or forward
mod-5
eling results (Yang et al., 2011). A daytime cloud detection algorithm with good perfor-mance has also recently been adopted for FY-3A/VIRR; this is an automatic daytime cloud mask technique based on the multispectral threshold synthesis method inherited from MODIS. By adding the difference between the 1.38- and 1.6-µm bands, it can provide improved results for high-cloud detection (He, 2011).
10
To realize accurate cloud masking results, the algorithm should also consider the potential impact of various land surfaces. Especially for brighter surfaces such as snow and desert, large reflectance similar to that of clouds could probably result in these particular clear-sky areas being classified as cloudy. Focused on improving the cloud detection over brighter surfaces, researchers have tried different methods. For
discrim-15
ination of snow-covered areas, the normalized difference snow index (NDSI) has been widely used for many sensors. Defined by the two bands centered on 0.57 and 1.65 µm, NDSI was introduced for Landsat Thematic Mapper (TM) images (Dozier, 1984, 1989). For the VEGETATION (VGT) sensor, the normalized difference snow/ice index (ND-SII) was proposed based on the reflectance values of red and mid-infrared spectral
20
bands (Xiao et al., 2001). NDSI was also applied in the cloud detection algorithm of MODIS (Ackerman et al., 1998). By adding the cloud-phase identification, cloud de-tection over snow/ice for MODIS was developed (King et al., 2004). Relying on the 1.6-, 2.2-, and 1.38-µm-band observations from MODIS, two multispectral enhance-ment techniques were proposed for distinguishing between regions of cloud and snow
25
cover (Miller et al., 2005). MODIS also added six tests to separate clouds over desert regions in daytime imagery, which include a 13.9 µm and a 6.7 µm single brightness temperature test, a 1.38 µm reflectance test, and three brightness temperature diff er-ence tests (11 minus 12 µm, 3.7 minus 11 µm, and 3.7 minus 3.9 µm) (Ackerman et al.,
AMTD
5, 8189–8222, 2012Improved cloud mask algorithm for
FY-3A/VIRR data
X. Wang et al.
Title Page
Abstract Introduction
Conclusions References
Tables Figures
◭ ◮
◭ ◮
Back Close
Full Screen / Esc
Printer-friendly Version Interactive Discussion
Discussion
P
a
per
|
Dis
cussion
P
a
per
|
Discussion
P
a
per
|
Discussio
n
P
a
per
|
1998). To enhance the performance of the cloud mask in the vicinity of desert areas, data from 0.4 µm was used based on the strong contrast between highly reflective clouds and less reflective cloud-free desert regions (Hutchison and Jackson, 2003). For water cover, the normalized difference vegetation index (NDVI) was an effective discrimination method. Defined by the red and near-infrared bands, NDVI was widely
5
applied in vegetative studies (Nemani and Running, 1989; Defries and Townshend, 1994; Carlson and Ripley, 1997). For water-covered regions, the value of NDVI was always negative compared with clouds and other primary land surfaces. Based on this fact, NDVI was also adopted to discriminate water areas (Giglio et al., 2003; Lunetta et al., 2006; Gao et al., 2007).
10
In this paper, an unbiased daytime cloud detection algorithm based on CLAUDIA is applied to FY-3A/VIRR data over the northwest region of China. For multispectral threshold tests, it is necessary to provide a method to regroup the results of each sin-gle test to produce a final result. According to the regrouping schemes, prevailing algo-rithms are designed in two main categories: clear conservative (such as APOLLO and
15
MOD35) and cloud conservative (such as ISCCP). The CLAUDIA algorithm provides a new concept to recombine the single threshold test results. It refers to the multiple threshold method employed in the MODIS cloud mask scheme but reconstructs the calculation method for the final confidence flags to realize neutral results (Ishida and Nakajima, 2009). For mixed pixels, which include clouds and surfaces, the unbiased
20
technique does not directly identify these pixels as clouds or clear areas but calculates clear confidence levels. It provides a more accurate cloud mask result that is not biased to either clear or cloudy. Considering the advantages, the concept of the unbiased algo-rithm will be introduced into the cloud detection for FY-3A/VIRR in this paper to improve the official cloud mask product of VIRR over the northwest region of China. Focused
25
AMTD
5, 8189–8222, 2012Improved cloud mask algorithm for
FY-3A/VIRR data
X. Wang et al.
Title Page
Abstract Introduction
Conclusions References
Tables Figures
◭ ◮
◭ ◮
Back Close
Full Screen / Esc
Printer-friendly Version Interactive Discussion
Discussion
P
a
per
|
Dis
cussion
P
a
per
|
Discussion
P
a
per
|
Discussio
n
P
a
per
|
This paper includes five sections. Section 2 describes the background and data used. Section 3 provides details of the threshold experiments and descriptions of the improved cloud mask algorithm for FY-3A/VIRR. Section 4 describes applications of the cloud mask scheme and compares them with the official products and ground ob-servations. Finally, Sect. 5 provides a summary and discussion.
5
2 Background and data
2.1 Background
The existence of bright land surfaces that have similar radiative characteristics as clouds always leads to errors in cloud detection results. Over snow-covered regions, the high reflectance and cold temperature make it difficult to separate clouds from
10
clear-sky areas. A similar problem exists when the underlying surface is desert. The cloud detection algorithm cannot only depend on the single wavelength threshold test. It is necessary to add more effective techniques to avoid false identifications. In this study, the region from 34◦N to 40◦N and from 73◦E to 82◦E, which lies in the north-west region of China, was chosen for cloud detection experiments. The complex terrain
15
of this region (including snow/ice, desert, water, and land) always results in errors when masking clouds. In this paper, the combination of the unbiased algorithm and specific threshold tests for special surfaces has greatly improved the cloud detection results over the study region.
2.2 Data
20
FY-3A, China’s new generation polar-orbiting meteorological satellite, is capable of a wide range of spectral detection, from ultraviolet, visible, infrared, to the microwave spectrum. It operates at the altitude of 831 km. The local time of the descending node is 10:05 UTC. An onboard sensor, VIRR, which has ten bands in the wavelengths from
AMTD
5, 8189–8222, 2012Improved cloud mask algorithm for
FY-3A/VIRR data
X. Wang et al.
Title Page
Abstract Introduction
Conclusions References
Tables Figures
◭ ◮
◭ ◮
Back Close
Full Screen / Esc
Printer-friendly Version Interactive Discussion
Discussion
P
a
per
|
Dis
cussion
P
a
per
|
Discussion
P
a
per
|
Discussio
n
P
a
per
|
0.44 to 12.5 µm, the scanning range of±55.4◦ and a resolution of 1.1 km, is one of its
key instruments (Dong et al., 2009).
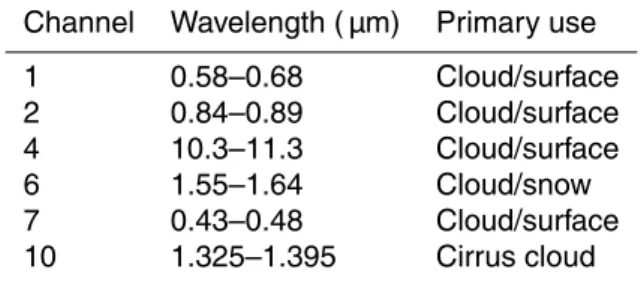
In this study, six main channels of VIRR L1 (level 1) data were used for the cloud de-tection algorithm (Table 1). The robustness of the results was examined through com-parisons with the VIRR official cloud mask product, the MODIS cloud mask product
5
(MOD35), and ground observations from the Meteorological Information Comprehen-sive Analysis and Process System (MICAPS). The VIRR official cloud mask product was generated by the multiple-feature (single channel or multiple channels in combi-nation) threshold tests determined by a dynamic histogram method or forward mod-eling results (Yang et al., 2011) and was provided in hierarchical data format version
10
5 (HDF5). Ground observations from MICAPS were also used to examine the cloud detection scheme. MICAPS is an interactive computer system that integrates all me-teorological, satellite, and radar data into one computer workstation (Li et al., 2010). Version 3.0 includes 19 main categories of data (labeled as 19 diamonds); this com-parison used the measurements of the total amount of clouds from the ground weather
15
stations, as listed in diamond 1.
All of the FY-3A original data and products can be downloaded from the website of the National Satellite Meteorological Center (online at http://fy3.satellite.cma.gov.cn). MICAPS data can be obtained from Peking University (email: [email protected]).
3 Methodology
20
The cloud detection algorithm was mainly based on the CLAUDIA algorithm, which applied the threshold method used in MOD35 but reconstructed the scheme for cal-culating the final confidence flag (Ishida and Nakajima, 2009; Nakajima et al., 2011). According to the channel settings of VIRR, new groups were proposed for unbiased confidence calculations, and additional steps were added for cloud discrimination over
25
AMTD
5, 8189–8222, 2012Improved cloud mask algorithm for
FY-3A/VIRR data
X. Wang et al.
Title Page
Abstract Introduction
Conclusions References
Tables Figures
◭ ◮
◭ ◮
Back Close
Full Screen / Esc
Printer-friendly Version Interactive Discussion
Discussion
P
a
per
|
Dis
cussion
P
a
per
|
Discussion
P
a
per
|
Discussio
n
P
a
per
|
3.1 Traditional threshold definition and tests
The thresholds used in this cloud mask algorithm were calculated according to statis-tical data, obtained from the original observations of VIRR onboard FY-3A during the year 2010. For this analysis, four months (January, April, July, and October) were se-lected to build a statistical database to represent conditions during the four different
5
seasons. The results are presented in five different types: land, snow, water, desert, and clouds.
The traditional thresholds are determined based on the statistical results of the single channel or index. The settings of three thresholds are quite similar to those of MOD35: the low limit, the high limit, and the threshold for pass or fail (T). The low and high limits
10
represent the minimum and maximum of the overlapping intervals, respectively. Values ofT are calculated using a technique used in the research of rain areas (Lovejoy and Austin, 1979). We define a loss functionf as
f =Ab
A +
Ba
B ,
where A and B represent the real total statistical pixels of two types or categories,
15
respectively,T is the threshold to determine which type the pixel belongs to,Ab is the number of A incorrectly classified as B according to T, and Ba is the number of B
incorrectly classified asA. When the loss functionf achieves a minimum such that the sum of the incorrect classified ratio reaches the lowest value, the threshold value will be defined as the finalT.
20
3.1.1 Single reflectance tests
In the visible and near infrared regions, optically thick clouds usually have greater reflectance compared with the underlying surface; this is now used as an effective method to identify cloudy areas. The channels at 0.66 and 0.88 µm, the most common bands used in this spectral range, have exhibited good performance in cloud masking.
25
AMTD
5, 8189–8222, 2012Improved cloud mask algorithm for
FY-3A/VIRR data
X. Wang et al.
Title Page
Abstract Introduction
Conclusions References
Tables Figures
◭ ◮
◭ ◮
Back Close
Full Screen / Esc
Printer-friendly Version Interactive Discussion
Discussion
P
a
per
|
Dis
cussion
P
a
per
|
Discussion
P
a
per
|
Discussio
n
P
a
per
|
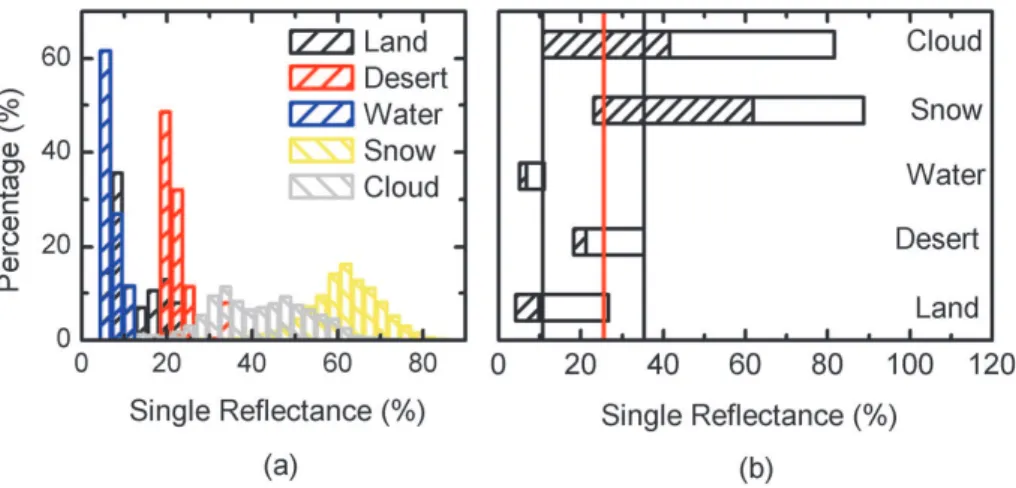
However, reflectance tests may falsely identify bright surfaces, such as deserts and snow-covered areas, as clouds. The statistical results presented here provide the re-flectance distributions of the different surface types and clouds (Fig. 1).
Figure 1a illustrates the histograms of the reflectance at channel 0.66 µm. The re-flectance of snow and clouds covers a broad range, while other types show a relatively
5
intensive distribution. Figure 1b gives clear reflectance ranges covered by the five spe-cific types and indicates where their median values lie (shown by slash marks). The large overlap between clouds and snow generally results in difficulties in distinguish-ing them. However, for land, desert, and water, a sdistinguish-ingle reflectance value appears to maintain less overlap, so these surface types can be differentiated from clouds and
10
snow by the threshold tests. Thus, two major categories can be identified as follows: Cloud (including clouds and snow), and Clear (all others). All single reflectance thresh-olds were calculated on the basis of this classification. Figure 1b also shows where the three specific thresholds are located. The two black lines represent the low and high limits. TheT value is indicated by a red line.
15
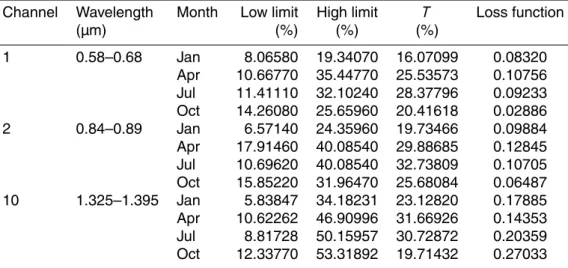
Because it is near a strong water vapor absorption region, the band 1.38 µm test is quite effective at detecting thin cirrus clouds (Gao et al., 1993). Due to the sufficient wa-ter vapor in the lower atmosphere, the channel at 1.38 µm receives little scatwa-tered solar radiance from the surface or low-level clouds. Radiance increases when cirrus clouds are located above almost any atmospheric water vapor. Taking this into consideration,
20
the reflectance threshold test at 1.38 µm of VIRR was used primarily to separate cirrus clouds from clear-sky areas and thick clouds. The single-reflectance thresholds used in this study are shown in Table 2.
3.1.2 NDSI and NDVI tests
To mark snow and water from their own categories, NDSI and NDVI thresholds,
re-25
AMTD
5, 8189–8222, 2012Improved cloud mask algorithm for
FY-3A/VIRR data
X. Wang et al.
Title Page
Abstract Introduction
Conclusions References
Tables Figures
◭ ◮
◭ ◮
Back Close
Full Screen / Esc
Printer-friendly Version Interactive Discussion
Discussion
P
a
per
|
Dis
cussion
P
a
per
|
Discussion
P
a
per
|
Discussio
n
P
a
per
|
While the reflectance of snow cover and clouds are very similar at wavelengths be-low about 1 µm, they diverge in the near infrared and achieve a maximum difference at wavelengths between about 1.55 and 1.75 µm (Gareth, 2006). Based on this fact, the normalized difference snow index (NDSI) was proposed and developed for the dis-crimination of snow (Dozier, 1984, 1989). Here, the NDSI used for VIRR is defined
5
as
NDSI=rr1−r6
1+r6
,
wherer1andr6are the reflectance at channels 1 (0.58–0.68 µm) and 6 (1.55–1.64 µm).
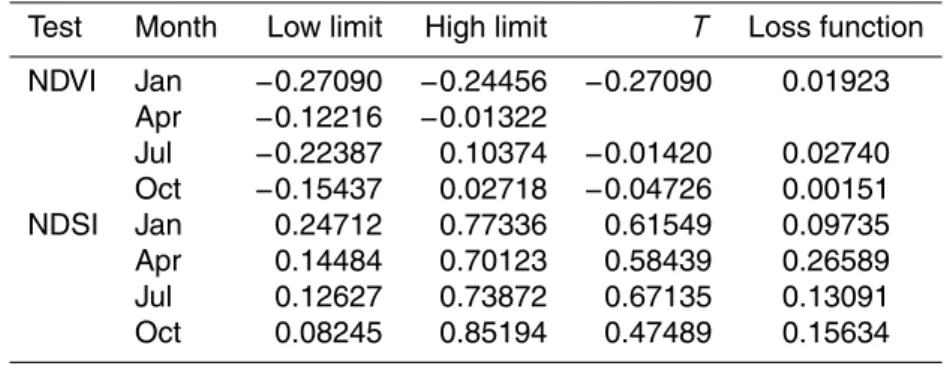
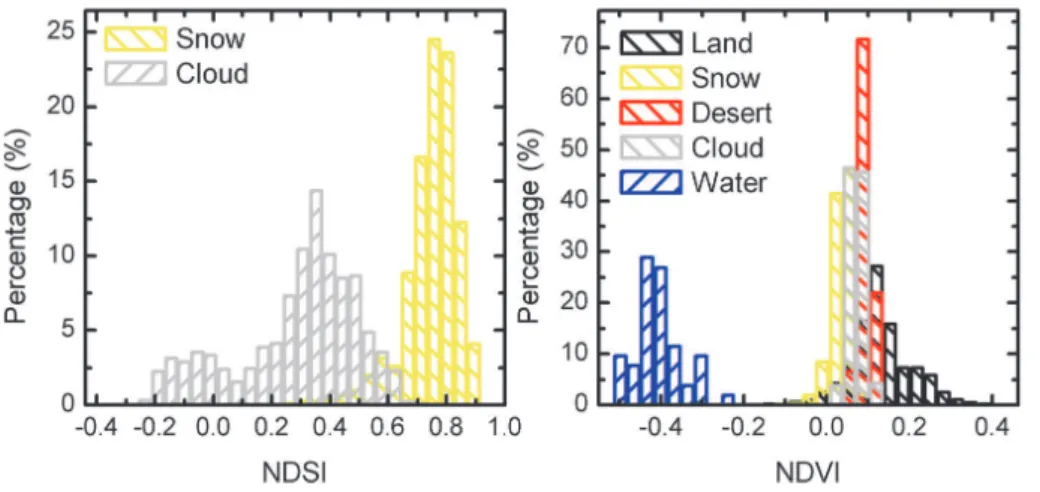
The statistical histogram shows that snow and clouds could be distinctly separated by NDSI (Fig. 2a). Compared with clouds, snow typically has higher NDSI values,
corre-10
sponding to the radiative properties of snow. Table 3 lists specific thresholds.
The Normalized Difference Vegetation Index (NDVI) is defined with the radiance measured by two bands in the red and near infrared as
NDVI=rr2−r1
2+r1
,
where r1 and r2 are the reflectances in channels 1 (0.58–0.68 µm) and 2 (0.84– 15
0.89 µm). Figure 2b illustrates the distribution of NDVI. Because the reflectance of the visible channel is greater than that of the near-infrared channel, the NDVI values for water are negative. For land or desert, NDVI values are greater than or around zero; this difference can be used to mask water regions. Table 3 provides the thresholds for different seasons. For April, because there was no overlap between water and the
20
other types in its category, the pixels covered with water could be picked up only by the value of the low limit.
3.2 Linear threshold definition and tests
To pick up the residual cloudy pixels over the bright desert, channel 7 (0.43–0.48 µm) and channel 4 (10.3–11.3 µm) are used simultaneously in the algorithm. For the
25
AMTD
5, 8189–8222, 2012Improved cloud mask algorithm for
FY-3A/VIRR data
X. Wang et al.
Title Page
Abstract Introduction
Conclusions References
Tables Figures
◭ ◮
◭ ◮
Back Close
Full Screen / Esc
Printer-friendly Version Interactive Discussion
Discussion
P
a
per
|
Dis
cussion
P
a
per
|
Discussion
P
a
per
|
Discussio
n
P
a
per
|
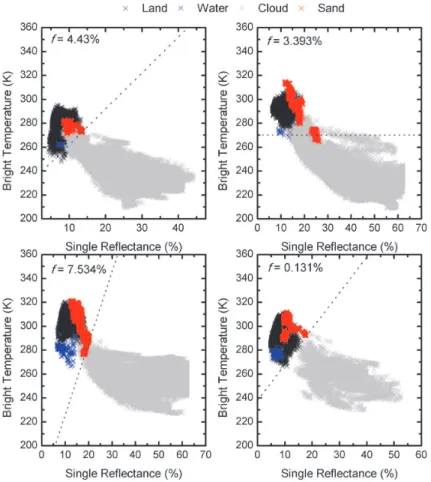
wavelength at channel 7, there is a strong contrast between the more highly reflec-tive clouds and the less reflecreflec-tive cloud-free desert. Combined with channel 4, where the cloud has a lower brightness temperature than clear sky, this contrast separates cloudy pixels from bright desert surfaces.
Figure 3 shows the scatter diagrams for the combined use of these two channels.
5
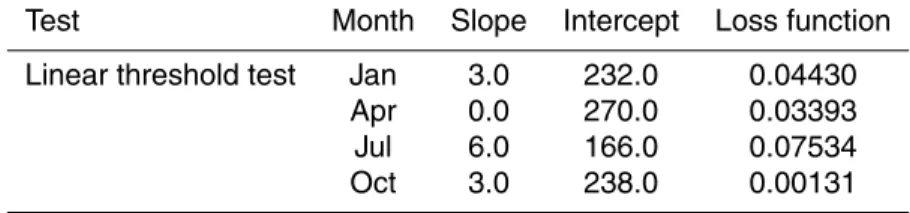
The cloudy pixels can be clearly discriminated from the clear surfaces, especially from the bright desert. According to the distribution in Fig. 3, a linear threshold is introduced to discriminate the residual cloudy pixels from the clear category. The linear form is determined by two factors: the slope and the intercept. As mentioned in Sect. 3.1, when the loss function f achieves a minimum, the line defined by the two factors is
10
chosen to be the final linear threshold. Figure 3 and Table 4 show the linear thresholds and the loss function values for different seasons.
3.3 Cloud detection algorithm
3.3.1 Unbiased confidence flag
CLAUDIA classifies individual tests into two groups based on the trend observed in
15
each test, which is distinct from other prevailing approaches of classification based on the wavelength domain or the primary target of each test (Ishida and Nakajima, 2009). This study used the CLAUDIA classification. To realize unbiased cloud detec-tion, two groups needed to be formed: tests that prefer to be clear conservative (Group 1), and tests that exhibit trends of being cloudy-conservative (Group 2). The rules for
20
classifying individual tests were based on the method proposed by Ishida and Naka-jima (2009). According to this method, the single threshold tests of VIRR can be divided into two groups: Group 1 (clear conservative) includes the channels 1 and 2 reflectance tests; and Group 2 contains only the reflectance test for channel 10.
The definitions of individual confidence levels for single tests used in this study are
25
AMTD
5, 8189–8222, 2012Improved cloud mask algorithm for
FY-3A/VIRR data
X. Wang et al.
Title Page
Abstract Introduction
Conclusions References
Tables Figures
◭ ◮
◭ ◮
Back Close
Full Screen / Esc
Printer-friendly Version Interactive Discussion
Discussion
P
a
per
|
Dis
cussion
P
a
per
|
Discussion
P
a
per
|
Discussio
n
P
a
per
|
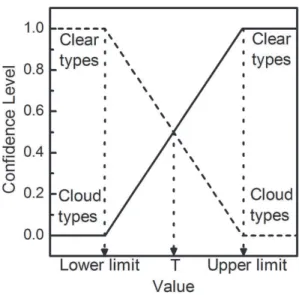
the high limit (or lower than the low limit), probably due to clear sky, the confidence level is assigned to be 1, whereas, if the observed levels are lower than the low limit (or higher than the high limit), with cloudy properties, the confidence level is recorded at 0. The confidence level is set at 0.5 when the observation equals the value ofT, determined by the loss function. Observations between the low and high limits are
5
divided into two parts: higher thanT or lower; the confidence level is also calculated by two linear functions.
The final confidence flags are determined by the equations proposed in CLAUDIA, which are quite different from MOD35:
Q1=1−
q
(1−q1)(1−q2) 10
Q2=q10
Qfinal=
q
Q1Q2
whereq1,q2, andq10 represent the values of individual confidence levels at channels
1, 2, and 10, respectively,Q1 and Q2 are the values of confidence level for groups 1
and 2, andQfinalis the final confidence flag. 15
Unlike MOD35, which divides pixels into four levels (clear, probably clear, uncertain, cloudy), the confidence levels of ambiguous pixels can be defined between 0 and 1 based on the unbiased algorithm, making the selection of the pixels for specific re-search targets easier.
When finishing these steps, the pixels can be divided into the two categories defined
20
above: Cloud or Clear types (see Sect. 3.1.1).
3.3.2 Special surface mask
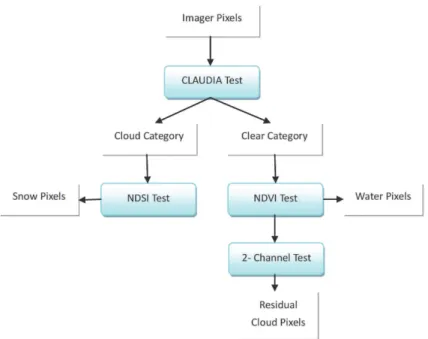
Three specific tests are used for cloud screening over special surfaces: NDSI, NDVI, and combined two-channel tests. Based on the values of the final confidence level, the pixels are classified into two categories: Cloud types (Qfinal between 0 and 0.5) and 25
Clear types (Qfinal between 0.5 and 1). The pixels included in the Cloud category are
AMTD
5, 8189–8222, 2012Improved cloud mask algorithm for
FY-3A/VIRR data
X. Wang et al.
Title Page
Abstract Introduction
Conclusions References
Tables Figures
◭ ◮
◭ ◮
Back Close
Full Screen / Esc
Printer-friendly Version Interactive Discussion
Discussion
P
a
per
|
Dis
cussion
P
a
per
|
Discussion
P
a
per
|
Discussio
n
P
a
per
|
selected for the NDSI test, and the remaining pixels transfer to the other two tests. The flow chart (Fig. 5) gives the specific process of the improved cloud detection algorithm. The pixels could be selected by theT value, when it exists; otherwise, the value of the low limit (or high limit) would be used.
4 Cloud mask results and comparisons
5
4.1 Comparison with official cloud mask product and MOD35
This section focuses on the validation of the proposed algorithm over complex terrain by visual image inspection and by comparisons with the VIRR official cloud mask product and the MODIS cloud mask product (MOD35). The MOD35 and the VIRR official cloud mask product contains four confidence levels: high confidence of clouds (cloudy), low
10
confidence of clouds (uncertain), low confidence of clear-sky (probably clear), and high confidence of clear-sky (clear). The new cloud mask result provides the specific value of confidence level for each pixel, except pixels covered with water, snow, and residual clouds over desert. For comparison, the new cloud mask image is also divided into four levels by the value of the final confidence level: above 0.75 (clear), between 0.5 and
15
0.75 (probably clear), between 0.25 and 0.5 (uncertain), and less than 0.25 (cloudy). Figure 6 shows the cloud mask result over the desert region located from 37.6◦N to 40◦N and from 77.6◦E to 80.8◦E. Data were obtained on 6 March 2011, at 05:25 UTC. Figure 6a is the gray image of VIRR channel 4 (10.3–11.3 µm). Figure 6b is the true-color VIRR image composed of channel 1 (red), channel 9 (green), and channel 7
20
(blue). Figure 6c is the new cloud mask result obtained from the algorithm proposed in this study. Figure 6d is the VIRR official cloud mask product image. Compared with the VIRR official cloud mask product, the new cloud algorithm is in good agreement with the infrared image and the true-color image. The new cloud mask scheme gives more accurate areas covered by clouds, especially for the cloud located at the left
25
AMTD
5, 8189–8222, 2012Improved cloud mask algorithm for
FY-3A/VIRR data
X. Wang et al.
Title Page
Abstract Introduction
Conclusions References
Tables Figures
◭ ◮
◭ ◮
Back Close
Full Screen / Esc
Printer-friendly Version Interactive Discussion
Discussion
P
a
per
|
Dis
cussion
P
a
per
|
Discussion
P
a
per
|
Discussio
n
P
a
per
|
clouds (labeled as light blue) have been detected, greatly improving the cloud mask result over the bright desert. Apparently, the official cloud mask result overestimates the amount of clouds, and cannot provide the specific distributions of clouds.
To provide a specific validation, the MODIS cloud mask product (MOD35), as a high-quality cloud mask product, is taken as “truth” for the validation of the proposed cloud
5
mask algorithm. Two indices are applied to the comparison with MOD35: the probability of detection (POD) and the false-alarm ratio (FAR). These two statistical indices, which are widely used to evaluate the precipitation detection results (Cheng and Brown, 1995; Behrangi et al., 2010), could be adopted to estimate the accuracy of the improved cloud mask results. The definitions in this study are as below:
10
POD=H/(H+M) FAR=F/(H+F) .
The specific representation of each parameter is shown in Fig. 7. For comparison, the data of MOD35 for the desert case were obtained on 6 March 2011, at 05:25 UTC. In order to eliminate the differences between the spatial resolutions of MODIS and VIRR,
15
the distances between the pixels from these two sensors are calculated as below
S=2×6378.137 arcsin
r sin2a
2+cos
2(lat
1) cos2(lat2) sin2 b
2
a=lat1−lat2 b=lon1−lon2,
whereS represents the distance between two pixels, lat1, lat2, lon1, and lon2are the 20
latitudes and longitudes of two pixels, respectively. The minimum distance is then ap-plied to collocate MODIS with VIRR. However, the distance should not exceed 1 km.
Focused on the cloudy pixels for the case over desert, the values of POD for the new cloud mask scheme and the VIRR official cloud mask product are 53.261 % and 67.217 %, achieving similar accuracy. However, the values of FAR have been greatly
25
AMTD
5, 8189–8222, 2012Improved cloud mask algorithm for
FY-3A/VIRR data
X. Wang et al.
Title Page
Abstract Introduction
Conclusions References
Tables Figures
◭ ◮
◭ ◮
Back Close
Full Screen / Esc
Printer-friendly Version Interactive Discussion
Discussion
P
a
per
|
Dis
cussion
P
a
per
|
Discussion
P
a
per
|
Discussio
n
P
a
per
|
Figure 6e illustrates the MOD35 cloud mask image of the case over desert. One of the reasons that the POD of the proposed cloud mask scheme is slightly lower than that of the official product is probably because of the false identifications of the special terrain in the bottom right corner of the image by MOD35. Figure 6f shows the true-color image of VIRR over the same region on a different date. It is obvious that the area
5
in the bottom right corner is supposed to be clear-sky pixels. However, the pixels in this area were falsely identified as cloudy ones in MOD35 and the official product of VIRR, which resulted in a slightly lower POD value for the proposed scheme.
Figure 8 shows a scene over a snow-covered region from 34.6◦N to 37◦N and from 74.5◦E to 77.7◦E, on 22 January 2011 at 05:45 UTC. Figure 8a is the VIRR gray image
10
of channel 6 (1.55–1.64 µm). The settings of the other three images are the same as in Fig. 6. The difference between the reflectance of snow cover and clouds achieves a maximum at wavelengths between about 1.55 and 1.75 µm, and snow shows a lower reflectance (Gareth, 2006). According to this result, the dark-colored areas in Fig. 8a could probably be classified as snow-covered regions. Combined with the true-color
im-15
age, it is apparent that this region is largely covered by snow. Compared with the VIRR official cloud mask product, the new cloud detection algorithm has greatly improved the result over the snow-covered region. The snow-covered areas (shown in yellow), which should be masked as clear, have been modified by the new cloud mask scheme. The official product provides incorrect distributions of clouds and underestimates the areas
20
of clear sky. This could probably introduce errors into subsequent research.
The data from MOD35 on 22 January 2011 at 05:45 UTC as “truth” are applied for the comparison of the case over snow. Focused on the clear-sky pixels, the values of FAR for the new cloud mask scheme and the VIRR official cloud mask product are at a similar level of accuracy with values of 43.345 and 32.485 %, respectively. However,
25
AMTD
5, 8189–8222, 2012Improved cloud mask algorithm for
FY-3A/VIRR data
X. Wang et al.
Title Page
Abstract Introduction
Conclusions References
Tables Figures
◭ ◮
◭ ◮
Back Close
Full Screen / Esc
Printer-friendly Version Interactive Discussion
Discussion
P
a
per
|
Dis
cussion
P
a
per
|
Discussion
P
a
per
|
Discussio
n
P
a
per
|
pixels have been dramatically improved by the proposed scheme over snow-covered regions, especially for the area in the bottom left corner of the image.
4.2 Comparison with MICAPS observation
Ground observations from MICAPS can also be compared with the cloud detection results. Two weather stations located in the research region are used for comparisons:
5
the Hetian site (79.93◦E, 37.13◦N), and the Bachu site (78.57◦E, 39.8◦N). The total amount of clouds observed at these weather stations, which is presented as the ratio of clouds in the naked-eye observed sky, can be used for the validation. According to the rules of ground measurement, if the average height of the clouds is 4 km and the angle of view is 10◦, the area for cloud observation covers approximately 1617 km2(Malberg,
10
1973). Thus, for the cloud detection image, the percentage of clouds is calculated in the region centered at the weather station with a radius of 22.7 km. Based on the pass time of FY-3A, the ground observations at 14:00 LT are used for the validation. Table 5 lists the comparisons.
Compared with the observations at the weather stations, the new cloud mask results
15
provide basically good correlations except several cases where the estimated amount of clouds is generally smaller than the ground observations. For ground observations, the curvature of the Earth may result in overestimation of low clouds with a small hor-izontal angle because openings between clouds can be overlooked; for satellite ob-servations, the presence of thin cirrus clouds may result in underestimation due to the
20
poor identification of them in space (Malberg, 1973). Figure 9 shows the two cases with poor correlations centered on the Hetian site with a 4◦×4◦ array. For the case on
21 January, the infrared image (Fig. 9a) clearly reveals that Hetian site was covered by cirrus clouds. By adding the linear threshold test, parts of the residual cirrus clouds over desert have been screened out, but the proposed cloud mask scheme still
un-25
derestimates the amount of cirrus clouds. For the case on 16 February the high thin cirrus clouds located to the southeast of the site are not identified by the new algo-rithm. The similar cold temperature and high reflectance make it difficult to discriminate
AMTD
5, 8189–8222, 2012Improved cloud mask algorithm for
FY-3A/VIRR data
X. Wang et al.
Title Page
Abstract Introduction
Conclusions References
Tables Figures
◭ ◮
◭ ◮
Back Close
Full Screen / Esc
Printer-friendly Version Interactive Discussion
Discussion
P
a
per
|
Dis
cussion
P
a
per
|
Discussion
P
a
per
|
Discussio
n
P
a
per
|
the thin cirrus clouds over the northwest region of China using only the infrared and near-infrared wavelengths.
5 Conclusions
This study developed an unbiased daytime cloud detection algorithm for FY3A/VIRR. Based on statistical seasonal threshold tests, six main channels were adopted to
im-5
prove the cloud mask over the northwest region of China. Focused on the complex terrain, the combination of the unbiased algorithm and the specific threshold tests for special surfaces has greatly improved the cloud detection result, especially for the re-gions covered by snow and desert. By comparison of the visual images, the results from the new cloud mask scheme are highly consistent with the true-color images. For
10
the comparison with MOD35, the new cloud scheme shows almost five times as much POD as does the VIRR official cloud mask result over snow, and it reduces FAR over the desert region by half.
Observations from MICAPS were also used to examine the cloud mask technique. The new cloud mask results were relatively well correlated except for several cases,
15
which were attributed primarily to the poor detection of cirrus clouds. Because the detection of cirrus clouds continues to be a difficult problem in cloud masking, more effective methods or channels should to be examined in future research to improve cloud mask results.
Acknowledgements. This work was supported by the National Natural Science Foundation of
20
AMTD
5, 8189–8222, 2012Improved cloud mask algorithm for
FY-3A/VIRR data
X. Wang et al.
Title Page
Abstract Introduction
Conclusions References
Tables Figures
◭ ◮
◭ ◮
Back Close
Full Screen / Esc
Printer-friendly Version Interactive Discussion
Discussion
P
a
per
|
Dis
cussion
P
a
per
|
Discussion
P
a
per
|
Discussio
n
P
a
per
|
References
Ackerman, S. A., Strabala, K. I., Menzel, W. P., Frey, R. A., Moeller, C. C., and Gumley, L. E.: Discriminating clear sky from clouds with MODIS, J. Geophys. Res., 103, 32141–32157, 1998.
Baum, B. A., Soulen, P. F., Strabala, K. I., King, M. D., Ackerman, S. A., Menzel, W. P., and
5
Yang, P.: Remote sensing of cloud properties using MODIS airborne simulator imagery dur-ing SUCCESS 2. Cloud thermodynamic phase, J. Geophys. Res., 105, 11781–11792, 2000. Behrangi, A., Hsu, K., Imam, B., and Sorooshian, S.: Daytime precipitation estimation using
bispectral cloud classification system, J. Appl. Meteorol. Clim., 49, 1015–1031, 2010. Carlson, T. N. and Ripley, D. A.: On the relation between NDVI, fractional vegetation cover, and
10
leaf area index, Remote Sens. Environ., 62, 241–252, 1997.
Cheng, M. and Brown, R.: Delineation of precipitation areas by correlation of Meteosat visible and infrared data with radar data, Mon. Weather Rev., 123, 2743–2757, 1995.
Defries, R. S. and Townshend, J. R. G.: NDVI-derived land cover classifications at a global scale, Int. J. Remote Sens., 15, 3567–3586, 1994.
15
Dong, C., Yang, J.,Zhang, W., Yang, Z., Lu, N., Shi, J., Zhang, P., Liu, Y., and Cai, B.: An overview of a new Chinese weather satellite FY-3A, B. Am. Meteorol. Soc., 90, 1531–1544, 2009.
Dozier, J.: Snow reflectance from Landsat-4 thematic mapper, IEEE T. Geosci. Remote, GE-22, 323–328, 1984.
20
Dozier, J.: Spectral signature of alpine snow cover from the landsat thematic mapper, Remote Sens. Environ., 28, 9–22, 1989.
G ´omez-Chova, L., Camps-Valls, G., Calpe-Maravilla, J., Guanter, L., and Moreno, J.: Cloud-screening algorithm for ENVISAT/MERIS multispectral images, IEEE T. Geosci. Remote, 45, 4105–4118, 2007.
25
Gao, B.-C., Goetz, A. F. H., and Wiscombe, W. J.: Cirrus cloud detection from airborne imaging spectrometer data using the 1.38 µm water vapor band, Geophys. Res. Lett., 20, 301–304, doi:10.1029/93GL00106, 1993.
Gao, B.-C., Montes, M. J., Li, R.-R., Dierssen, H. M., and Davis, C. O.: An atmospheric cor-rection algorithm for remote sensing of bright coastal waters using MODIS land and ocean
30
channels in the solar spectral region, IEEE T. Geosci. Remote, 45, 1835–1843, 2007. Gareth, R. W.: Remote Sensing of Snow and Ice, CRC Press, Boca Raton, 285 pp., 2006.
AMTD
5, 8189–8222, 2012Improved cloud mask algorithm for
FY-3A/VIRR data
X. Wang et al.
Title Page
Abstract Introduction
Conclusions References
Tables Figures
◭ ◮
◭ ◮
Back Close
Full Screen / Esc
Printer-friendly Version Interactive Discussion
Discussion
P
a
per
|
Dis
cussion
P
a
per
|
Discussion
P
a
per
|
Discussio
n
P
a
per
|
Gesell, G.: An algorithm for snow and ice detection using AVHRR data An extension to the APOLLO software package, Int. J. Remote Sens., 10, 897–905, 1989.
Giglio, L., Descloitres, J., Justice, C. O., and Kaufman, Y. J.: An enhanced contextual fire de-tection algorithm for MODIS, Remote Sens. Environ., 87, 273–282, 2003.
He, Q.-J.: A daytime cloud detection algorithm for FY-3A/VIRR data, Int. J. Remote Sens., 32,
5
6811–6822, 2011.
Hutchison, K. D. and Jackson, J. M.: Cloud detection over desert regions us-ing the 412 nanometer MODIS channel, Geophys. Res. Lett., 30, 2187, doi:10.1029/2003GL018446, 2003.
Hutchison, K. D., Roskovensky, J. K., Jackson, J. M., Heidinger, A. K., Kopp, T. J., Pavolonis, M.
10
J., and Frey, R.: Automated cloud detection and classification of data collected by the Visible Infrared Imager Radiometer Suite (VIIRS), Int. J. Remote Sens., 26, 4681–4706, 2005. Ishida, H. and Nakajima, T. Y.: Development of an unbiased cloud detection
al-gorithm for a spaceborne multispectral imager, J. Geophys. Res., 114, D07206, doi:10.1029/2008JD010710, 2009.
15
Kaufman, Y. J., Remer, L. A., Tanre, D., Li, R.-R., Kleidman, R., Mattoo, S., Levy, R. C., Eck, T. F., Holben, B. N., Ichoku, C., Martins, J. V., and Koren, I.: A critical examination of the residual cloud contamination and diurnal sampling effects on MODIS estimates of aerosol over ocean, IEEE T. Geosci. Remote, 43, 2886–2897, 2005.
Kidder, S. Q. and Haar, T. H. V.: Satellite Meteorology: an Introduction, Academic Press,
Cali-20
fornia, 466 pp., 1995.
King, M. D., Platnick, S., Yang, P., Arnold, G. T., Gray, M. A., Riedi, J. C., Ackerman, S. A., and Liou, K.-N.: Remote sensing of liquid water and ice cloud optical thickness and effective radius in the Arctic: application of airborne multispectral MAS data, J. Atmos. Ocean. Tech., 21, 857–875, 2004.
25
Kriebel, K. T., Gesell, G., K ¨astner, M., and Mannstein, H.: The cloud analysis tool APOLLO: improvements and validations, Int. J. Remote Sens., 24, 2389–2408, 2003.
Li, Y., Cao, L., Gao, S., and Lu, B.: The current stage and development of MICAPS, Meteor. Mon., 36, 50–55, 2010.
Lovejoy, S. and Austin, G. L.: The delineation of rain areas from visible and IR satellite data for
30
AMTD
5, 8189–8222, 2012Improved cloud mask algorithm for
FY-3A/VIRR data
X. Wang et al.
Title Page
Abstract Introduction
Conclusions References
Tables Figures
◭ ◮
◭ ◮
Back Close
Full Screen / Esc
Printer-friendly Version Interactive Discussion
Discussion
P
a
per
|
Dis
cussion
P
a
per
|
Discussion
P
a
per
|
Discussio
n
P
a
per
|
Lunetta, R. S., Knight, J. F., Ediriwickrema, J., Lyon, J. G., and Worthy, L. D.: Land-cover change detection using multi-temporal MODIS NDVI data, Remote Sens. Environ., 105, 142–154, 2006.
Malberg, H.: Comparison of mean cloud cover obtained by satellite photographs and ground-based observations over Europe and the Atlantic, Mon. Weather Rev., 101, 893–897, 1973.
5
Miller, S. D., Lee, T. F., and Fennimore, R. L.: Satellite-based imagery techniques for daytime cloud/snow delineation from MODIS, J. Appl. Meteorol., 44, 987–997, 2005.
Nakajima, T., Tsuchiya, T., Ishida, H., Matsui, T., and Shimoda, H.: Cloud detection performance of spaceborne visible-to-infrared multispectral imagers, Appl. Optics, 50, 2601–2616, 2011. Nemani, R. R. and Running, S. W.: Estimation of regional surface resistance to
evapotranspi-10
ration from NDVI and thermal-IR AVHRR data, J. Appl. Meteorol., 28, 276–284, 1989. Rossow, W. B.: Measuring cloud properties from space: a review, J. Climate, 2, 201–213, 1989. Rossow, W. B. and Garder, L. C.: Cloud detection using satellite measurements of infrared and
visible radiances for ISCCP, J. Climate, 6, 2341–2369, 1993.
Saunders, R. W. and Kriebel, K. T.: An improved method for detecting clear sky and cloudy
15
radiances from AVHRR data, Int. J. Remote Sens., 9, 123–150, 1988.
Stowe, L. L., McClain, E. P., Carey, R., Pellegrino, P., Gutman, G. G., Davis, P., Long, C., and Hart, S.: Global distribution of cloud cover derived from NOAA/AVHRR operational satellite data, Adv. Space Res., 11, 51–54, 1991.
Stowe, L. L., Vemury, S. K., and Rao, A. V.: AVHRR clear-sky radiation data sets at
20
NOAA/NESDIS, Adv. Space Res., 14, 113–116, 1994.
Vittorio, A. V. D. and Emery, W. J.: An automated, dynamic threshold cloud-masking algorithm for daytime AVHRR images over land, IEEE T. Geosci. Remote, 40, 1682–1694, 2002. Xiao, X., Shen, Z., and Qin, X.: Assessing the potential of VEGETATION sensor data for
map-ping snow and ice cover: a normalized difference snow and ice index, Int. J. Remote Sens.,
25
22, 2479–2487, 2001.
Yang, J., Dong, C., Lu, N., Yang, Z., Shi, J., Zhang, P., Liu, Y., and Cai, B.: The new generation FengYun polar-orbiting meteorological satellite of China: operational products and applica-tions, Science Press, Beijing, 368 pp., 2011.
AMTD
5, 8189–8222, 2012Improved cloud mask algorithm for
FY-3A/VIRR data
X. Wang et al.
Title Page
Abstract Introduction
Conclusions References
Tables Figures
◭ ◮
◭ ◮
Back Close
Full Screen / Esc
Printer-friendly Version Interactive Discussion
Discussion
P
a
per
|
Dis
cussion
P
a
per
|
Discussion
P
a
per
|
Discussio
n
P
a
per
|
Table 1.VIRR Channels used for the cloud detection algorithm in this study. Channel Wavelength ( µm) Primary use
1 0.58–0.68 Cloud/surface
2 0.84–0.89 Cloud/surface
4 10.3–11.3 Cloud/surface
6 1.55–1.64 Cloud/snow
7 0.43–0.48 Cloud/surface
AMTD
5, 8189–8222, 2012Improved cloud mask algorithm for
FY-3A/VIRR data
X. Wang et al.
Title Page
Abstract Introduction
Conclusions References
Tables Figures
◭ ◮
◭ ◮
Back Close
Full Screen / Esc
Printer-friendly Version Interactive Discussion
Discussion
P
a
per
|
Dis
cussion
P
a
per
|
Discussion
P
a
per
|
Discussio
n
P
a
per
|
Table 2.Threshold values of each single reflectance test during the four seasons.
Channel Wavelength Month Low limit High limit T Loss function
(µm) (%) (%) (%)
1 0.58–0.68 Jan 8.06580 19.34070 16.07099 0.08320
Apr 10.66770 35.44770 25.53573 0.10756 Jul 11.41110 32.10240 28.37796 0.09233 Oct 14.26080 25.65960 20.41618 0.02886
2 0.84–0.89 Jan 6.57140 24.35960 19.73466 0.09884
Apr 17.91460 40.08540 29.88685 0.12845 Jul 10.69620 40.08540 32.73809 0.10705 Oct 15.85220 31.96470 25.68084 0.06487 10 1.325–1.395 Jan 5.83847 34.18231 23.12820 0.17885 Apr 10.62262 46.90996 31.66926 0.14353 Jul 8.81728 50.15957 30.72872 0.20359 Oct 12.33770 53.31892 19.71432 0.27033
AMTD
5, 8189–8222, 2012Improved cloud mask algorithm for
FY-3A/VIRR data
X. Wang et al.
Title Page
Abstract Introduction
Conclusions References
Tables Figures
◭ ◮
◭ ◮
Back Close
Full Screen / Esc
Printer-friendly Version Interactive Discussion
Discussion
P
a
per
|
Dis
cussion
P
a
per
|
Discussion
P
a
per
|
Discussio
n
P
a
per
|
Table 3.Threshold values of NDVI and NDSI tests during the four seasons. Test Month Low limit High limit T Loss function NDVI Jan −0.27090 −0.24456 −0.27090 0.01923
Apr −0.12216 −0.01322
Jul −0.22387 0.10374 −0.01420 0.02740 Oct −0.15437 0.02718 −0.04726 0.00151
NDSI Jan 0.24712 0.77336 0.61549 0.09735
Apr 0.14484 0.70123 0.58439 0.26589
Jul 0.12627 0.73872 0.67135 0.13091
AMTD
5, 8189–8222, 2012Improved cloud mask algorithm for
FY-3A/VIRR data
X. Wang et al.
Title Page
Abstract Introduction
Conclusions References
Tables Figures
◭ ◮
◭ ◮
Back Close
Full Screen / Esc
Printer-friendly Version Interactive Discussion
Discussion
P
a
per
|
Dis
cussion
P
a
per
|
Discussion
P
a
per
|
Discussio
n
P
a
per
|
Table 4.The definition values of the linear threshold test during the four seasons.
Test Month Slope Intercept Loss function
Linear threshold test Jan 3.0 232.0 0.04430
Apr 0.0 270.0 0.03393
Jul 6.0 166.0 0.07534
Oct 3.0 238.0 0.00131
AMTD
5, 8189–8222, 2012Improved cloud mask algorithm for
FY-3A/VIRR data
X. Wang et al.
Title Page
Abstract Introduction
Conclusions References
Tables Figures
◭ ◮
◭ ◮
Back Close
Full Screen / Esc
Printer-friendly Version Interactive Discussion
Discussion
P
a
per
|
Dis
cussion
P
a
per
|
Discussion
P
a
per
|
Discussio
n
P
a
per
|
Table 5.Comparisons between ground observations and VIRR cloud mask results.
Time Hetian site Cloud mask Bachu site Cloud mask
(mmdd UTC) percentage of clouds percentage of clouds percentage of clouds percentage of clouds
(%) (%) (%) (%)
0105 05:55 0 0 70 81
0110 06:00 0 0 0 0
0121 05:55 70 16 0 0
0126 06:00 0 0 0 0
0131 06:05 70 100 70 100
0205 06:10 40 29 70 90
0216 06:05 50 0 40 32
0221 06:10 0 0 70 86
0222 05:50 70 100 70 92
0309 06:10 0 0 0 0
0310 05:50 0 0 0 0
AMTD
5, 8189–8222, 2012Improved cloud mask algorithm for
FY-3A/VIRR data
X. Wang et al.
Title Page
Abstract Introduction
Conclusions References
Tables Figures
◭ ◮
◭ ◮
Back Close
Full Screen / Esc
Printer-friendly Version Interactive Discussion
Discussion
P
a
per
|
Dis
cussion
P
a
per
|
Discussion
P
a
per
|
Discussio
n
P
a
per
|
Fig. 1. (a)Histograms and (b)ranges of the reflectance distributions of the different surface types and clouds at channel 1 of VIRR during April in 2010; For(b)the location of the median values labeled as slash marks, the low limit and high limit labeled as black lines,T labeled as red line.
AMTD
5, 8189–8222, 2012Improved cloud mask algorithm for
FY-3A/VIRR data
X. Wang et al.
Title Page
Abstract Introduction
Conclusions References
Tables Figures
◭ ◮
◭ ◮
Back Close
Full Screen / Esc
Printer-friendly Version Interactive Discussion
Discussion
P
a
per
|
Dis
cussion
P
a
per
|
Discussion
P
a
per
|
Discussio
n
P
a
per
|
Fig. 3.The scatter diagrams for channel 4 and 7 during the four seasons; the linear thresholds (dashed lines).
AMTD
5, 8189–8222, 2012Improved cloud mask algorithm for
FY-3A/VIRR data
X. Wang et al.
Title Page
Abstract Introduction
Conclusions References
Tables Figures
◭ ◮
◭ ◮
Back Close
Full Screen / Esc
Printer-friendly Version Interactive Discussion
Discussion
P
a
per
|
Dis
cussion
P
a
per
|
Discussion
P
a
per
|
Discussio
n
P
a
per
|
Fig. 5.The flow chart of the improved cloud detection algorithm.
AMTD
5, 8189–8222, 2012Improved cloud mask algorithm for
FY-3A/VIRR data
X. Wang et al.
Title Page
Abstract Introduction
Conclusions References
Tables Figures
◭ ◮
◭ ◮
Back Close
Full Screen / Esc
Printer-friendly Version Interactive Discussion
Discussion
P
a
per
|
Dis
cussion
P
a
per
|
Discussion
P
a
per
|
Discussio
n
P
a
per
|
Fig. 7.The parameters of POD and FAR.
AMTD
5, 8189–8222, 2012Improved cloud mask algorithm for
FY-3A/VIRR data
X. Wang et al.
Title Page
Abstract Introduction
Conclusions References
Tables Figures
◭ ◮
◭ ◮
Back Close
Full Screen / Esc
Printer-friendly Version Interactive Discussion
Discussion
P
a
per
|
Dis
cussion
P
a
per
|
Discussion
P
a
per
|
Discussio
n
P
a
per
|
Fig. 9.The cases for comparisons at Hetian site. The red rectangle represents Hetian site; the grey image of VIRR channel 4 (10.3–11.3 µm)(a)on 21 January 2011 at 05:55 UTC and(b)
on 16 February 2011 at 06:05 UTC;(c)and(d)the corresponding cloud mask results obtained from the algorithm proposed in this study.