Original papers
DIFFERENTIAL ANALYSIS OF VOLUMETRIC STRAINS IN POROUS
MATERIALS IN TERMS OF WATER FREEZING
#ZBIGNIEW RUSIN, GRZEGORZ STELMASZCZYK, PRZEMYSLAW SWIERCZ Kielce University of Technology, Faculty of Civil Engineering and Architecture,
Al. Tysiaclecia Panstwa Polskiego 7, 25-314 Kielce, Poland
#E-mail: [email protected]
Submitted November 29, 2012; accepted February 28, 2013
Keywords: Water freezing, Volumetric strains, Pore characteristics
The paper presents the differential analysis of volumetric strain (DAVS). The method allows measurements of volumetric deformations of capillary-porous materials caused by water-ice phase change. The VSE indicator (volumetric strain effect), which under certain conditions can be interpreted as the minimum degree of phase change of water contained in the material pores, is proposed. The test results (DAVS) for three materials with diversiied microstructure: clinker brick, calcium-silicate brick and Portland cement mortar were compared with the test results for pore characteristics obtained with the mercury intrusion porosimetry.
INTRODUCTION
An analysis of volumetric strains in freezing samp-les of porous materials illed with water may constitute an interesting supplement to the methodology of research on microstructure susceptibility to water phase change. Common tools for assessing the intensity of internal processes are popular methods based on measurements of linear strains, most often used to evaluate the defor-mation remaining after freeze/thaw cycles.
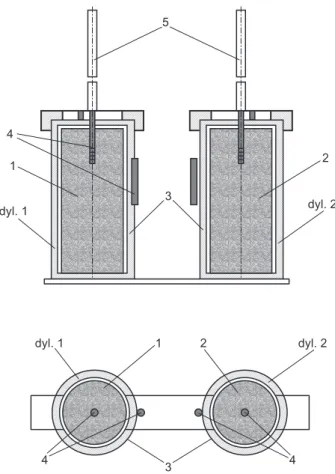
The proposed method of differential analysis of volumetric strains (DAVS) makes it possible to observe the effects of freezing on the whole of the material sample, including the water expelling onto the surface. A scope of the problem, which is separation of the thermal deformations caused by cooling from volumetric strains directly related to water-ice phase change, is limited due to the application of a comparative dilatometer (containing the sample without water), and also because of the introduction of additional corrective amendments. A variety of differential analysis of volumetric strains (DAVS) has been used since 1986 [1]. The idea of the test was inspired by earlier works [2, 3] that focused on concrete aggregate tests performed in a single dilatometer. In the tests presented in the paper, the water-saturated sample was placed in a steel measuring dilatometer (Dilatometer 1), shown in Figure 1. In Dila-tometer 2, a control sample of the same dimensions and approximately the same thermal deformability coefi-cient was located.
Figure 1. Set-up of measuring dilatometers. 1 - water-saturated tested sample, 2 - control sample, 3 -– measuring dilatometers, 4 - temperature sensors, 5 - measuring tubes.
5
3
3 4
1
dyl. 1
2
4 2
dyl. 2
dyl. 2
dyl. 1 1
The dilatometers were equipped with calibrated measuring tubes and temperature sensors placed in-side the samples and outin-side the dilatometers. The dila-tometers were illed with kerosene to the “0” level on the measuring tubes. Each sample was freezing in the thermostat which made it possible to obtain a programmed temperature change proile as a function of time. Each time, the freezing cycle was preceded by a several-hour-long temperature stabilization at the level of + 2°C. The freezing cycle consisted of the linear cooling phase from the temperature of + 2°C to the temperature of – 25°C, over 2 hours and 45 minutes, at the rate of approx. 0.16°C/min, and also the temperature stabilization phase at the level of – 25°C over 2 hours 45 minutes. The course of changes in the temperature of the dilatometer cooling liquid over the test cycle is shown in Figure 2.
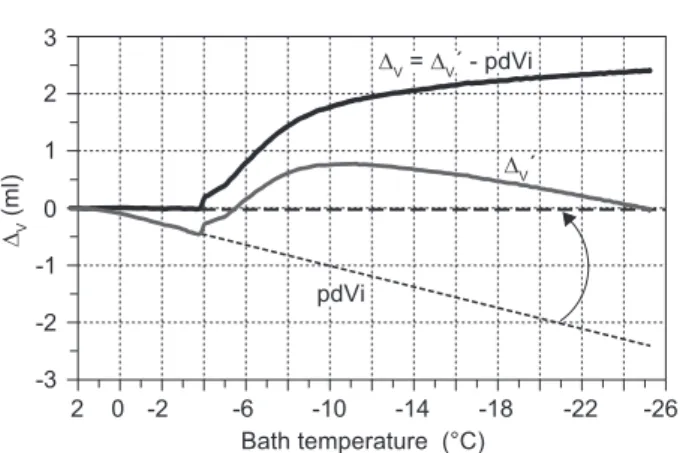
Changes in sample volume in cooling were auto-matically recorded with a digital camera every 60 se- conds, and then the kerosene level was read from the photographs with an accuracy of 0.01 cm3. The tem-perature inside the samples and on the surface of the dilatometers was recorded every 60 seconds. Temperature changes were recorded with an accuracy of ± 0.1°C. As the recorded volumetric changes were considerably affected by differences in the kerosene volume in the dilatometers, temperature differences between the dilato-meters resulting from the non-homogeneous temperature ield inside the heating-and-cooling thermostat as well as differences in the speciic heat of two samples (wet and dry), an appropriate adjustment was introduced. This adjustment was calculated for each measurement individually, basing on the analysis of ΔV’ deviation
from the “0” value at the initial measurement stage until the moment of water crystallization onset. It is assumed that the deviation has a linear nature across the entire measuring range. The procedure is presented in Figure 3.
During the test, temperatures inside and outside the dilatometers were recorded. Figure 4 presents the value of ΔT, which equals the difference of temperatures inside
Dilatometer 1 and 2.
With the assumption that all the sample pores have been illed with water (e.g. during vacuum saturation), it is possible to approximately interpret the result of the volumetric strain in freezing in terms of the water quantities undergoing crystallization in relation to the total content of water evaporable at the temperature of + 105°C. Since an increase in ice volume in relation to water volume amounts to 9.17 %, the following rough assumption is made: the volumetric strain equal to 0.0917 cm3/g water in the pores corresponds to 100 % water-ice phase change. The relative minimal weight of ice may be calculated on the basis of the formula:
where VSE is the volumetric strain effect which may be roughly treated as a relative minimal content of ice, %, mw is the weight of water which ills the sample pores.
EXPERIMENTAL AND RESULTS
Three different building materials were tested: clin-ker brick, calcium silicate brick and Portland cement mortar (w/c = 0.45). Some properties of the materials are presented in Table 1.
Figure 2. Course of temperature changes over the freezing cycle.
-30 -20 -10 0
-25 -15 -5 5
5
0 1 2 3 4 6
Time (h)
T
e
m
p
e
ra
tu
re
(
°C
)
Figure 3. The inal calibration adjustment of ΔV. -3
-2 -1 0 1 2 3
-26 -22 -18 -14 -10 -6 -2 0 2
∆V
(
m
l)
Bath temperature (°C) ∆V´ ∆V = ∆V´ - pdVi
pdVi
Figure 4. Sample record of ΔT (measured inside Dilatometer 1 and Dilatometer 2) versus bath temperature.
-0.5 0 0.5 1.0 1.5 2.0 2.5
-26 -22 -18 -14 -10 -6 -2 0 2 ∆T
(
°C
)
Bath temperature (°C)
100 % 0.0917
mw
V
× ×
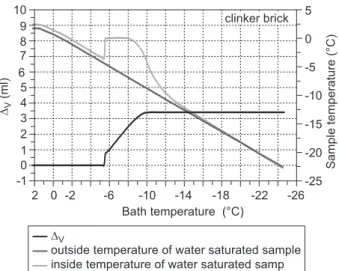
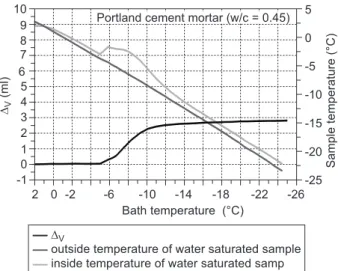
The samples for DAVS method were cut by drilling. The sample had a diameter of 50 mm and a length of 150 mm. Before vacuum absorption all samples were dried in an oven at 105°C. The registered values of the ΔT and ΔV
are shown in Figures 5-8.
In addition, the distribution of pore sizes was determined by the mercury intrusion porosimetry. Figure 9 shows the cumulative intruded pore volume vs pore size. The data are presented in relation to the total pore volume of each sample.
DISCUSSION
The volumetric strains of the materials presented in the form of VSE may be roughly treated as a relative minimal content of ice. Such a presentation is shown in Figure 10.
Taking into account the assumption that VSE repre-sents the minimal relative amount of ice, the speciic characteristics of material porosity may be described in terms of three groups of pores: those containing water which is able to freeze up to – 25°C, those containing water which does not undergo the phase change in this range of temperatures and the pores which are not illed with water under vacuum treatment.
Taking assumptions for the Gibbs-Thomson for-mula in the same way as it was presented in [4], the relation between the pore radius and the freezing point temperature may be useful for the analysis of the material properties tested by the DAVS method. According to the formula, the temperature of – 25°C corresponds to the pore radius of approx. 0.004 μm.
In clinker brick cooling, an increase in the ΔV value stopped when the temperature inside Dilatometer 1 reached – 5°C (the outer surface of the dilatometer body was around – 10°C). According to the Gibbs-Thomson’s formula, the whole water capable of freezing was loca-ted in the pores, the radii of which were above 0.015 μm. The MIP examination (Figure 11) does not indicate the presence of signiicant quantities of pores between 0.004 and 0.015 μm. The analysis of the VSE (Figure 10) shows that about 90 % of the total quantity of water was transformed. About 10% of the water was absorbed by the pores smaller than 0.004 mm. The comparison of Table 1. Properties of the materials.
Material volumetric density total porosity vacuum absorption amount of water degree of pore illing (g/cm3) LeChatelier (%) (%) in sample (g) with the water (%)
clinker brick 2.20 19.3 17.7 41.0 91.7
calcium silicate brick 1.79 29.4 25.4 72.4 86.4
portland cement mortar,
w/c = 0.45 2.11 23.9 21.0 63.4 87.9
Figure 5. ΔT values for clinker brick, calcium-silicate brick and cement mortar.
Figure 7. ΔV and the internal and external temperature record for calcium-silicate brick.
Figure 6. ΔV and the internal and external temperature record for clinker brick.
-1 0 1 2 3 4 5 6 7 8 -26 -22 -18 -14 -10 -6 -2 0 2 ∆T ( °C )
Bath temperature (°C) clinker brick calcium-silicate brick portland cement mortar w/c = 0.45
-1 0 1 2 3 4 5 6 7 8 9 10 -26 -22 -18 -14 -10 -6 -2 0 2 ∆V ( m l)
Bath temperature (°C)
-25 -20 -15 -10 -5 0 5 S a m p le t e m p e ra tu re ( °C ) ∆V
outside temperature of water saturated sample inside temperature of water saturated samp
calcium-silicate brick -1 0 1 2 3 4 5 6 7 8 9 10 -26 -22 -18 -14 -10 -6 -2 0 2 ∆V ( m l)
Bath temperature (°C)
-25 -20 -15 -10 -5 0 5 S a m p le t e m p e ra tu re ( °C ) ∆V
outside temperature of water saturated sample inside temperature of water saturated samp
the absorption of the sample under vacuum with its total porosity (Table 1) indicates that approximately 8.3 % of the pores are not illed with water. So, it cannot be excluded that the amount of ice was greater than that presented in Figure 10. An increase in pressure caused by freezing can be very high in isolated small pores (more than 200 MPa), which could lead to the partial illing with water of the pores that were not illed under vacuum absorption.
In the case of calcium-silicate brick (Figure 7) after the stage of initial freezing of supercooled water, further increase in ΔV may be observed for temperatures below – 20°C. Figure 10 shows that at least 80 % of water in the sample froze, about 20 % of ice was formed below – 10°C (estimated on the basis of the temperature inside the sample), which corresponds to the range of pore dimensions approx. 0.004 - 0.008 mm. The analysis of the data in Figure 11 shows that in this area, the pore mercury has a volume of about 6 % of the total volume of intruded mercury in the MIP test. The VSE index
shows that about 20 % of the water was not frozen. It cannot be excluded, as in the case of clinker brick, that due to pressure, a part of the water moved to the area not illed earlier.
The lowest value of the VSE was recorded for ce-ment mortar sample. The water froze to a signiicantly lesser extent than in calcium-silicate brick. Recorded thermal effects (ΔT- Figure 5) also indicate a limited range of the phase change process in the mortar. This phenomenon has been known for a long time [5] and conirmed repeatedly in laboratory studies. Cement with a very low w/c can hardly contain any water capable of freezing. In this context, the mortar of w/c = 0.45, additionally dried at 105°C, has not only small pores containing unfrozen water, but also some pores in which water was transformed into ice (r > 0.004 µm) - Figures 9 and 11. As in previous cases, without validation with the use of low temperature calorimetry it cannot be excluded that additional quantities of water were frozen without the possibility of those being recorded by the DAVS method.
The samples were subjected to a single time free-zing. Due to the susceptibility of their microstructure, that could lead to changes in porosity. An increase in the amount of pores containing water that can be frozen may be signiicantly different in next cycles, indicating the beginning of destruction or lack thereof in the case of resistant microstructure.
Figure 8. ΔV and the internal and external temperature record for Portland cement mortar (w/c = 0.45).
Figure 9. Cumulative intruded pore volume vs pore size in
re-lation to the total pore volume. Figure 11. Log differential intrusion vs pore size in relation to the total pore volume. Figure 10. Volumetric strain effect VSE vs bath temperature. -1 0 1 2 3 4 5 6 7 8 9 10 -26 -22 -18 -14 -10 -6 -2 0 2 ∆V ( m l)
Bath temperature (°C)
-25 -20 -15 -10 -5 0 5 S a m p le t e m p e ra tu re ( °C ) ∆V
outside temperature of water saturated sample inside temperature of water saturated samp
Portland cement mortar (w/c = 0.45)
0 10 20 30 40 50 60 70 80 90 100 100 10 1 0.1 0.01 0.001 %
Pore radius (µm)
clinker brick calcium-silicate brick portland cement mortar
0 2 4 6 8 10 12 14 16 18 20 100 10 1 0.1 0.01 0.001 %
Pore radius (µm) clinker brick
calcium-silicate brick portland cement mortar 0 10 20 30 40 50 60 70 80 90 100 -26 -22 -18 -14 -10 -6 -2 0 2 V S E ( % )
CONCLUSION
● The DAVS method allows a comparison of different porous materials in terms of water freezing.
● The VSE parameter might be considered as an indicative parameter of the minimum content of ice in the sample.
● The DAVS method makes it possible to observe the effects of water freezing in relatively large samples including the phenomena dependent on the length of lows of still unfrozen water.
● It seems necessary to validate the observed volumetric strains using low temperature calorimetry and also other available methods, e.g. the NMR.
REFERENCES
1. Rusin Z. in: Proc. XXXII Konferencja Naukowa KILiW PAN i KN PZITB, p.161-166, Tom 4, Krynica 1986. 2. Larson T.D., Cady P.D.: Identiication of Frost-Susceptible
Particles in Concrete Aggregates, NCHR Program Report
66, 1969.
3. Fagerlund G.: Frost Resistance of Concrete with Porous
Aggregate. Cement and Concrete Research Institute at the
Institute of Technology, Fack, Stockholm, 1978.
4. Lin Liu, Guang Ye, Erik Schlangen, Huisu Chen, Zhiwei Qian, Wen Sun, Klaas van Breugel: Cement & Concrete Composites 33, 562 (2011).