6
Scientific Drilling, Special Issue No.1, 2007Part 3 : Fault Zone Structure, Composition, and Physical Properties
Part 3 : Fault Zone Structure, Composition, and Physical Properties
San Andreas Fault Zone Mineralogy, Geochemistry, and
Physical Properties from SAFOD Cuttings and Core
by John G. Solum, Stephen Hickman, David A. Lockner, Sheryl Tembe, Jim P. Evans,
Sarah D. Draper, D.C. Barton, David L. Kirschner, Judith S. Chester,
Frederick M. Chester, Ben A. van der Pluijm, Anja M. Schleicher, Diane E. Moore,
k M. Chester, Ben A. van der Pluijm, Anja M. Schleicher, Diane E. Moore,
M. Chester, Ben A. van der Pluijm, Anja M. Schleicher, Diane E. Moore,
e E. Moore,
E. Moore,
Carolyn Morrow, Kelly Bradbury, Wendy M. Calvin,
and Teng-fong Wong
doi:10.0/iodp.sd.s01..007
Introduction
The San Andreas Fault Observatory at Depth (SAFOD), drilled near the town of Parkfield, California (Fig. 1) (Hickman et al., 2004) as part of the U.S. National Science Foundation’s EarthScope Project (see http://www.earth-scope.org), provides a continuous set of samples through the active San Andreas Fault (SAF) zone. These samples can help address decades-old questions such as apparent weakness of the SAF (Zoback, 2000) providing the unparal-leled opportunity to constrain the parameters that controled opportunity to constrain the parameters that controld opportunity to constrain the parameters that control the behavior of plate bounding faults like the San Andreas.
Samples collected from SAFOD also complement studies of exhumed fault zones. While studies of exhumed fault zones have benefit from regionally extensive exposures thatregionally extensive exposures that extensive exposures that allow for detailed mapping and analyses (Chester and Chester, 1998; Evans and Chester, 1995), such studies also have inherent limitations including uncertainty about stress including uncertainty about stressincluding uncertainty about stressing uncertainty about stress uncertainty about stress states and styles of deformation (i.e., seismogenic vs. creeping). Moreover, mineral assemblages in exhumed fault, mineral assemblages in exhumed fault mineral assemblages in exhumed fault zones can be altered during exhumation, obscuring fault-related mineral assemblages and textures (Solum et al., 2003; Solum and van der Pluijm, 2004).
The SAFOD target zone contains two parallel strands that generate repeating M2 earthquakes in addition to having a component of creep (Nadeau et al., 2004). Therefore, SAFOD, SAFOD SAFOD also offers the opportunity to obtain samples from seismo-genic and aseismic faults and to constrain the rheology of theand to constrain the rheology of the to constrain the rheology of the active SAF system.
Samples Collected
Three types of samples were collected during drilling of the SAFOD main hole: rotary drill cuttings, spot cores, and: rotary drill cuttings, spot cores, androtary drill cuttings, spot cores, and percussive sidewall cores. A complete list of samples is available at: http://safod.icdp-online.org/.
The vast majority of samples collected to date are cuttings (>99% of the length of the hole). Two groups of rotary cuttings were collected at 3-m intervals over the entire length of the-m intervals over the entire length of them intervals over the entire length of the hole. One set was composed of unwashed cuttings (cuttings mixed with drilling mud collected as they come off the shaley come off the shale come off the shale shaker), while the other was composed of washed cuttings, which are equivalent to unwashed cuttings that were gently rinsed on-site to remove drilling mud.-site to remove drilling mud.site to remove drilling mud.
Three spot cores were collected following casing runs— one in a hornblende-biotite granodiorite at 1462–1470 m measured depth (MD), one in an arkose/siltstone at the bottom of the Phase I hole at 3056-3067 m MD, and one at the-3067 m MD, and one at the3067 m MD, and one at the bottom of the Phase II hole at 3990–3998 m MD. Fifty-two Fifty-twoFifty-two percussive side wall cores were collected from 3081–3953 m MD preceding casing of the Phase 2 hole in August 2005. Most of these samples were in siltstone/shale; however, two; however, two however, two, two two were in arkose.
Each type of sample has potential problems that must be addressed individually. For cuttings, these include loss of individually. For cuttings, these include loss of. For cuttings, these include loss of, these include loss of these include loss of formation clays during on-site washing; difficulty resolving thin features like thin beds or faults (since cuttings represent(since cuttings representsince cuttings representrepresent an average over a 3-m-long interval); mixing as cuttings); mixing as cuttings; mixing as cuttings travel from the drill bit to the surface; contamination of cuttings derived at the drill bit by borehole collapses ands and and abrades further up the hole; and contamination fromdes further up the hole; and contamination froms further up the hole; and contamination from materials from the drill string (e.g., steel shavings, paint) ore.g., steel shavings, paint) orsteel shavings, paint) or from drilling additives (e.g., nut plug). Problems associatede.g., nut plug). Problems associatednut plug). Problems associatedProblems associated with side wall cores include disruption of natural textures side wall cores include disruption of natural textures and inducement of fractures during the collection process; contamination of the core from drilling mud (as the tool(as the toolas the tool shoots through the borehole wall into the formation); and the); and the; and theand thethe potential that the core will sample the cuttings bed and notwill sample the cuttings bed and notsample the cuttings bed and not the formation. In addition, side wall cores can only be, side wall cores can only be side wall cores can only be collected from regions of the hole that are relatively in gauge, which can eliminate the sampling weak areas such as fault zones, that are prone to washouts. Side wall cores also, that are prone to washouts. Side wall cores also that are prone to washouts. Side wall cores also provide only a 2.5-cm snapshot of lithology. Drilling mud-cm snapshot of lithology. Drilling mudcm snapshot of lithology. Drilling mud
Figure 1. Location map of SAFOD. SAF denotes active surface trace of the San Andreas Fault.
SAFOD
SAF
U.S.A.
California
Part 3 : Fault Zone Structure, Composition, and Physical Properties
Scientific Drilling, Special Issue No.1, 2007
65
Part 3 : Fault Zone Structure, Composition, and Physical Properties
hole entered a series of mudrocks (Great Valley sequence) at 3158 m MD, which are separated from a mineralogically distinct series of Great Valley mudrocks by an actively creeping member of the SAF system that is causing casing deformation (Zoback et al., 2005). This formation extends to the bottom of the hole at 3998 m MD.
At least five major faults were crossed during drilling (Figs. 2 and 4), including an, including an including aning an an actively creeping member of the SAF system that is causing casing deformation at a depth of 3295–3313 m MD (Zoback et al., 2005). The creep occurs within a low-velocity zone interpreted as the damage zone of the active SAF (Zoback et al., 2005). Between 3322 m and m and 3353 m MD, this zone contains up to ~2 wt% serpentine,, this zone contains up to ~2 wt% serpentine, this zone contains up to ~2 wt% serpentine,, preliminarily identified as lizardite with minor chrysotile,, based on crystal morphologies, (Solum et al., submitted);, (Solum et al., submitted);(Solum et al., submitted);; however, given the limitations inherent in the use of cuttings,, given the limitations inherent in the use of cuttings, given the limitations inherent in the use of cuttings, the relationship of this serpentine to faulting cannot be defin-itively established until Phase III drilling in the summer ofIII drilling in the summer of drilling in the summer of 2007. Two major faults, one at 2545–2560 m MD and one at 3067 m MD, are clay-rich (>50 wt%) containing a neoformed, are clay-rich (>50 wt%) containing a neoformed are clay-rich (>50 wt%) containing a neoformed mixed-layer clay (Solum et al., submitted; Schleicher et al.,; Schleicher et al., Schleicher et al., 2006). The Buzzard Canyon Fault at 1926–1235 m MD is rich). The Buzzard Canyon Fault at 1926–1235 m MD is richFault at 1926–1235 m MD is richault at 1926–1235 m MD is rich in quartz and feldspars (>80 wt%) and contains relatively little clay (<3 wt%). These preliminary results highlight the contamination of side wall cores can be constrained using
XRD and SEM (Fig. 2). SEM characterizations of the side wall cores allow textures that are drilling-induced to be distinguished from natural textures. Spot cores present fewer analytical difficulties than rotary cuttings or side wall cores; however, spot cores sampled less than 0.5% of the; however, spot cores sampled less than 0.5% of the however, spot cores sampled less than 0.5% of the, spot cores sampled less than 0.5% of the spot cores sampled less than 0.5% of the length of the SAFOD main hole. It is therefore vital to place spot and side wall cores into a broader geologic context, and this must be done using analyses of rotary cuttings (Fig. 3).
Sample Mineralogies
The mineral assemblages of samples were characterized using x-ray diffraction (XRD) (Solum et al., submitted), optical microscopy (Almeida et al., 2005; Barton et al., 2005; Draper et al., 2005; Evans et al., 2005), infrared reflectance (IR) (Calvin and Solum, 2005), scanning electron microscopy (SEM) (Hickman et al., 2005) and transmission electron microscopy (TEM) on select spot core samples (Schleicher et al., 2006). A summary of cuttings and core mineralogy is2006). A summary of cuttings and core mineralogy is). A summary of cuttings and core mineralogy is shown in Fig. 2.. 2. 2.
Changes in mineralogy inferred from cuttings strongly correlate with geophysical logs (Solum et al., submitted), indicating that cuttings analyses reveal real lithologic bound-aries and faults. These changes define mineralogical zones that are likely fault-bounded.
After penetrating the sedimentary cover, the hole entered, the hole entered the hole entered Salinian granitic rocks. At 1926 m MD the hole crossed the Buzzard Canyon Fault (Rymer et al., 2003) and entered a series of arkosic sediments composed of an upper and a lower unit separated by a large fault at ~2560 m MD (Solum et al., submitted; Draper et al., in prep.), and containing a poten-tially active member of the SAF system at 3067 m MD. The
Figure 3. Major mineralogical zones of the SAFOD main hole as defined by XRD analyses of rotary cuttings. The mineralogies of spot and side wall cores are also shown.
1200
1400
1600
1800
2000
2200
2400
2600
2800
3000
3200
3400
3600
3800
0 25
D
e
p
th
(
m
M
D
)
Bt
Ill
0
Peak area (x10-3)
250 400 400 800 4000 15
Range of values
Mean ROTARY CUTTINGS
SIDEWALL CORE SPOT CORE
Chl
Lmt
Qtz
Feld
Hbl
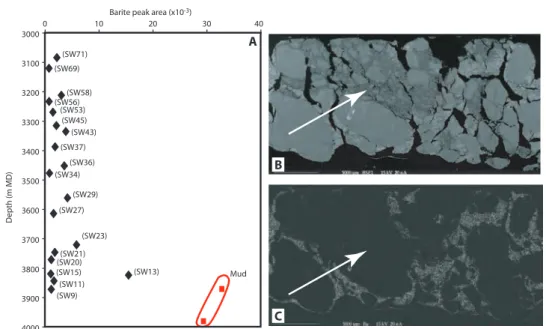
Figure 2. [A]. Relative barite concentrations in side wall cores from XRD patterns. Drilling mud samples are shown in red. [B] BSE image of SW61 (10461’ MD). [C] Barium scans of SW61. The breccia with the bright (barite-rich) matrix is drilling-related, while the breccia indicated by the white arrow is formation-related.
(SW71) (SW69)
(SW58) (SW56)
(SW53) (SW45) (SW43) (SW37)
(SW36) (SW34)
(SW29) (SW27)
(SW23) (SW21) (SW20)
(SW15) (SW13) (SW11)
(SW9) 3000
3100
3200
3300
3400
3500
3600
3700
3800
3900
4000
0 10 20 30 40
Barite peak area (x10-3)
D
e
p
th
(
m
M
D
)
Mud
A
66
Scientific Drilling, Special Issue No.1, 2007Part 3 : Fault Zone Structure, Composition, and Physical Properties
Part 3 : Fault Zone Structure, Composition, and Physical Properties
Conclusions
The ongoing studies briefly discussed here will help tohere will help toe will help to increase the understanding of the behavior of the active SAF. Further, comprehensive studies of all of the faults penetrated during drilling of SAFOD provide the opportunity to constrain the rheological, structural, and geochemical, and geochemical and geochemical evolution of this section of the SAF. Analyses of cuttings and Phase I and II cores define the broad geologic framework of the SAFOD area and will help guide the selection of targets for Phase III drilling in the summer of 2007.
References
Almeida, R., Chester, J.S., Chester, F.M., Kirschner, D.L., Waller,J.S., Chester, F.M., Kirschner, D.L., Waller,Chester, F.M., Kirschner, D.L., Waller,F.M., Kirschner, D.L., Waller,Kirschner, D.L., Waller,D.L., Waller,Waller, T.D., and Moore, D.E., 2005. Mesoscale structure andand Moore, D.E., 2005. Mesoscale structure and, D.E., 2005. Mesoscale structure and 2005. Mesoscale structure and. Mesoscale structure and Mesoscale structure and lithology of the SAFOD Phase 1 and II Core Samples.. Eos Trans. AGU, 86(52), Fall Meet. Suppl., Abstract T21A-0454. 86(52), Fall Meet. Suppl., Abstract T21A-0454.., Abstract T21A-0454., Abstract T21A-0454.. Barton, D., Bradbury, K.K., Solum, J.G., and Evans, J., 2005. StructuralK.K., Solum, J.G., and Evans, J., 2005. StructuralSolum, J.G., and Evans, J., 2005. StructuralJ.G., and Evans, J., 2005. Structuraland Evans, J., 2005. Structural, J., 2005. Structural 2005. Structural. Structural Structural
and lithologic characterization of the SAFOD pilot hole andlithologic characterization of the SAFOD pilot hole andithologic characterization of the SAFOD pilot hole andcharacterization of the SAFOD pilot hole andharacterization of the SAFOD pilot hole andpilot hole andilot hole andhole andole and phase one main hole.hase one main hole.one main hole.ne main hole.main hole.ain hole.hole.ole.. Eos Trans. AGU, 86(52), Fall Meet. 86(52), Fall Meet. Suppl., Abstract T21A-0451.., Abstract T21A-0451., Abstract T21A-0451.
Boness, N.L. and Zoback, M.D., 2006. A multiscale study of the, M.D., 2006. A multiscale study of the 2006. A multiscale study of the. A multiscale study of the A multiscale study of themultiscale study of theultiscale study of thescale study of thecale study of thestudy of thetudy of the mechanisms controlling shear velocity anisotropy in theechanisms controlling shear velocity anisotropy in thecontrolling shear velocity anisotropy in theontrolling shear velocity anisotropy in theshear velocity anisotropy in thehear velocity anisotropy in thevelocity anisotropy in theelocity anisotropy in theanisotropy in thenisotropy in the San Andreas Fault Observatory at Depth.. Geophysics, 71:131–146, doi:10.1190/1.2231107.–146, doi:10.1190/1.2231107.146, doi:10.1190/1.2231107.:10.1190/1.2231107.10.1190/1.2231107.
Calvin, W.M. and Solum, J.G., 2005. Drill hole logging with infrared, J.G., 2005. Drill hole logging with infrared 2005. Drill hole logging with infrared. Drill hole logging with infrared Drill hole logging with infraredhole logging with infraredole logging with infraredlogging with infraredogging with infraredinfrarednfrared spectroscopy.pectroscopy. Geothermal Resources Council Trans.., 29:565–:565–565– 568.
Chester, F.M. and Chester, J.S., 1998. Ultracataclasite structure and, J.S., 1998. Ultracataclasite structure and 1998. Ultracataclasite structure and. Ultracataclasite structure and Ultracataclasite structure and friction processes of the Punchbowl fault, San Andreas system, California. Tectonophysics, 295:199–221, doi:10.1016/ 295:199–221, doi:10.1016/:199–221, doi:10.1016/199–221, doi:10.1016/ S0040-1951(98)00121-8.
Draper, S.A., Boness, N.L., and Evans, J.P., 2005. Source and signifi-, J.P., 2005. Source and signifi- 2005. Source and signifi-. Source and signifi- Source and signifi-cance of the sedimentary rocks in the SAFOD borehole: Preliminary analysis,analysis,nalysis, Eos Trans. AGU, 86(52), Fall Meet. 86(52), Fall Meet.. Suppl., Abstract T24B-02.., Abstract T24B-02., Abstract T24B-02.
Evans, J., Moore, D., Kirschner, D., and Solum, J.G., 2005. LithologicSolum, J.G., 2005. Lithologic. Lithologic Lithologic characterization of the deep portion of the SAFOD drillharacterization of the deep portion of the SAFOD drilldeep portion of the SAFOD drilleep portion of the SAFOD drillportion of the SAFOD drillortion of the SAFOD drilldrillrill hole.. Eos Trans. AGU, 86(52), Fall Meet. Suppl., Abstract 86(52), Fall Meet. Suppl., Abstract. Suppl., Abstract Suppl., Abstract., Abstract, Abstract T21A-0450.
Evans, J.P. and Chester, F.M., 1995. Fluid-rock interaction in faults of, F.M., 1995. Fluid-rock interaction in faults of 1995. Fluid-rock interaction in faults of. Fluid-rock interaction in faults of Fluid-rock interaction in faults of the San Andreas system; inferences from San Gabriel Fault rock geochemistry and microstructures.. J. Geophys. Res., 100:13007–13020, doi:10.1029/94JB02625.:13007–13020, doi:10.1029/94JB02625.13007–13020, doi:10.1029/94JB02625.
Hickman, S., Solum, J., Moore, D., Chester, J., Guillemette, R., Draper,J., Moore, D., Chester, J., Guillemette, R., Draper,Moore, D., Chester, J., Guillemette, R., Draper,D., Chester, J., Guillemette, R., Draper,Chester, J., Guillemette, R., Draper,J., Guillemette, R., Draper,Guillemette, R., Draper,R., Draper,Draper, S., Tembe, S., Boness, N., and Summers, R., 2005.Tembe, S., Boness, N., and Summers, R., 2005.S., Boness, N., and Summers, R., 2005.Boness, N., and Summers, R., 2005.N., and Summers, R., 2005.and Summers, R., 2005., R., 2005. 2005.. Photographs and scans of SAFOD phase 2 sidewall sores,scans of SAFOD phase 2 sidewall sores,cans of SAFOD phase 2 sidewall sores,phase 2 sidewall sores,hase 2 sidewall sores,sidewall sores,idewall sores,sores,ores, SAFOD phase 2 sample party, Menlo Park, Calif., U.S.A.,phase 2 sample party, Menlo Park, Calif., U.S.A.,hase 2 sample party, Menlo Park, Calif., U.S.A.,sample party, Menlo Park, Calif., U.S.A.,ample party, Menlo Park, Calif., U.S.A.,party, Menlo Park, Calif., U.S.A.,arty, Menlo Park, Calif., U.S.A.,alif., U.S.A.,., U.S.A.,, U.S.A., h t t p : //g e ow e b . t a m u . e d u / Fa c u l t y/c h e s t e r j /s a f o d / products/Phase_2_Sidewall_Cores.ppt
Hickman, S., Zoback, M., and Ellsworth, W., 2004. Introduction toM., and Ellsworth, W., 2004. Introduction toand Ellsworth, W., 2004. Introduction to, W., 2004. Introduction to 2004. Introduction to. Introduction to Introduction to special section: Preparing for the San Andreas Fault Observatory at Depth.. Geophys. Res. Lett., 31:L12S01,:L12S01,L12S01, doi:10.1029/2004GL020688.
compositional and rheological heteroge-neity of the faults of the SAF system at SAFOD.
Alteration phases such as clays, zeolites, and some feldspars may record alteration by fluids that were confined by sealing faults. In addition, Kirschner et al. (2005) found that the stable isotopic composition of carbonates plucked from cuttings at 3100–at 3100– 3100– 3950 m MD fell into two partially overlapping popula-tions. One occurred more frequently in fault zones, while the other occurred more frequently in protolith. This suggests that in the region of SAFOD faults are tapping a fluid reservoir that is not seen in the protolith.
Constraining the frictional properties of the SAF is a key objective of SAFOD. Tembe et al. (2005). (2005) (2005)2005)) showed that cuttingsed that cuttingsthat cuttings preserve meaningful information about the frictional properties of the rocks penetrated during drilling, with faults generally weaker than adjacent protolith (µ=0.40–0.55 vs.0–0.55 vs.–0.55 vs. µ=0.55–0.80). Plucked grains of clay-rich0). Plucked grains of clay-rich). Plucked grains of clay-rich fault rocks from 2556 m MD have µ=0.33, while bulk samples from that depth have µ≈0.45. This indicates that analyses of bulk samples provide an upper bound on the coefficient of friction, and that the properties of fault rocks can be better constrained by plucking grains of fault rocks from bulk cuttings. Analyses of plucked fault rocks from the section of the hole that contains the actively creeping fault are ongoing.
Figure 4. Coefficients of friction for samples from the SA FOD hole ( Tembe et al., submitted). Average fault rock mineral assemblages are shown at right (Solum et al., in review). Lithologies are from Boness and Zoback (2006).
Bulk
Plucked
Feldspars Quart z Chlorit e I llit e I - S Calcit e Laum ont it e Serpent ine
Clay Fract ion
1926- 1935 m MD
2545- 2560 m MD
3067 m MD
3310- 3353 m MD
D
e
p
th
(
m
M
D
)
3800 3600 3400 3200 3000 2800 2600 2400 2200 2000 1800 1600
4000
Ave. Flt. Min.
Granodiorite
Sandstone Shale
Siltstone
Fault (active) Fault
0.0 0.2 0.4 0.6 0.8 1.0
Friction
Part 3 : Fault Zone Structure, Composition, and Physical Properties
Scientific Drilling, Special Issue No.1, 2007
67
Part 3 : Fault Zone Structure, Composition, and Physical Properties
Kirschner, D., Evans, J., Chester, J., Chester, F., Solum, J.G., andand Moore, D.E., 2005. Elemental and stable isotope chemistry. Elemental and stable isotope chemistry Elemental and stable isotope chemistry of cuttings and core samples from SAFOD drill hole.. Eos Trans. AGU, 86(52), Fall Meet. Suppl., Abstract T21A-0452. 86(52), Fall Meet. Suppl., Abstract T21A-0452.. Suppl., Abstract T21A-0452. Suppl., Abstract T21A-0452.., Abstract T21A-0452., Abstract T21A-0452. Nadeau, R.M., Michelini, A., Urhammer, R.A., Dolenc, D., andA., Urhammer, R.A., Dolenc, D., andUrhammer, R.A., Dolenc, D., andR.A., Dolenc, D., andDolenc, D., andD., andand
McEvilly, T.V., 2004. Detailed kinematics, structure and, T.V., 2004. Detailed kinematics, structure and 2004. Detailed kinematics, structure and. Detailed kinematics, structure and Detailed kinematics, structure and recurrence of microseismicity in the SAFOD target region.. Geophys. Res. Lett., 31:L12S08, doi:10.1029/2003GL019409.:L12S08, doi:10.1029/2003GL019409.L12S08, doi:10.1029/2003GL019409. Rymer, M.J., Catchings, R.D., and Goldman, M.R., 2003. Structure ofR.D., and Goldman, M.R., 2003. Structure ofand Goldman, M.R., 2003. Structure of, M.R., 2003. Structure of 2003. Structure of. Structure of Structure of
the San Andreas Fault zone as revealed by surface geologic mapping and high-resolution seismic profiling near Parkfield, California.. Geophys. Res. Abs., 5:13523.:13523.13523.
Schleicher, A.M., van der Pluijm, B.A., Solum, J.G., and Warr, L.N.,B.A., Solum, J.G., and Warr, L.N.,Solum, J.G., and Warr, L.N.,J.G., and Warr, L.N.,and Warr, L.N.,, L.N., 2006. The origin and significance of clay minerals on. The origin and significance of clay minerals on The origin and significance of clay minerals onThe origin and significance of clay minerals onhe origin and significance of clay minerals on surfaces, in fractures and in veins from SAFOD borehole samples (Parkfield, California).. Geophys. Res. Lett., 33: 33:: L16313, doi:10.1029/2006GL026505.
Solum, J.G. and van der Pluijm, B.A., 2004. Phyllosilicate mineral, B.A., 2004. Phyllosilicate mineral 2004. Phyllosilicate mineral. Phyllosilicate mineral Phyllosilicate mineral assemblages of the SAFOD Pilot Hole and comparison with an exhumed segment of the San Andreas Fault System. Geophys. Res. Lett., 31:L15S19, doi:10.1029/2004GL01990.:L15S19, doi:10.1029/2004GL01990.L15S19, doi:10.1029/2004GL01990.. Solum, J.G., Hickman, S.H., Lockner, D.A., Moore, D.E., van der
Pluijm, B.A., Schleicher, A.M., and Evans, J.P., 2006.and Evans, J.P., 2006.Evans, J.P., 2006., 2006. 2006.. Mineralogical characterization of protolith and fault rocks from the SAFOD main hole.. Geophys. Res. Lett., 33:L21314,:L21314,L21314, doi:10.1029/2006GL027285.
Solum, J.G., van der Pluijm, B.A., Peacor, D.R., and Warr, L.N., 2003.B.A., Peacor, D.R., and Warr, L.N., 2003.Peacor, D.R., and Warr, L.N., 2003., D.R., and Warr, L.N., 2003. and Warr, L.N., 2003., L.N., 2003. 2003.. The influence of phyllosilicate mineral assemblages, fabrics, and fluids on the behavior of the Punchbowl Fault, southern California.. J. Geophys. Res., 108:2233,:2233,2233, doi:10.1029/doi:10.1029/doi:10.1029/ 2002JB001858.
Tembe, S., Lockner, D.A., Solum, J.G., Morrow, C., Wong, T.-f., andD.A., Solum, J.G., Morrow, C., Wong, T.-f., andSolum, J.G., Morrow, C., Wong, T.-f., andJ.G., Morrow, C., Wong, T.-f., andMorrow, C., Wong, T.-f., andC., Wong, T.-f., andWong, T.-f., andT.-f., andand Moore, D.E., 2005. Frictional strength of the San Andreas, D.E., 2005. Frictional strength of the San Andreas 2005. Frictional strength of the San Andreas. Frictional strength of the San Andreas Frictional strength of the San Andreas fault zone: Insight from SAFOD cuttings and core.. Eos Trans. AGU, 86(52), Fall Meet. Suppl., Abstract T24B-03.. Suppl., Abstract T24B-03. Suppl., Abstract T24B-03.., Abstract T24B-03., Abstract T24B-03. Zoback, M.D., Hickman, S., and Ellsworth, W., 2005. Overview ofS., and Ellsworth, W., 2005. Overview ofand Ellsworth, W., 2005. Overview of, W., 2005. Overview of 2005. Overview of. Overview of Overview of
SAFOD Phases 1 and 2: Drilling, sampling and measure-ments in the San Andreas Fault zone at seismogenic depth.. Eos Trans. AGU, 86(52), Fall Meet. Suppl., Abstract T23E-01.
Zoback, M.D., 2000. Strength of the San Andreas fault., 2000. Strength of the San Andreas fault. 2000. Strength of the San Andreas fault.. Strength of the San Andreas fault. Strength of the San Andreas fault.. Nature, 405:31–32.:31–32.31–32.
Related Web Links
http://www.earthscope.org http://safod.icdp-online.org
Authors
John G. Solum, U.S. Geological Survey, Earthquake
Hazards Team, 345 Middlefield Road, Mail Stop 977, Menlo Park, Calif., U.S.A., (currently) Sam Houston State University,U.S.A., (currently) Sam Houston State University,(currently) Sam Houston State University, Department of Geography and Geology, Huntsville, Texasas 77341, U.S.A., e-mail: jsolum@usgs.gov.
Stephen Hickman, U.S. Geological Survey, Earthquake
Hazards Team, 345 Middlefield Road, Mail Stop 977, Menlo Park, Calif., U.S.A.
Workshop Reports
David. A. Lockner, U.S. Geological Survey, Earthquake
Hazards Team, 345 Middlefield Road, Mail Stop 977, Menlo Park, Calif., U.S.A.
Sheryl Tembe, Department of Geosciences, 255 Earth and
Space Sciences Building (ESS), Stony Brook University, Stony Brook N.Y. 11794-2100, U.S.A.
Jim P. Evans, Department of Geology, Utah State University,
Logan, Utah 84322-4505, U.S.A.
Sarah D. Draper, Department of Geology, Utah State
University, Logan, Utah 84322-4505, U.S.A.
D.C. Barton, Department of Geology, Utah State University,
Logan, Utah 84322-4505, U.S.A.
David L. Kirschner, Department of Earth and Atmospheric
Sciences, Saint Louis University, Verhaegen Hall, 3634 Lindell Boulevard, Suite 117, St. Louis, Mo. 63103, U.S.A.levard, Suite 117, St. Louis, Mo. 63103, U.S.A.evard, Suite 117, St. Louis, Mo. 63103, U.S.A.
Judith S. Chester, Room 228, Department of Geology and
Geophysics, Texas A&M University, College Station, Texasas 77843-3115, U.S.A.
Frederick M. Chester, Department of Geology and
Geophysics, M.T. Halbouty Building, Room 153, Texas A&M Halbouty Building, Room 153, Texas A&MHalbouty Building, Room 153, Texas A&M University, College Station, Texas 77843-3115, U.S.A.as 77843-3115, U.S.A. 77843-3115, U.S.A.
Ben A. van der Pluijm, Department of Geological Sciences,
University of Michigan, 4534B C.C. Little Building, 1100 North University Avenue, Ann Arbor, Mich. 48109-1005,nue, Ann Arbor, Mich. 48109-1005,, Ann Arbor, Mich. 48109-1005, U.S.A.
Anja M. Schleicher, Department of Geological Sciences,
University of Michigan, 2534 C.C. Little Building, 1100 North University Avenue, Ann Arbor, Mich. 48109-1005, U.S.A.nue, Ann Arbor, Mich. 48109-1005, U.S.A., Ann Arbor, Mich. 48109-1005, U.S.A.
Diane E. Moore, U.S. Geological Survey, Earthquake
Hazards Team, 345 Middlefield Road, Mail Stop 977, Menlo Park, Calif., U.S.A.
Carolyn Morrow, U.S. Geological Survey, Earthquake
Hazards Team, 345 Middlefield Road, Mail Stop 977, Menlo Park, Calif., U.S.A.
Kelly Bradbury, Department of Geology, Utah State
University, Logan, Utah 84322-4505, U.S.A.
Wendy M. Calvin, Department of Geological Sciences,
University of Michigan, 4534B C.C. Little Building, 1100 North University Avenue, Ann Arbor, Mich. 48109-1005,nue, Ann Arbor, Mich. 48109-1005,, Ann Arbor, Mich. 48109-1005, U.S.A., (currently) Department of Geology and Engineering, Mail Stop 172, University of Nevada, Reno, 1664 Northorth Virginia Street, Reno, Nev. 89557-0138, U.S.A.reet, Reno, Nev. 89557-0138, U.S.A., Reno, Nev. 89557-0138, U.S.A.
Teng-fong Wong, Department of Geosciences, 255 Earth
and Space Sciences Building (ESS), Stony Brook University, Stony Brook N.Y. 11794-2100, U.S.A.