Optimization of Invasion-Specific Effects of
Betulin Derivatives on Prostate Cancer Cells
through Lead Development
Ville Härmä1☯, Raisa Haavikko2☯, Johannes Virtanen1, Ilmari Ahonen3,
Hannu-Pekka Schukov4, Sami Alakurtti5, Enkhee Purev1,6, Heiko Rischer7, Jari Yli-Kauhaluoma2,
Vânia M. Moreira2‡, Matthias Nees1,3‡*, Kirsi-Marja Oksman-Caldentey7‡*
1Industrial Biotechnology, VTT Technical Research Centre of Finland Ltd, Turku, Finland,2Division of Pharmaceutical Chemistry and Technology, Faculty of Pharmacy, University of Helsinki, Helsinki, Finland, 3Turku Centre for Biotechnology BTK, University of Turku, Turku, Finland,4University of Turku, Faculty of Medicine, Institute of Biomedicine, Turku, Finland,5Process Chemistry and Environmental Engineering, VTT Technical Research Centre of Finland Ltd, Espoo, Finland,6National University of Mongolia, Ulanbataar, Mongolia,7Industrial Biotechnology, VTT Technical Research Centre of Finland Ltd, Espoo, Finland
☯These authors contributed equally to this work. ‡These authors also contributed equally to this work. *kirsi-marja.oksman@vtt.fi(KMOC);mattnees@btk.fi(MN)
Abstract
The anti-invasive and anti-proliferative effects of betulins and abietane derivatives was sys-tematically tested using an organotypic model system of advanced, castration-resistant prostate cancers. A preliminary screen of the initial set of 93 compounds was performed in two-dimensional (2D) growth conditions using non-transformed prostate epithelial cells (EP156T), an androgen-sensitive prostate cancer cell line (LNCaP), and the castration-re-sistant, highly invasive cell line PC-3. The 25 most promising compounds were all betulin derivatives. These were selected for a focused secondary screen in three-dimensional (3D) growth conditions, with the goal to identify the most effective and specific anti-invasive com-pounds. Additional sensitivity and cytotoxicity tests were then performed using an extended cell line panel. The effects of these compounds on cell cycle progression, mitosis, prolifera-tion and unspecific cytotoxicity, versus their ability to specifically interfere with cell motility and tumor cell invasion was addressed. To identify potential mechanisms of action and like-ly compound targets, multiplex profiling of compound effects on a panel of 43 human protein kinases was performed. These target de-convolution studies, combined with the phenotypic analyses of multicellular organoids in 3D models, revealed specific inhibition of AKT signal-ing linked to effects on the organization of the actin cytoskeleton as the most likely driver of altered cell morphology and motility.
OPEN ACCESS
Citation:Härmä V, Haavikko R, Virtanen J, Ahonen I, Schukov H-P, Alakurtti S, et al. (2015) Optimization of Invasion-Specific Effects of Betulin Derivatives on Prostate Cancer Cells through Lead Development. PLoS ONE 10(5): e0126111. doi:10.1371/journal. pone.0126111
Academic Editor:Ming Tat Ling, Queensland University of Technology, AUSTRALIA
Received:February 3, 2015
Accepted:March 23, 2015
Published:May 12, 2015
Copyright:© 2015 Härmä et al. This is an open access article distributed under the terms of the
Creative Commons Attribution License, which permits unrestricted use, distribution, and reproduction in any medium, provided the original author and source are credited.
Data Availability Statement:All relevant data are within the paper and its Supporting Information files.
Introduction
Apart from skin cancer, prostate cancer (PrCa) is the most common cancer in men, especially in Europe. PrCa is typically hormone-dependent and the role of androgens in the progression from androgen-dependent to hormone-refractory PrCa is well established [1]. Early-stage PrCa can be successfully managed by operation alone and recurrent tumors are treated by abla-tion of circulating androgens by chemical castraabla-tion. In contrast, late-stage castraabla-tion-resistant PrCa (CRPC) with characteristic metastatic dissemination of the primary tumor, usually to the bone, remains the major cause of cancer-associated death. Although significant progress has been made in the treatment of primary and androgen-sensitive prostate tumors, curative thera-pies that specifically target the metastatic spread of advanced and aggressive CRPC currently do not exist. Partly, this is related to the lack of experimental model systems that faithfully rep-resent the features of invasiveness and cell motilityin vitroorin vivo.
Neither standard two-dimensional (2D) cell culture models (cell lines) nor animal models (mouse xenografts) accurately represent the full complexity of clinical tumors. 2D models par-ticularly lack the tumor microenvironment (TME), the extracellular matrix (ECM), and stro-mal cell types. Such models only poorly correspond with drug sensitivity observedin vivo[2]. These functional shortcomings of pre-clinical drug discovery are reflected by the high attrition rates for cancer drugs (>95%) [3] in subsequent clinical studies. Thus, biologically more rele-vantin vitrotumor models need to be developed to improve productivity of drug discovery and reduce the number of animals required in drug development [4]. ECM preparations from different origins have proven particularly critical to investigate cell-cell interactions and differ-entiation in 3D culture [5]. Integrated, robust and standardized 3D platforms have become compatible for both high-throughput (HTS) and high-content screening (HCS) settings [2], and the efficient translation of 3D cell culture methods from basic research to industrial appli-cations is ongoing [6]. Biologically relevant ECM such as collagens or laminin-rich basement membrane extracts like Matrigel are now widely used to study cellular mechanisms such as cell motility and invasion. The spectrum of multicellular morphologies formed by prostate epitheli-al and cancer cells in 3D cultures ranges from fully functionepitheli-al glandular acini, dysfunctionepitheli-al tumor spheroids; to invasive stellate structures [7,8] that lack most differentiated properties. Thus, the different morphology manifested in 3D lrECM culture is a solid indicator that corre-lates with various stages of malignant progression. Such biomimetic 3D cell models provide a powerful means to quantify cancer-related biological processes. Invasion and metastasis are the most critical hallmarks of cancer that can transform localized cancer into a life-threatening dis-ease [9]. In 3D culture, tumor cell invasion is manifested either by single cells or cell aggregates that actively invade the surrounding ECM, using different modes of motility (e.g. amoeboid or collective invasion) [10]. PC-3 is one of the few PrCa cell lines that displays collective invasion characteristics bothin vitroandin vivo[7,11]. Such complex multicellular processes cannot be reproduced in anchorage-independent, non-adherent 3D systems that lack biologically func-tional ECM, such as poly-HEMA [12], soft agar [13] or“hanging-drop”cultures of isolated spheroids [14]. A recent study showed that gene expression profiles of breast cancer cells cul-tured in 3D lrECM were much closer toin vivothan monolayer or poly-HEMA cultures [15]. High content screens (HCS) using lrECM-based platforms have been reported for prostate [16], breast [15], pancreatic [17], and ovarian cancers [18]. Such thoroughly standardized and miniaturized tissue-like models are required to systematically capture the effects of small mole-cule compounds/drugs, siRNAs, biological (e.g. antibodies and peptides), growth factors, or toxins on tumor biology. These complex biomimetic approaches are useful as faithful pre-clini-cal tools for investigating short- and long-term drug responses, therapy failure, or development of drug resistance [19]. Combined with high-content microscopic imaging and image-analysis Competing Interests:The authors have declared
methods, 3D phenotypic models can also be highly informative for lead discovery and lead optimization studies (LD or LO, respectively), in particular if the molecular drug target is un-known, and complex mechanisms such as tissue-specific differentiation, and cell-cell-interac-tions can be assessed based on unbiased, multiparametric read-out. Multiplexing of imaging-based readout also enables the simultaneous assessment of cytotoxicity, apoptosis, and effects on the cell cycle, e.g. by using appropriate fluorescent probes [2,20], thus reducing the need for excessive validation studies. In addition, real-time and live cell 3D assays based on high-con-tent image analysis can be combined with endpoint studies addressing the expression of bio-markers, as described in previous publications [7,11].
Natural products (NPs) have been invaluable as tools for deciphering the logic of biosynthe-sis and as starting materials for developing front-line drugs [21]. Indeed, the majority of new chemical entities approved as drugs by the US Food and Drug Administration (FDA) have consistently been either NPs or NP-derived compounds [22]. The pentacyclic triterpenoids, secondary plant metabolites abundantly found in fruit peel, leaves and stem bark, have at-tracted great interest as therapeutic agents and dietary supplements [23,24]. In addition, semi-synthetic derivatives of the naturally occurring triterpenoids have been actively studied in search for new anticancer agents, with specific focus on anti-invasiveness properties [24–29]. Betulin and betulinic acid are lupane-type pentacyclic triterpenes abundant in the bark of birch species of the genusBetulaL. [30]. Betulinic acid and other betulin derivatives have antiviral, anti-inflammatory, anti-malarial, and anti-cancer effects [31]. In addition, betulinic acid was identified as a selective inducer of apoptosis in melanoma cells [32], triggering a strong interest in triterpenes as anticancer agents. Moreover, betulin was found to block the invasive proper-ties of brain and lung cancer cells, well below its cytotoxic concentration, suggesting a promis-ing chemopreventive effect against metastases [33]. In the present study, we have used a combination of 2D and 3D PrCa cell models and HCS methods based on imaging and auto-mated image analysis, to assess and validate the antineoplastic and anti-invasive properties of a library of 93 compounds. In this library, we have included the parental compounds betulin, betulinic acid (2) and their semi-synthetic derivatives, and compounds from another class of terpenoids with less studied biological effects, the abietanes. Overall, the library comprised 78 betulins and 15 abietanes.
Results and Discussion
Synthesis of a library of betulin and abietane derivatives
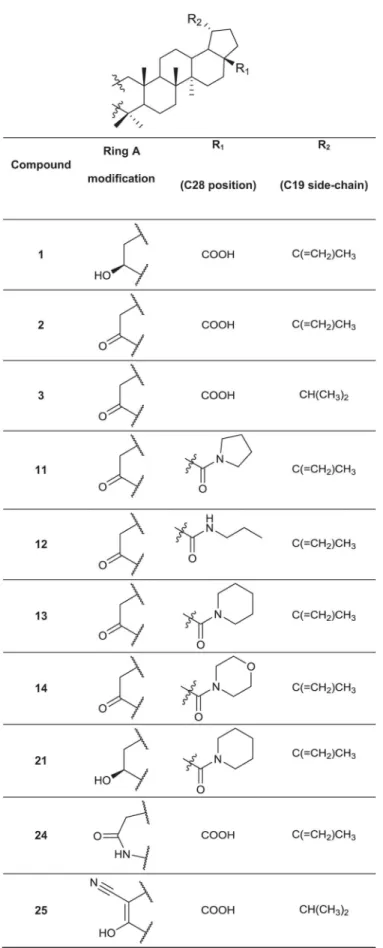
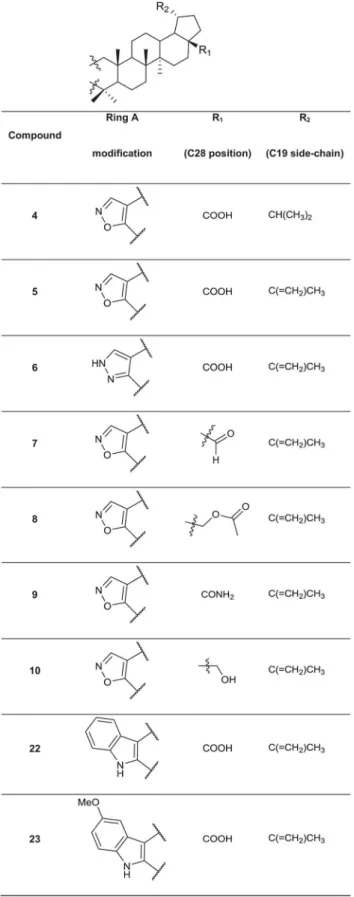
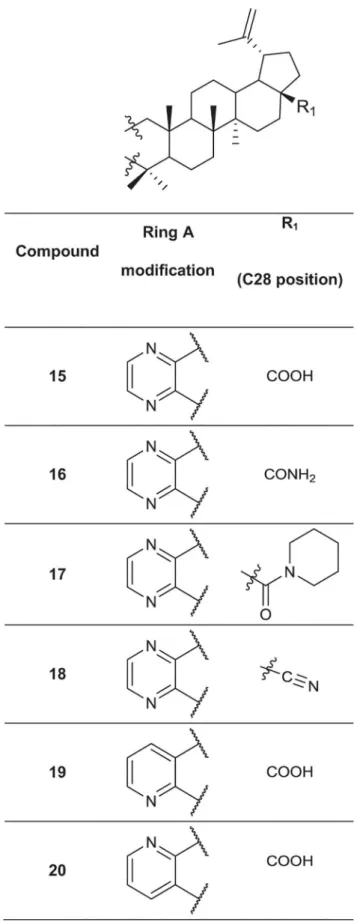
A set of 76 betulin derivatives was prepared starting from betulin and betulinic acid (1), where-as 13 derivatives were prepared from dehydroabietic acid and dehydroabietylamide (Figs1–3, see alsoS1 File), using our expertise on natural products chemistry and following either our previously reported procedures or those of others [34–37]. Betulonic acid (2) was obtained from betulin by Jones oxidation, and used as a versatile intermediate for chemical syntheses. Different substituents were inserted into the positions 3 and 28 of the lupane core. Some deriv-atives were also prepared by fusing heterocycles to ring A, at positions 2 and 3. Other com-pounds contained one extra ring fused to rings C, D and E. Reduction of the isoproprenyl side chain of the triterpene core was done for some of the derivatives. Side-chain rearrangement re-sulted also in germanicane-type compounds. In the abietanes set the compounds prepared con-sisted mostly of urea and amide derivatives.
High Throughput Screening (HTS) for bioactivity
Fig 1. Chemical structures of the parental compound betulinic acid and its derivatives.
Fig 2. Chemical structures of the fused 5-membered ring derivatives of betulinic acid.
Fig 3. Chemical structures of the fused 6-membered ring derivatives of betulinic acid.
used were EP156T (non-transformed prostate epithelium), LNCaP (androgen sensitive PrCa), and PC3 (castration-resistant, invasive PrCa). The experiments were performed in three differ-ent compound concdiffer-entrations (0.1, 1 and 10μM) in triplicate, using CellTiterGlo as an end-point read-out for cell proliferation. A panel of 25 betulin derivatives was synthesized accord-ing to the most effective and cancer-specific compounds identified in the preliminary 2D screen, and selected for further studies.
High Content Screening (HCS) for invasion-blocking activity
Next, these 25 most effective compounds were tested in 3D settings for specific anti-invasive properties. Three standard of care compounds widely used against PrCa were added as con-trols; namely, the androgen receptor antagonist enzalutamide (MDV3100), the C17α -hydroxy-lase/C17,20-lyase inhibitor abiraterone (Zytiga), and the classic mitotic inhibitor paclitaxel.
Treatments started at day 4, when well-differentiated round acini were established. Compound exposure was then continued for six days, when most of the untreated multicellular structures had transformed into a highly invasive phenotype.
Automated morphometric image analysis (AMIDA) and statistical
evaluation
The live 3D cell cultures were then stained with reactive dyes Calcein AM to detect living, and ethidium homodimer to detect dead cells. Images (Fig 4A) were acquired with confocal micro-scope and image data were analyzed with the AMIDA software [38]. The principles of morpho-metric image analysis are briefly outlined inS2 Fig.
Fig 4Ashows representative confocal microscope images for some of the betulin derivatives. The highly effective, antimitotic control drug paclitaxel stood out even at very low concentra-tions (30 and 100 nM), showing a strong effect on all morphometric measures (Fig 4B): this re-sulted in smaller (reduced area), less invasive organoids (reduced complexity), with increased numbers of dead cells. The control compounds abiraterone and enzalutamide had no notice-able effect on PC-3 cells. Interestingly,betulinic acid(1) andbetulonic acid(2) did not show significant anti-invasive effects, whereas compound3, bearing an isopropyl substituent at C19, was one of the most potent anti-invasive, growth inhibitory agents. Similarly, the isoxazole de-rivatives4and5displayed strong growth inhibiting and anti-invasive effects at lower concen-trations (as low as 100 nM for4and 300 nM for5). All of these effective compounds differ only at position C19: compound4has an isopropyl side-chain, while compound5has the orig-inal isopropenyl side-chain. Furthermore, when the isoxazole ring of5was replaced with a pyr-azole ring, the resulting compound6was even more potent and proved to be specifically anti-invasive. In contrast, the isoxazole derivatives with a formyl (7) or an acetoxy group (8), a pri-mary amide (9) or a hydroxy (10) group at position C28 displayed negligible effects on the in-vasive phenotype. The relevance of the original carboxyl group at position C28 (betulonic acid,
both compounds19and20were potently anti-invasive at significantly lower concentrations, compared to compound15.
Next, statistical analyses were performed to interpret the complex image data (Fig 4B and 4C). For simplicity, we focused on only three, basic morphologic parameters from the multi-parametric AMIDA readout (Fig 4B): 1)Area(indicating growth of organoids), 2) structural
Complexity(as a measure of the intensity of invasion), and 3)Relative Areaof dead cells
with-in organoids (red signal as a measure of cytoxicity or apoptosis).Area(Size of organoids;Fig 4B, upper panel) was measured as the number of pixels within a segmented structure. The loga-rithmic transformation of Area/Size data was used, which showed a close to Gaussian (normal) distribution within the images. ShapeComplexity(Fig 4B, middle panel) was obtained using the structure size (area) and perimeter (number of border pixels). The more regular the shape of an organoid, the closer it is to a perfect circle, thus minimizing the perimeter relative to ob-ject size. We observed a close to linear dependency between log(Area) and log(Perimeter), indi-cating a natural (functional) relationship between these two features. Fitting a regression line to the data resulted in a useful estimate of the average perimeter of any organoid structure. De-viations from this average (residuals) were interpreted as a measure for the shape complexity of organoids. As a logical lower limit for this measure (represented by a perfect circle), we adjust-ed the intercept (height level) of the regression line to render all returnadjust-ed residuals as positive numbers. This simplified, rapid measure of the multicellular complexity indicated that the log-arithm of residuals results in an almost symmetrical distribution of values. Hierarchical cluster-ing, using these three basic measures from PC3 cultures yielded a simple dendrogram with two main branches: the first cluster included the most potent anti-proliferative and anti-invasive compounds (Fig 4C: yellow). The second cluster represents weak (Fig 4C: red) and non-effec-tive (Fig 4C: grey) compounds.
Validation of anti-invasive properties
Based on the primary screen, we selected six betulin derivatives for further validation of the anti-invasive effects by additional methods. In a standard wound healing assay performed in monolayer 2D culture, the efficacy of some compounds was strikingly different to 3D settings. For example, compounds4,and20completely reduced invasion in 3D already at 300 nM, re-spectively (Fig 4A), but showed only 50% reduction of wound closure after 64 hours (Fig 4D) at the same concentration. Also, compound5effectively inhibited invasive transformation of PC-3 spheroids already at 300 nM in 3D (S3A Fig),measured as“% roundness”retained after 10 days), but concentrations higher than 1μM were required in 2D culture for comparable ef-fects (S3B Fig). Also the most potent anti-invasive agents6,16and19(active at 100 nM in 3D conditions) reduced wound closure in 2D only by 50% at 3μM and 1μM, respectively (S3B Fig). Compound21is included here as an example for inactive derivatives. The fact that many compounds lacked the same potency in the conventional 2D monolayer culture suggests that the biological targets or pathways involved in cell motility are not equally active in cell migra-tion on plastic surfaces. It is also likely that cell motility in 2D monolayer culture is controlled by other mechanisms than collective invasion in a 3D scaffold.
Fig 4. Primary 3D screen.PC-3 cells were cultured in 3D Matrigel ECM for 4 days and treated for 6 days with 25 betulin derivatives (from 2D high
throughput screens), DMSO/vehicle control, and three reference compounds. A) Representative maximum intensity projections of confocal microscope stack images for selected compound treatments at 300 nM concentration (5× objective, scale 100μm). B) Three graphs showing the relative impact on three morphometric parameters for 7 betulin derivatives, DMSO control, and one control compound (paclitaxel). Data scaling: displays the relative difference between median of Area/Complexity/Area Ratio, to DMSO control. Paclitaxel treatments and DMSO controls have been assigned values of -100 and 0, respectively. C) Hierarchical clustering was done using three morphological parameters derived from PC3 organoids: spheroid size (area), complexity and the number of dead cells. D) Wound healing curves of the two betulin derivatives4and20, highlighting the 50% cut-off level (orange dashed line).
Secondary 3D screens. Next, the 25 selected betulin derivatives depicted inFigs1–3
in-cluding control compounds were again thoroughly tested across the same panel of prostate-de-rived cell lines already used in the preliminary, 2D high-throughput screen. The resulting dendrograms were either generated separately for each cell line (S4 Fig), combined into a single dendrogram (Fig 5A), or shown as reduced organoid sizes (area;Fig 5B). In the non-invasive, but hormone-sensitive LNCaP organoids, most compound effects were relatively mild. Non-ef-fective treatments comprise the vast majority of the graph (S4 Fig: grey), while the few effective compounds fall into two connected branches (yellow and red). As expected, the androgen an-tagonist enzalutamide but not abiraterone were among the effective treatments. Paclitaxel clus-ters together with betulin derivatives at higher concentrations—these compounds were also effective on hormone resistant, invasive PC-3 cells. The dendrogram for hormone dependent, non-invasive LAPC-4 (S4B Fig) again demonstrates the efficacy of all positive controls (abira-terone, enzalutamide and paclitaxel; within yellow and red clusters). The most active betulin derivatives again fall inside these same clusters (3, 4, 6, 16, 19 and 20) adjacent to positive con-trols. In contrast to PrCa cell lines, the non-transformed, normal-like Ep156T cell line (S4C Fig) also responded to betulonic acid (2), at least at the highest concentration. In general, as with LNCaP and LAPC4 cells, the effects on Ep156T growth were mild (Fig 5B).
In order to assist functional categorization of our betulin derivatives, we combined all data into a single dendrogram, shown inFig 5A. In addition, multiparametric representation of all experimental data as a single heatmap is highly informative (S5 Fig) and a potent way to illus-trate the effects of compounds on growth, structural complexity and cell death across multiple cell lines. We divided the compounds and controls into three clusters: 1) growth inhibitory compounds, 2) strong and weak anti-invasive compounds, and 3) inactive compounds. The morphological effects in 3D culture are summarized inS6 FigThe most potent anti-invasive effects (on PC-3 cells) were shown by compounds3,4,6,15,19and20, at concentrations of 300 nM or lower (with the exception of compound15), with no noticeable effects on the other cell lines. Most of these compounds, however, showed growth-inhibitory effects in all cell lines at concentrations of 1μM or higher. In conclusion, many betulin derivatives are cytotoxic and inhibit cell growth at high concentrations (>1μM). However, at lower concentrations, these compounds may act as potent and specific inhibitors of cell invasion and motility.
Estimation of anti-invasive vs cytotoxic activity. To rule out that cytotoxic and
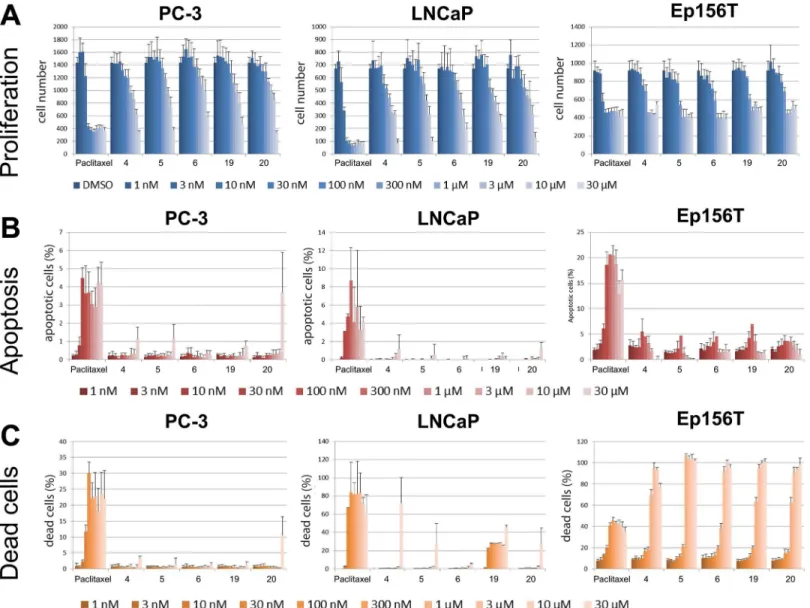
antimitot-ic effects were misinterpreted as anti-invasive, we tested compounds 4, 5, 6, 19 and 20 for inhibi-tion of proliferainhibi-tion and inducinhibi-tion of cell death in a 2D monolayer culture (summarized inFig 6). A broad range of compound concentrations (1 nM to 30μM) were used for PC-3, LNCaP and Ep156T cell lines, and analyzed with the PerkinElmer Operetta high-content imager. In PC3 cells, most compounds did not show noticeable effects on proliferation at concentrations lower than 10μM (Fig 6A). LNCaP cells were more sensitive, with growth inhibition/cytotoxicity start-ing at 3μM. The effects on non-transformed, apoptosis-sensitive Ep156T cells were strongest. Here, cytotoxic effects were typically observed already at 0.3–1μM. None of the compounds spe-cifically induced cell death in PC-3 or LNCaP cells at concentrations below 30μM (Fig 6B and 6C; except for compound 19). We further calculated EC50values for proliferation, apoptosis and
cell death for each compound, using the PerkinElmer Harmony software (method validation shown inS7 Fig). The only assay that produced results consistent with those of the betulin deriv-atives tested in the 2D cell culture model was the proliferation assay (Table 1).
Effects on cell cycle progression and mitosis
Fig 5. Secondary 3D screens.Experimental betulin derivatives and control compounds were tested across a panel of prostate cancer lines (LNCaP, LAPC-4) and non-transformed, prostate epithelial cells (EP156T) in 3D culture.A) The dendrogram is based on three main morphological parameters and
combines all data from primary and secondary 3D screens. Effective compound treatments are indicated in red and yellow, yellow being the most invasion-specific.B) Boxplots showing the impact of selected compounds on spheroid size (Area). Data scaling: as described inFig 4C) Effects of all betulin derivatives and control compounds on cell death (number of dead cells).
Fig 6. Cytotoxicity tests performed in 2D monolayer culture. A) Cell proliferation/cell number,B) programmed cell death (apoptosis), andC) number of dead cells were assessed by conventional assays, combined with high-content microscopy (Operetta). Cells were treated with the five most effective betulin derivatives, including paclitaxel control for 72h. Proliferation was measured as the total number of nuclei (= cells), apoptosis as ratio of caspase-3 positive versus all cells, and cell death as ethidium homodimer-2 positive nuclei versus all cells.
doi:10.1371/journal.pone.0126111.g006
Table 1. Estimated EC50values for cell proliferation.
PC-3 LNCaP EP156T
Compound6 90.8 6.4 0.21
Compound5 9.5 64.6 0.22
Compound4 55.9 93.1 0.2
Compound19 86.9 0.9 0.18
Compound20 66.9 131.5 0.19
Paclitaxel 0.0012 0.0006 0.0008
Values have been calculated using Harmony High-Content Imaging and Analysis Software.
There were no noticeable differences in cell cycle progression in response to any of the tested compounds. We also assessed cell proliferation and mitosis by measuring PCNA and cyclin B1 protein levels (S8B Fig). As expected, betulin derivatives showed no effect on the expression of either protein at the concentration tested. These findings again support that betulin derivatives are only cytotoxic or cause DNA damage at high concentrations (PrCa EC50values ranging
from 1–90μM), whereas they promote considerable anti-invasiveness effects at low nanomolar concentrations.
Possible mechanism(s) of action of the betulin derivatives. In order to elucidate possible
mechanism of action for our betulin derivatives, we used a phospho-kinase array that quantita-tively detects the phosphorylation levels of 43 kinases in cell lysates (Fig 7). Lysates were ex-tracted from 3D cell cultures of PC-3 cells, and exposed to betulin-derived compounds for short (4 hours) or long-term (6 days) periods. For these studies, we selected the two representa-tive derivarepresenta-tives5and20as the most specific, least cytotoxic inhibitors of cell invasion. The short-term (4 h) exposure was performed at a relatively high concentration of 1μM, whereas for the long-term (6 d) exposure, a concentration of only 300 nM was used; both well below the cytotoxic EC50values (10μM for compound5and 67μM for compound20). The kinase arrays
were also quantified by image densitometry (Fig 7A). Phosphorylation levels of four kinases, in both short and long-term exposures, were clearly decreased: STAT3 (Y727), c-Jun (S63), eNOS (S1177) and PLC-γ1 (Y783) (Fig 7Atop and bottom panels). Both compounds also reduced p53 (S15) phosphorylation in the short-term exposure and p70 S6 kinase (T389), p53 (S392) and PYK2 (Y402) phosphorylation in the 6-d exposure, and increased AMPKα1 (T174) phos-phorylation. Compound-specific effects for substance20included differential phosphorylation of Hck (Y411), pan-JNK, GSK-3α/β(S21/S9), STAT3 (Y705) and WNK1 (T60) sites. Akt (S473) phosphorylation was only inhibited by the 6-d exposure. Compound20also increased the phosphorylation of mTOR (S2448), Fyn (Y420) and Src (Y419). In contrast, compound5
did not cause any specific changes in kinase activity in the short-term exposure, and showed only few distinct changes in the long-term treatment. Most notably, Akt (T308) phosphoryla-tion was also abolished almost entirely in response to exposure with compound5, whereas the phosphorylation of p53 sites S46 and S392 were consistently decreased (Fig 7A). The reduction of AKT activity by both compounds was validated by western blotting, using an independent, p-AKT specific antibody (Fig 7B). The short treatments caused only modest changes with a maximum reduction of protein phosphorylation by 2-fold (20: GSK-3α/βS21/S9 and STAT3 Y705). Phosphorylation levels of only three kinases were altered more than 2-fold in the long-term exposures, namely AKT (T308), p53 (S46) and eNOS (S1177), caused by nanomolar con-centrations of compound5. Compound20had much less dramatic effects on kinase phosphor-ylation when compared to compound5, despite its generally more pronounced anti-invasive effects. In summary, the observed reduced AKT and p53 activity as well as the altered phos-phorylation levels of several proteins including eNOS, pan-JNK, and GSK-3α/β, suggest decel-erated cell metabolism or decreased cell viability.
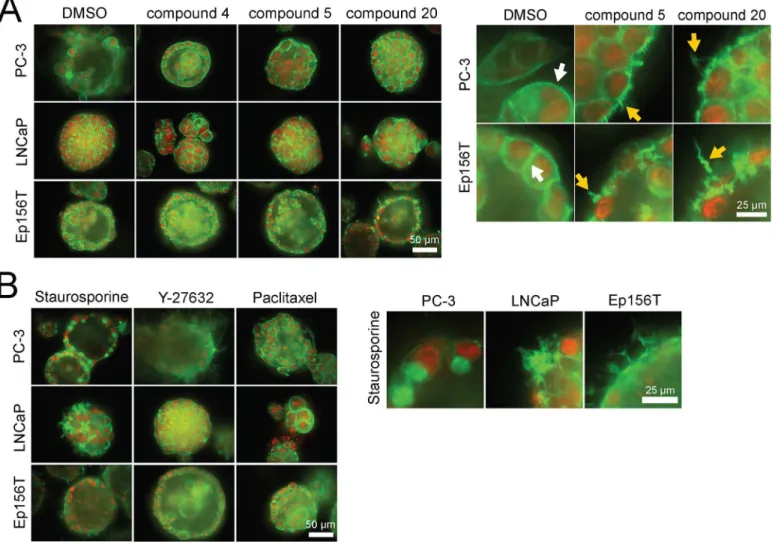
We also explored the 3D multicellular morphologies of PC-3, LNCaP and Ep156T spher-oids exposed to the 5 selected betulin derivatives both for short and long periods of 4 hours and 6 days. From a detailed analysis of the F-actin cytoskeleton (phalloidin staining), it became evident that compounds5, 6, 15and20effectively disrupted the organization of actin cytoskel-eton after 48 hours of exposure (Fig 8A). Interestingly, an almost identical actin“corkscrew”
tested a panel of reference compounds targeting Akt, Rac, ROCK, Src, and other pathways, broadly linked to the actin cytoskeleton. None of the tested control compounds affected the cy-toskeleton in a comparable fashion, with the exception of the non-specific, pan-kinase inhibitor staurosporine. However, these effects were not uniform across the panel of cell lines (Fig 8B, magnification on right).
As a control, we also tested morphologies treated with the same panel of anti-invasive com-pounds4, 5, 6, 16and20as well as betulin (1) on PC3 cells grown in 2D monolayer cultures (S9 Fig). No morphologies and visible effects on the actin cytoskeleton as seen in 3D settings were observed in 2D growth conditions. In contrast, blocking Rac (IPA3 compound) or Rho Kinase/ROCK signaling 27632) did result in a clear rounding (IPA3) or elongation (Y-27632) of single PC3 cells. This indicates that mechanisms affecting the actin cytoskeleton and
Fig 7. Mechanisms of action.PC-3 spheroids were exposed to two representative betulin derivatives,5and20, for 4 h (at 1μM) and 6 days (at 0.3μM). A) Computational quantification of signal intensities from the kinase arrays, aligned by fold changes observed (left to right). B) Western blot of total and phospho-Akt (S473) shown for both short and long-term exposure to20and5.
doi:10.1371/journal.pone.0126111.g007
Fig 8. 3D morphologies of prostate spheroids, exposed to selected betulin derivatives and captured with a confocal microscope.Actin cytoskeleton (filamentous or F-actin) is stained green (phalloidin), nuclei with a red dye (confocal microscope images, 40× objective, scale bar shown for each panel on the right lower corner).
cell motility by particularly anti-invasive betulin derivatives may a) not apply in 2D conditions and b) may not function via the Rho and Rac signaling pathways.
Conclusions
The morphological and functional effects of a diverse set of betulin and abietane derivatives on a selected panel of prostate cancer cell lines were analyzed using both routine 2D and, for a fo-cused panel of 25 betulin derivatives, organotypic 3D cell culture models, by image-based high-content analysis. Our data highlighted the dose-dependent, potent and robust anti-invasive ac-tivity of some betulin derivatives at nanomolar concentrations, with minimal cytotoxicity. Compounds bearing heterocyclic rings fused to ring A including pyrazine, pyrazole, oxazole, indole, and pyridine moieties, were among the most promising in suppressing PC-3 cell inva-siveness. A free carboxyl group at C28 was important for their activity, which was considerably improved when compared to the parent betulinic acid. Kinase phosphorylation profiling, per-formed for two representative betulin derivatives (5and20), suggested that these compounds do not primarily affect cell cycle progression and mitosis, but induce cytotoxic stress only at higher concentrations and after long exposure times, as indicated by p53 de-phosphorylation. Direct evidence for DNA damage was not found. Both compounds reproducibly decreased AKT phosphorylation. In line with the effects on AKT phosphorylation, we noticed that many betulin derivatives, including5and20, effectively disrupted actin cytoskeleton organization, resulting in a peculiar corkscrew-like phenotype of the filamentous actin. This mechanism may be causally linked to the efficient suppression of the invasive properties of PC-3 cells in both 2D and 3D conditions. Overall, our findings suggest that betulin-derivatives such as5and20
may specifically target cell motility and invasion by affecting the organization of filamentous actin fiber network at low nanomolar concentrations, without significant cytotoxic effects. Our study greatly contributed towards establishing the true biological effects of betulin derivatives on prostate cancer cells, with focus on invasiveness, by integrating chemical synthesis with 3D screening platforms. They also highlight the role of betulin and betulinic acid as leads for the development of potent and specific anti-invasive agents. The implementation of these plat-forms in drug discovery programs could significantly contribute towards finding more selective and thus less toxic treatments for cancers where metastasis is particularly relevant such as those of the prostate.
Materials and Methods
Compound synthesis
Chemical synthesis and characterization data of the betulin and abietane derivatives is de-scribed elsewhere, except for three novel compounds. The chemical synthesis and characteriza-tion of the novel compounds and chemical structures of all the other compounds, which are not included inFigs1–3, are described in detail inS1 File. Chemical formulas of the most
po-tent 25 betulin derivatives are shown inFigs1–3, whereas the other betulin and abietane
deriv-atives screened in this study are depicted in the Supporting Information (including additional figures).
Cell lines and culture conditions
Carlsbad, CA, USA), supplemented with 50 mg/L bovine pituitary extract, 5 mg/L epidermal growth factor (EGF) and 2% fetal bovine serum (FBS) for 3D conditions.
Primary cell-based screens in 2D culture. Cell culture in 384-well plate format and
high-content screening were performed as described in [16].
Cell-based screens in 3D culture. All 3D cultures were done in growth factor-free
Matri-gel Basement-membrane Matrix (Corning Inc., New York, NY, USA) using 96-well
Angiogenesisμ-plates (ibidi GmbH, Munich, Germany) as described before.[38]“Sandwich”
assays in short: bottom wells of cooled Angiogenesis plates were filled with 10μL 4 mg/mL Matrigel, centrifuged for 20 min 200gand incubated at 37°C temperature for approximately 30–60 min or until the ECM had polymerized. 1,000–1,500 cells were mixed in 2 mg/mL ECM-medium, and 20μL of cell suspension was added in each well. The plates were centri-fuged for 10 min at 100g, or until the cells had settled on top of the lower ECM. Finally, the outer wells and side reservoirs were filled with water for humidification, and the culture plates placed into the incubator for 3–4 h or overnight. The following day, 60μL of cell culture medi-um were added; refreshed every third day by carefully aspirating the medimedi-um. This“sandwich”
setting allows almost unifocal alignment of cells and 3D structures in a single optical plane, thus reducing the time required for confocal stack imaging.
Morphometric image analysis (AMIDA), data normalization, and
mathematical/statistical modeling
Automated image analyses were essentially performed as described previously (S9 Fig).[38] Statistical data processing and mathematical modeling of treatment responses are described in depth inS1 File.
Chemicals and compound treatments
All control compounds were purchased from Selleck (Munich, Germany), except for stauros-porine (Sigma-Aldrich, St. Louis, MO, USA) and Y-27632 (Tocris, Bristol, UK) and dissolved in dimethyl sulfoxide (DMSO) as a vehicle at 10 mM. In the primary and secondary 3D screens, experimental and control compound exposures were performed in triplicates. Four concentrations for each compound were applied (0.03, 0.1, 0.3 and 1μM). Compound treat-ments were initiated four days after cell embedding, and continued for six days after which spheroids were stained and imaged.
Image acquisition and pre-processing
3D cell cultures were double-stained with calcein AM fluorescent dye (Molecular Probes, Eu-gene, OR, USA) and ethidium homodimer-2 (Invitrogen, Carlsbad, CA, USA). Confocal im-ages were acquired with a Zeiss Axiovert-200M microscope, equipped with Yokogawa CSU22 spinning disc confocal unit using Zeiss Plan-Neofluar 5× objective. Intensity projections were created with SlideBook (Intelligent Imaging Innovations Inc., Denver, CO, USA). Background noise was removed by normalization, using either SlideBook or ImageJ (NIH, Bethesda, MD, USA) programs.
Wound healing assay
added. Wound closure was monitored and quantified with the IncuCyte live-cell imager (Essen Bioscience).
Proliferation, apoptosis and cell death assays
Cells were transferred into CellCarrier 384-well plates (PerkinElmer, Waltham, MA, USA) at a density of 1250 cells/well, using Multidrop dispenser (ThermoFisher Scientific, Waltham, MA, USA). After overnight incubation at 37°C experimental, compounds were added with an ATS Acoustic Transfer System (EDC Biosystems, Fremont, CA, USA). For Ep156T cells the proto-col was done in reverse with compounds dispensed before seeding of cells. Fluorescent markers were dispensed in culture medium using ATS system after 72-h compound exposure. Nuclei were stained with cell-permeable Hoechst 33342 (Molecular Probes, Eugene, OR, USA), dead cells with ethidium homodimer-2 (Invitrogen, Carlsbad, CA, USA) and apoptotic cells with NucView caspase-3 detection reagent (Essen Bioscience, Ann Arbor, MI, USA). Cells were im-aged with Operetta high-content imager (PerkinElmer, Waltham, MA, USA). Proliferation was measured from the number of nuclei (cells), cell death and apoptosis from positive cells/total cells ratio using Harmony image analysis software (PerkinElmer, Waltham, MA, USA). EC50
values were also assessed with the Harmony software.
Cell cycle and DNA damage response analyses
Propidium iodide–based cell cycle analysis method was adapted from Moores Cancer Center protocol (UC San Diego). In short: cells treated for 72 h with experimental compounds on 6-well plates were washed, detached with trypsin, transferred into Eppendorf tubes, washed first with medium and ice cold phosphate buffered saline, pH 7.4 (PBS). Between each step, cells were spun down (200g× 5 min at 4°C). Finally, cells were suspended in 0.5 mL ice cold PBS and slowly added to 1 mL ice cold absolute ethanol. Pellets were stored at -20°C for at least 72 h, after which they were washed with PBS and stained with 50μg/mL propidium iodide (Molecular Probes, Eugene, OR, USA). DNA content of 10,000 cells/sample was measured using a fluorescence-activated cell sorter BD FACSCalibur (BD Biosciences, Franklin Lakes, NJ, USA). Cell cycle analyses were performed using the FCS Express 4 software (De Novo Soft-ware, Los Angeles, CA, USA).
Antibody arrays
according to manufacturer’s instructions. Exposed radiograms were scanned with a tabletop scanner and spot intensities quantified using Array-Pro Analyzer (v4.5.1.73) software.
Supporting Information
S1 Fig. Summary of the results from High Throughput Screening of betulin derivatives and
abietanes in 2D cell culture conditions (384-well format).Screening data for cell lines PC3,
LNCaP and EP156T were measured as CellTitreGlo intensity, and normalized values were combined into a single plot. Compounds named according to internal nomenclature. The run-ning number for compounds selected for further experiments is shown in parentheses. (EPS)
S2 Fig. Morphometric image analysis. A) Maximum intensity projections of two confocal
image stacks segmented with AMIDA image analysis program. The left image shows PC-3 cells in their invasive phase cultured 10 days in 3D Matrigel ECM. The right image shows chemical-ly suppressed invasion.B) A random sample of thousand observations plotted from the com-plete data set and a robustly fitted regression line close to linear dependency indicating the natural relationship between two morphological features log(Area) and log(Perimeter). Devia-tions from this average (residuals) can then be interpreted as a measure for the shape complexi-ty.C) A random sample of 40 structures ordered based on the complexity measure.
(TIF)
S3 Fig. Validation of anti-invasion effects of betulin derivatives. A) Graph showing the
tran-sition of PC-3 spheroids from symmetrical acini to irregular invasive structures over 6 days, as measured by general symmetry (roundness %). Betulin derivatives5(left) and20(right) sup-press the invasive transformation at concentrations over 300 nM.B) Conventional wound healing assay performed in monolayer culture over a period of 64 hours. Wound closure is measured as relative wound density i.e. percentage of original wound area reclaimed by migrat-ing cells. 50% inhibition servmigrat-ing as a cut-off point for effectiveness is highlighted with an or-ange dashed line.
(EPS)
S4 Fig. Secondary screens.Dendrograms forA) LNCaP,B) LAPC-4, andC) Ep156T betulin
screens in 3D culture have been constructed using three main read-outs: spheroid size, spher-oid complexity, and cell death. Clusters highlighted with yellow and red color represent the most biologically active compounds.
(EPS)
S5 Fig. Primary and secondary screens.The heatmap shows morphometric data from betulin
screens performed with four cell lines (PC-3, LNCaP, LAPC-4, Ep156T). The main read-outs (Area = Size, Complexity = Invasiveness, Red = Cell death) are shown in their own columns. Data scaling: DMSO control has been given a value 0 whereas paclitaxel control is valued -100 or 100 depending on the read-out. Color key is located in the upper right corner.
(EPS)
S6 Fig. Confocal images from primary and secondary betulin screens.Viable cells have been
stained with calcein AM (green) and dead cells with ethidium homodimer-2 (red) (5× objec-tive, maximum intensity projections, scale bar = 100μm).
(TIF)
S7 Fig. Positive control paclitaxel EC50curves for proliferation, cell death and apoptosis in
in each graph. (TIF)
S8 Fig. Cell cycle, proliferation and mitotic analyses. A) Histograms for DNA content for the
cell lines PC-3, LNCaP and Ep156T; exposed to three betulin derivatives4,5and20at 1μM concentration for 72 h in monolayer culture. Relative proportions of each cell cycle phase (G1, S and G2), assessed using Flowing software (v2.5.1), are displayed next to each histogram (in %).B) Expression of proliferating cell nuclear antigen (PCNA) and mitotic cyclin B1 protein in response to 72h exposure to betulin derivatives. 24h paclitaxel treatment was used as mitotic arrest control.
(TIF)
S9 Fig. Morphologies of PC-3, LNCaP and Ep156T cells in 2D monolayer culture, exposed
72h to selected betulin derivatives.Actin cytoskeleton (filamentous or F- actin) is stained
green (LifeAct), nuclei with a red dye (confocal microscope images, 40× objective, scale bar shown for each panel on the right lower corner).
(TIF)
S1 File. Supplemental Methods.
(DOCX)
Acknowledgments
The authors would like to acknowledge the excellent technical assistance of Pauliina Toivonen at many stages of this work, and Mari Tikka for her synthetic work.
Author Contributions
Conceived and designed the experiments: VH RH VMM JY-K HR KMOC MN. Performed the experiments: VH RH JV EP HPS SA. Analyzed the data: HPS VH MN IA JV. Contributed re-agents/materials/analysis tools: RH SA VMM JY-K. Wrote the paper: VH RH VMM MN KMOC.
References
1. Moreira VM, Salvador JA, Vasaitis TS, Njar VC. (2008) CYP17 inhibitors for prostate cancer treatment— an update. Curr Med Chem 15: 868–899. PMID:18473796
2. Lovitt CJ, Shelper TB, Avery VM. (2014) Advanced cell culture techniques for cancer drug discovery. Biology (Basel) 3: 345–367. doi:10.3390/biology3020345PMID:24887773
3. Kola I, Landis J. (2004) Can the pharmaceutical industry reduce attrition rates? Nat Rev Drug Discov 3: 711–715. doi:10.1038/nrd1470PMID:15286737
4. Pampaloni F, Reynaud EG, Stelzer EH. (2007) The third dimension bridges the gap between cell cul-ture and live tissue. Nat Rev Mol Cell Biol 8: 839–845. nrm2236 [pii]. PMID:17684528
5. Baker BM, Chen CS. (2012) Deconstructing the third dimension: How 3D culture microenvironments alter cellular cues. J Cell Sci 125: 3015–3024. doi:10.1242/jcs.079509PMID:22797912
6. Rimann M, Graf-Hausner U. (2012) Synthetic 3D multicellular systems for drug development. Curr Opin Biotechnol 23: 803–809. doi:10.1016/j.copbio.2012.01.011PMID:22326911
7. Harma V, Virtanen J, Makela R, Happonen A, Mpindi JP, Knuuttila M, et al. (2010) A comprehensive panel of three-dimensional models for studies of prostate cancer growth, invasion and drug responses. PLoS One 5: e10431. doi:10.1371/journal.pone.0010431PMID:20454659
8. Kenny PA, Lee GY, Myers CA, Neve RM, Semeiks JR, Spellman PT, et al. (2007) The morphologies of breast cancer cell lines in three-dimensional assays correlate with their profiles of gene expression. Mol Oncol 1: 84–96. doi:10.1016/j.molonc.2007.02.004PMID:18516279
10. Friedl P, Wolf K. (2010) Plasticity of cell migration: A multiscale tuning model. J Cell Biol 188: 11–19. doi:10.1083/jcb.200909003PMID:19951899
11. Harma V, Knuuttila M, Virtanen J, Mirtti T, Kohonen P, Kovanen P, et al. (2012) Lysophosphatidic acid and sphingosine-1-phosphate promote morphogenesis and block invasion of prostate cancer cells in three-dimensional organotypic models. Oncogene 31: 2075–2089. doi:10.1038/onc.2011.396PMID: 21996742
12. Ivascu A, Kubbies M. (2006) Rapid generation of single-tumor spheroids for high-throughput cell func-tion and toxicity analysis. J Biomol Screen 11: 922–932. 1087057106292763 [pii]. PMID:16973921 13. Thierbach R, Steinberg P. (2009) Automated soft agar assay for the high-throughput screening of
anti-cancer compounds. Anal Biochem 387: 318–320. doi:10.1016/j.ab.2009.01.029PMID:19454240 14. Hsiao AY, Tung YC, Qu X, Patel LR, Pienta KJ, Takayama S. (2012) 384 hanging drop arrays give
ex-cellent Z-factors and allow versatile formation of co-culture spheroids. Biotechnol Bioeng 109: 1293– 1304. doi:10.1002/bit.24399PMID:22161651
15. Hongisto V, Jernstrom S, Fey V, Mpindi JP, Kleivi Sahlberg K, Kallioniemi O, et al. (2013) High-through-put 3D screening reveals differences in drug sensitivities between culture models of JIMT1 breast can-cer cells. PLoS One 8: e77232. doi:10.1371/journal.pone.0077232PMID:24194875
16. Krausz E, de Hoogt R, Gustin E, Cornelissen F, Grand-Perret T, Janssen L, et al. (2013) Translation of a tumor microenvironment mimicking 3D tumor growth co-culture assay platform to high-content screening. J Biomol Screen 18: 54–66. doi:10.1177/1087057112456874PMID:22923784
17. Lovitt CJ, Shelper TB, Avery VM. (2013) Miniaturized three-dimensional cancer model for drug evalua-tion. Assay Drug Dev Techn 11: 435–448. doi:10.1089/adt.2012.483PMID:25310845
18. Celli JP, Rizvi I, Blanden AR, Massodi I, Glidden MD, Pogue BW, et al. (2014) An imaging-based plat-form for high-content, quantitative evaluation of therapeutic response in 3D tumour models. Sci Rep 4: 3751. doi:10.1038/srep03751PMID:24435043
19. Mehta G, Hsiao AY, Ingram M, Luker GD, Takayama S. (2012) Opportunities and challenges for use of tumor spheroids as models to test drug delivery and efficacy. J Control Release 164: 192–204. doi:10. 1016/j.jconrel.2012.04.045PMID:22613880
20. Gough A, Lezon T, Faeder J, Chennubhotla C, Murphy RF, Crigchley-Thorne R et al. (2014) High-con-tent analysis with cellular and tissue systems biology: A bridge between cancer cell biology and tissue-based diagnostics. In: Anonymous The Molecular Basis for Cancer: Fourth Edition.: Elsevier Inc. pp. 345–367–367.
21. Clardy J, Walsh C. (2004) Lessons from natural molecules. Nature 432: 829–837. PMID:15602548 22. Newman DJ, Cragg GM. (2012) Natural products as sources of new drugs over the 30 years from 1981
to 2010. J Nat Prod 75: 311–335. doi:10.1021/np200906sPMID:22316239
23. Ed. Salvador, Jorge A. R. (2010) Pentacyclic triterpenes as promising agents in cancer. 321 p. 24. Sheng H, Sun H. (2011) Synthesis, biology and clinical significance of pentacyclic triterpenes: A
multi-target approach to prevention and treatment of metabolic and vascular diseases. Nat Prod Rep 28: 543–593. doi:10.1039/c0np00059kPMID:21290067
25. Tran K, Risingsong R, Royce D, Williams CR, Sporn MB, Liby K. (2012) The synthetic triterpenoid CDDO-methyl ester delays estrogen Receptor–Negative mammary carcinogenesis in polyoma middle T mice. Cancer Prev Res 5: 726–734. doi:10.1158/1940-6207.CAPR-11-0404PMID:22401982 26. Yoon JJ, Lee YJ, Kim JS, Kang DG, Lee HS. (2010) Betulinic acid inhibits high glucose-induced
vascu-lar smooth muscle cells proliferation and migration. J Cell Biochem 111: 1501–1511. doi:10.1002/jcb. 22880PMID:20872792
27. Shanmugam MK, Manu KA, Ong TH, Ramachandran L, Surana R, Bist P, et al. (2011) Inhibition of CXCR4/CXCL12 signaling axis by ursolic acid leads to suppression of metastasis in transgenic adeno-carcinoma of mouse prostate model. Int J Cancer 129: 1552–1563. doi:10.1002/ijc.26120PMID: 21480220
28. Park B, Sung B, Yadav VR, Cho S, Liu M, Aggarwal BB. (2011) Acetyl-11-keto-?-boswellic acid sup-presses invasion of pancreatic cancer cells through the downregulation of CXCR4 chemokine receptor expression. International Journal of Cancer 129: 23–33. doi:10.1002/ijc.25966PMID:21448932 29. Yadav VR, Sung B, Prasad S, Kannappan R, Cho SG, Liu M, et al. (2010) Synthesis and
structure-ac-tivity relationship study of cytotoxic germanicane- and lupane-type 3beta-O-monodesmosidic saponins starting from betulin. J Mol Med 88: 1243–1253. doi:10.1007/s00109-010-0669-3PMID:20798912 30. Eckerman C, Ekman R. (1985) Comparison of solvents for extraction and crystallisation of betulinol
from birch bark waste. Pap Puu 67: 100.
32. Pisha E, Chai H, Lee IS, Chagwedera TE, Farnsworth NR, Cordell GA, et al. (1995) Discovery of betuli-nic acid as a selective inhibitor of human melanoma that functions by induction of apoptosis. Nat Med 1: 1046–1051. PMID:7489361
33. Rzeski W, Stepulak A, Szymanski M, Juszczak M, Grabarska A, Sifringer M, et al. (2009) Betulin elicits anti-cancer effects in tumour primary cultures and cell lines in vitro. Basic Clin Pharmacol Toxicol 105: 425–432. doi:10.1111/j.1742-7843.2009.00471.xPMID:19821831
34. Šilhár P, Alakurtti S,Čapková K, Xiaochuan F, Shoemaker CB, Yli-Kauhaluoma J, et al. (2011)
Synthe-sis and evaluation of library of betulin derivatives against the botulinum neurotoxin A protease. Bioorg Med Chem Lett 21: 2229–2231.http://dx.doi.org/10.1016/j.bmcl.2011.02.115. doi:10.1016/j.bmcl. 2011.02.115PMID:21421315
35. Haavikko R, Nasereddin A, Sacerdoti-Sierra N, Kopelyanskiy D, Alakurtti S, Tikka M, et al. (2014) Het-erocycle-fused lupane triterpenoids inhibitLeishmania donovaniamastigotes. Med Chem Commun 5: 445–451.
36. Salvador JAR, Moreira VM, Pinto RMA, Leal AS, Le Roux C. (2011) Bismuth(III) triflate-based catalytic direct opening of oleanolic hydroxy-?-lactones to afford 12-oxo-28-carboxylic acids. Advanced Synthe-sis & CatalySynthe-sis 353: 2637–2642. doi:10.1002/adsc.201100155
37. Moreira VMA, Vasaitis TS, Njar VCO, Salvador JAR. (2007) Synthesis and evaluation of novel 17-inda-zole androstene derivatives designed as CYP17 inhibitors. Steroids 72: 939–948.http://dx.doi.org/10. 1016/j.steroids.2007.08.004. PMID:17884122