Quantitative Localization Microscopy: Effects
of Photophysics and Labeling Stoichiometry
Robert P. J. Nieuwenhuizen1☯, Mark Bates2☯, Anna Szymborska3, Keith A. Lidke4,
Bernd Rieger1*‡, Sjoerd Stallinga1*‡
1Quantitative Imaging Group, Delft University of Technology, Delft, The Netherlands,2Department of NanoBiophotonics, Max Planck Institute for Biophysical Chemistry, Göttingen, Germany,3Cell Biology and Biophysics Unit, European Molecular Biology Laboratory, Heidelberg, Germany,4Department of Physics and Astronomy, University of New Mexico, Albuquerque, New Mexico, USA
☯These authors contributed equally to this work. ‡These authors also contributed equally to this work.
*[email protected](BR);[email protected](SS)
Abstract
Quantification in localization microscopy with reversibly switchable fluorophores is severely hampered by the unknown number of switching cycles a fluorophore undergoes and the un-known stoichiometry of fluorophores on a marker such as an antibody. We overcome this problem by measuring the average number of localizations per fluorophore, or generally per fluorescently labeled site from the build-up of spatial image correlation during acquisition. To this end we employ a model for the interplay between the statistics of activation, bleach-ing, and labeling stoichiometry. We validated our method using single fluorophore labeled DNA oligomers and multiple-labeled neutravidin tetramers where we find a counting error of less than 17% without any calibration of transition rates. Furthermore, we demonstrated our quantification method on nanobody- and antibody-labeled biological specimens.
Introduction
Localization microscopy (e.g. PALM/STORM) is a powerful tool for imaging biological struc-tures on the nanoscale [1–5]. In order to yield information about the molecular composition of the sample, localization microscopy images must be quantifiable in terms of the density of fluo-rescently labeled molecules or of binding sites. The relationship between these desired densities and the actual measured density of localizations is non-trivial however, since the (average) number of localizations per fluorophore and the labeling stoichiometry are unknown.
The use of photo-activatable fluorescent proteins (FPs) [1,3,6] offers a relatively direct ap-proach to counting and thus to obtaining the desired densities, provided they switch off irre-versibly after a non-interrupted on-state. In practice, however, there are several factors that can either lead to overcounting or undercounting of molecules [7]. Overcounting occurs when molecules are localized several times, either due to short-term blinking during the on-state or due to long lived dark states that effectively lead to reversible switching of FPs [8,9]. In addi-tion, overexpression of fluorescent fusion proteins, which is needed to substitute the native
a11111
OPEN ACCESS
Citation:Nieuwenhuizen RPJ, Bates M, Szymborska A, Lidke KA, Rieger B, Stallinga S (2015) Quantitative Localization Microscopy: Effects of Photophysics and Labeling Stoichiometry. PLoS ONE 10(5): e0127989. doi:10.1371/journal.pone.0127989
Academic Editor:Markus Sauer, Julius-Maximilians-University Würzburg, GERMANY
Received:March 6, 2015
Accepted:April 22, 2015
Published:May 20, 2015
Copyright:© 2015 Nieuwenhuizen et al. This is an open access article distributed under the terms of the
Creative Commons Attribution License, which permits unrestricted use, distribution, and reproduction in any medium, provided the original author and source are credited.
Data Availability Statement:All relevant data are within the paper and its Supporting Information files.
protein, may also lead to overestimation of protein numbers relative to endogenous expression levels. Undercounting occurs when the weak signals from FPs are missed by the localization al-gorithm or when FPs are not functional due to protein misfolding or incomplete maturation [10–12].
Another method of labeling employs organic fluorophores, which typically have a higher brightness and photostability than FPs, and thus have a higher probability to be successfully detected and then to be localized more accurately [13]. Organic fluorophores have not been widely used for quantification studies, however, as quantification is complicated by under-counting problems due to incomplete labeling of potential binding sites, and by overunder-counting problems due to reversible switching of the fluorophores and unknown stoichiometry of the fluorescent labels on the marker (e.g. antibody). These undercounting problems can only be solved in general by new advances in biochemical labeling techniques that result in a higher la-beling efficiency. Instead, we focus here on addressing the overcounting problems with computational methods.
Efforts have been made in the past towards resolving the issue of overcounting with revers-ibly switchable fluorophores. For example, in kymograph analysis samples are prepared with sparsely distributed fluorescent markers to calibrate the fluorophore switching kinetics [8]. Similarly, a titration method was recently proposed where the concentration of markers during labeling was titrated to calibrate the number of localizations per marker [14,15]. However, both methods are susceptible to differences in the local chemical environment in the calibra-tion condicalibra-tions that affect the switching kinetics and thus render the calibracalibra-tion inaccurate. Al-ternatively, pair correlation analysis [16,17] does not require a separate calibration
experiment, but relies on an over-simplified physical model (e.g. neglecting the effects of photobleaching). Methods addressing the short-term blinking of fluorescent proteins (e.g. [6,
8,9]) rely on spatiotemporal clustering of localizations of the same fluorophore. This does not work for reversibly switching fluorophores as the lifetime of the long-lived dark states is much longer than the timescale on which other nearby fluorophores are activated.
In a recent paper [18] we have proposed the use of spatial frequency correlations in the re-constructed super-resolution image to estimate the average number of localizations per mark-er. However, in that study bleaching effects were treated in an ad hoc manner and labeling stoichiometry was not considered. Here, we present a study of how both effects can be ac-counted for to provide accurate quantification of localization microscopy data in terms of the number of localizations per fluorescently labeled site. Our method requires only limited cali-bration of the labeling stoichiometry and is applicable to common labeling techniques (e.g. an-tibodies). Software for estimating the number of localizations per marker with this method is freely available in the form of Matlab code athttp://www.diplib.org/add-ons/.
Results
The starting point of our analysis is a three-state switching model [19,20] for a fluorophore consisting of an on-state, off-state and a bleached state. The on-off switching is characterized by a switching rateksw=konkoff/(kon+koff) and the photo-bleaching by an effective bleaching
ratekbl. Bleaching from the on-state, as well as from the off-state, is taken into account.
There-fore the effective bleaching ratekbldepends on the rates of both bleaching channels. This
model (seeS1 Textsection 2 for a derivation) gives rise to an average number of activations per fluorophore:
hMðtÞi ¼M1ð1 expð kbltÞÞ ð1Þ
whereM1=ksw/kblis the average number of switching cycles thefluorophore undergoes and analysis, decision to publish, or preparation of
the manuscript.
Competing Interests:The authors of this manuscript have read the journal’s policy and have the following competing interests: BR and SS have submitted a patent application regarding this work (NL2012169
“Determining the average number of localizations per emitter and the average number of emitters associated with one site in localization microscopy,”
before photobleaching. For small times (kblt1) the statistics of on-off switching dominates
the number of localizations of a single emitter, which then follows a Poisson distribution with expectation valuekswt. For longer times (kblt1) bleaching is more important and the
num-ber of localizations follows a geometric distribution with expectation valueM1.
Measurement of the bleaching ratekblfrom the cumulative number of localizations as a
function of time is straightforward. Determination of the switching rateksw, or equivalently the
asymptotic number of localizations per emitterM1, requires an additional measurement.
Spa-tial correlation analysis with Fourier Ring Correlation [18] enables the measurement of the cor-relation parameterQ(t) =hM(M−1)i/hMi. This correlation parameter is related to the variance inMbyVar(M) =hMi(Q−hMi+ 1). It depends on the parameters of the three-state switching model as:
QðtÞ ¼2ðM1 1Þ 1 kblt
expðkbltÞ 1
: ð2Þ
Measurement ofQ(t) enables the determination ofM1, askblis already known from thefit to
the cumulative number of localizations. The average number of localizations per emitterhM
(t)ican be directly found fromkblandM1usingEq 1. The desired density of emitters then
fol-lows from the measured density of localizations by dividing withhM(t)iat thefinal time point of the data acquisition.
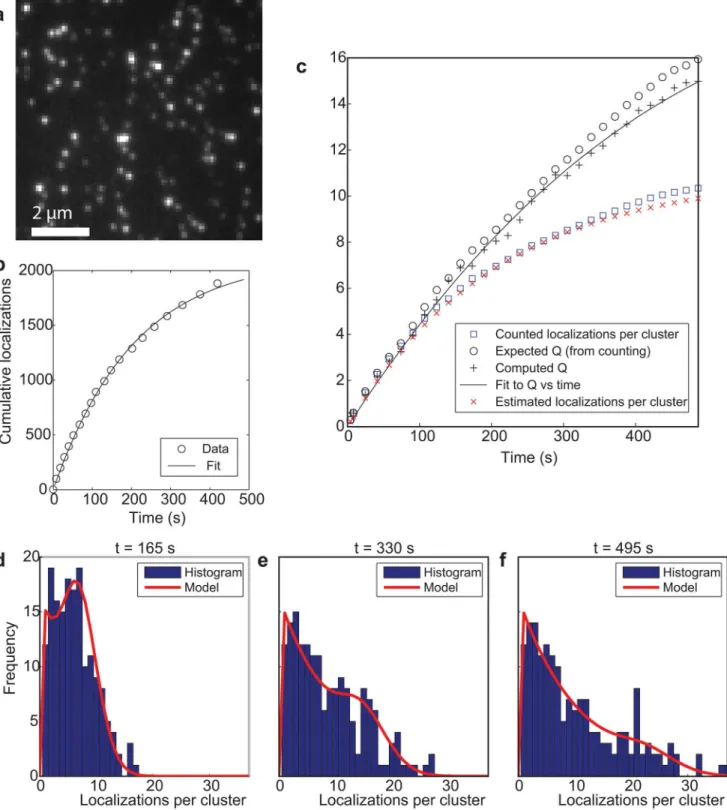
The three-state switching model for individual fluorophores has been validated by experi-ments on isolated DNA oligomers labeled with single Alexa Fluor 647 dyes on a glass substrate (Fig 1a). Clearly recognizable isolated clusters of localizations provide a ground truth for the distribution of localizations per emitter. First order switching kinetics are confirmed by the ob-servation of exponential on and off-time distributions (S1 Fig) givingτon= 26.6 ± 0.5 ms and
τoff= 18.0 ± 0.4 s. Fits of the cumulative number of localizations (Fig 1b) and the correlation
parameter yieldkbl= (4.7 ± 0.1) × 10−3/s andM1= 11.0 ± 0.1. Both the correlation parameter
Q(t) and the predicted number of localizations per emitterhM(t)i, which is found with the esti-mated values ofkblandM1, agree with less than 10% error with the ground truth values
ob-tained from the cluster analysis (Fig 1c). Neglecting effects of photobleaching would lead to the estimatehM(t)i=Q(t) which results here in an error of up to 47%. Note that the use of pair-correlation functions for counting also comes down to an alternative procedure for estimating the quantityQ(t) [17], and would thus suffer from a comparable error when photobleaching is neglected. The measured on and off-times of the clustered localizations lead to a switching rate
ksw= (5.6 ± 0.1) × 10−2/s, in reasonable agreement with the valuekblM1= (5.2 ± 0.2) × 10−2/s
obtained from the fit parameters above. Finally, the distribution of the number of localizations per emitter as a function of time (Fig1d–1f) corresponds well to theory for the estimated values ofkblandM1: p = 0.67, 0.91, and 0.71, in one-sample two-sided discrete Kolmogorov-Smirnov
tests at times t = 122, 243 and 365 s respectively, so no significant difference was found at a 0.05 significance level.
Fig 1. Quantitative localization microscopy with a single fluorophore per labeled site.(a) Three state model with rates. (b) Cutout of total image of sparsely distributed DNA oligomers on glass labeled with single Alexa Fluor 647 dyes showing well-isolated clusters of localizations. (c) Cumulative number of localizations and single-exponential fit. (d) Correlation parameterQdetermined from the spatial image correlations and fit with switching model shows
agreement with the ground truth value determined from the cluster analysis. The estimated value for the average number of localizationshM(t)ishows
agreement with the ground truth value determined from the cluster statistics. (e-g) Histograms of the number of localizations accumulated per cluster and model prediction at three time points during the image acquisition.
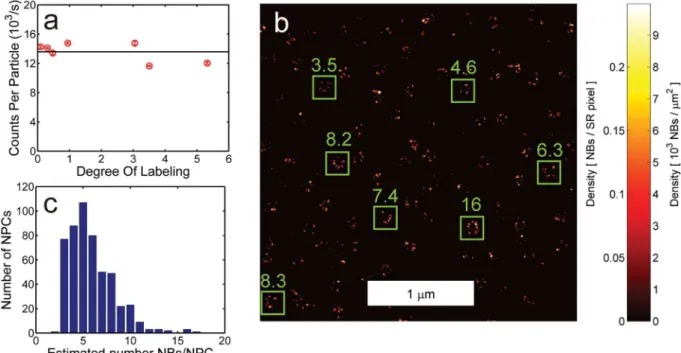
relatively low, given the eightfold symmetry of the NPC and given that recent stoichiometry data point to up to 32 Seh1 copies per NPC [22,23].
In commonly used antibody labeling schemes there areS>1 fluorescent molecules per la-beled site (e.g. antibody). The three-state switching model can be expanded to incorporate this labeling stoichiometry (seeS1 Textsection 3) from which we obtain an average number of acti-vations per labeled sitehMiand a correlation parameterQ:
hMðtÞi ¼ hSiM1ð1 expð kbltÞÞ; ð3Þ
QðtÞ ¼2M1 1 kblt
expðkbltÞ 1
þmM1ð1 expð kbltÞÞ; ð4Þ
where the average number of emitters per sitehSiand the stoichiometry parameterμ=hS(S
−1)i/hSiare novel parameters entering the description. The averages here are understood to be averages over the distribution of labeled sites (sites withS1). When each labeled site has only one emitter we havehSi= 1 andμ= 0, and we retrieve the previously considered case of Eqs1and2. Expressions for the average number of emitters per sitehSiand the stoichiometry parameterμcan be derived from models for the labeling stoichiometry (S1 Textsection 3).
Primary antibody labeling may be described by Poisson statistics for weakly interacting fluorophores. Then the DOL revealed by absorption spectroscopy corresponds to the Poisson rate of the labeling process. It follows that the average number of emitters per sitehSi= DOL/ [1−exp(−DOL)] and the stoichiometry parameterμ= DOL. Quenching (usually attributed to dye aggregation [24–26]), invalidates the assumption of weakly interacting fluorophores for larger DOL values [14] and a separate calibration of both the average number of emitters per
Fig 2. Quantitative localization microscopy of NB-labeled Seh1 in the NPC.(a) FCS-analysis of NB stoichiometry indicating there is a single fluorophore per NB. (b) Cutout of quantitative localization microscopy image of NB-labeled Seh1 in the NPC (kbl= 4.8 × 10⁻³/s andM1= 5.0). The numbers at the green
boxes indicate the estimated number of NBs within the box. (c) Histogram of the estimated number of NBs per NPC.
sitehSiand the stoichiometry parameterμ(but not of the switching and bleaching ratesksw
andkbl) is then necessary. The case of secondary antibody labeling is even more complicated as
now the stoichiometry of secondary to primary antibodies is relevant in addition to the stoichi-ometry of emitters on the secondary antibodies (S1 Textsection 3). Generally, prior knowledge on the labeling via a calibration of the average number of emitters per sitehSiand the stoichi-ometry parameterμis needed to compute the average number of localizations per labeled site hM(t)ifrom the cumulative number of localizations and the correlation parameterQ(t).
We validated the approach for estimating the number of localizations per site with multiple fluorophores per site using a control sample of sparsely distributed neutravidin tetramers on glass labeled with varying numbers of Alexa Fluor 647 fluorophores. The labeling stoichiome-try parameters were determined from FCS brightness measurements and from the brightness statistics of single neutravidin tetramers in the first frames of the sparse control samples (S2 Figpanels a and b). The values obtained with the latter method were applied to estimate the number of localizations per neutravidin tetramer with a Root Mean Square Error (RMSE) of 17% of the ground truth number, which was established by cluster analysis (Fig 3a). This result appears to be robust against errors in the calibration of the stoichiometry parameterμ, as varia-tions in this parameter on the order of unity change the result by 10% or less (S3 Fig). The esti-mated switching model parametersM1andkbldo not vary significantly with DOL (Fig 3f),
suggesting independent switching and bleaching of the detected, non-quenched emitters (see alsoS2 Figpanel c). The remaining quenched emitters that do contribute to the measured DOL in absorption spectroscopy do not appear to contribute to the localizations (S2 Figpanels a and d). Additional validations of our method for multiple fluorophores per site are shown in
S4andS5Figs.
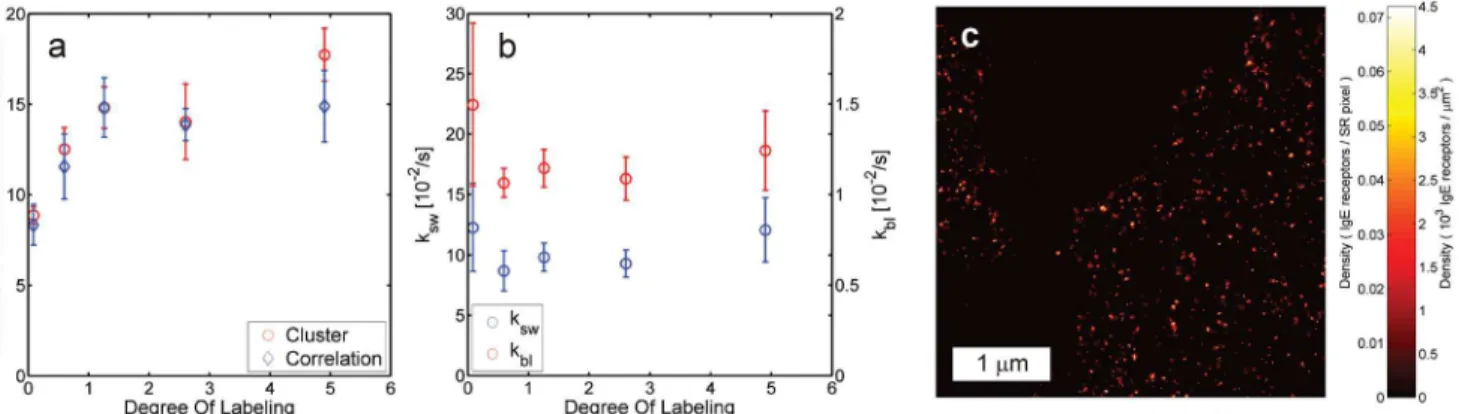
Next, we applied our counting method to images of Immunoglobulin E (IgE) receptors in fixed Rat Basophilic Leukemia (RBL) cells labeled with IgE conjugated to Alexa Fluor 647 (Fig 3c). The data were analyzed assuming a stoichiometry parameterμ= DOL and an average number of emitters per sitehSi= DOL/ [1−exp(−DOL)], where the measured DOL = 1.5 was low enough to neglect possible quenching effects. The density of receptors on the membrane was estimated as 81μm-2. This is on the same order as e.g. Espinoza et al. [27], where on average 64 ± 32μm-2were obtained in TEM images (252 ± 123 receptors per field of view of (2266
Fig 3. Quantitative localization microscopy with multiple emitters per labeled site.(a) Number of localizations per neutravidin tetramer as a function of DOL as estimated from the image correlations and the ground truth values from cluster analysis, showing good agreement. (b) Fitted bleach ratekbland
switching rateksw=M1kblas a function of DOL values for the same data, indicating independent activation and bleaching per label. Error bars indicate the
standard deviation among samples at the same DOL. (c) Image of IgE receptors on the membrane of RBL cells labeled with primary antibodies with a DOL of 1.5 (kbl= 9.1 × 10⁻³/s andM1= 2.3).
nm)2with a labeling efficiency of 0.8 ± 0.1). Densities may vary substantially with cell incuba-tion times and between cell types though, implying that more precise values cannot
be specified.
Care must be taken when applying our analysis to samples that have markers with mutual distances well below the localization precision due to high labeling densities or clustering. Ef-fectively these markers would be seen as a single labeled site by the current correlation analysis algorithm, which causes overestimation of the number of localizations per marker.S1 Text sec-tion 4 provides estimates for the labeling densities above which problems are to be expected. As a rule of thumb, problems ar expected when the density is higher than 1/σm(for filaments)
or1=2s2m(for punctate clusters), whereσmis the average localization precision.
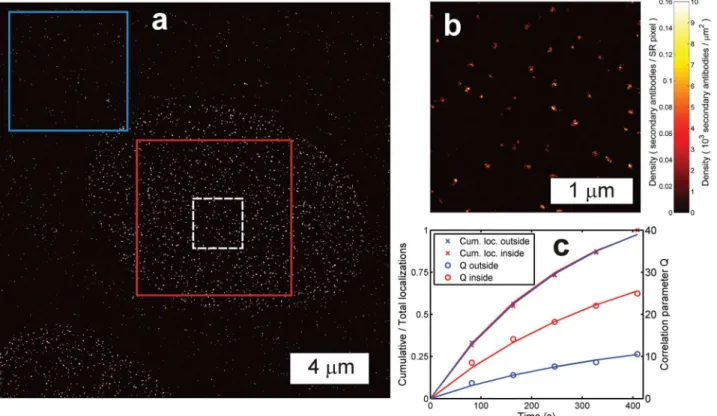
An experimental approach to verify that counting results are not affected by high density ar-tefacts is to compare them with the results that are obtained by computing the correlation pa-rameterQ(t) in regions of relatively low labeling density. We have analyzed an image of secondary antibody-Alexa Fluor 647 labeled Nup153 protein of the NPC in this way (Fig 4). The densely labeled region with NPCs inside the nuclear membrane gives rise to a correlation parameterQ(t) that is about 2.4 times higher than for the region with non-specifically bound antibodies outside the nuclear membrane. This shows that the clustered antibodies inside the nucleus appear as a single site for the estimation ofQ(t). However, the relative rate with which
Fig 4. Quantitative localization microscopy with heterogeneous labeling density.(a) Overview image (pixel size 10 nm, clipped for visibility) and (b) zoomed inset (pixel size 4 nm) of the dashed white box in (a) of secondary antibody-Alexa Fluor 647 labeled Nup153 protein of the NPC in the nuclear membrane with non-specifically bound (secondary) antibodies outside the nuclear membrane region. (c) The correlation parameter Q for the region inside the nuclear membrane (red box) is higher than outside (blue box) due to the tight clustering of the secondary antibodies labeling the Nup153 proteins. The relative number of accumulated localizations at each time point is similar, indicating that the bleaching behavior is similar and the sources of the localizations are identical in both regions.
localizations are accumulated is similar, indicating similar bleaching behavior and identical fluorophores in both regions. A fit to the correlation parameterQ(t) for the outside region giveskbl= 3.8 × 10⁻³/s andM1= 5.5, under the assumption that the outside region labeling
en-tities are secondary antibodies, and using the calibrated fluorophore to secondary antibody DOL equal to 1.2. Applying these values in a fit of the correlation parameterQ(t) for the region inside the nuclear membrane gives approximately 2.7 secondary antibodies per NPC on aver-age, which agrees with the ratio of 2.4 between the localizations per NPC and the localizations per non-specifically bound antibody outside the nucleus. The NPCs are likely to have multiple primary antibodies, because this would explain the difference in the spread of localizations of NPCs (16 nm) and localizations of the non-specifically bound antibodies outside the nuclear membrane region (11 nm).
We also verified that the counting results inFig 2are not affected by high density artefacts by computing the correlation parameterQ(t) in a region outside the nucleus with similar bleaching behavior. A fit toQ(t) returnedkbl= 5.3 × 10⁻³/s andM1= 4.5 (compared withkbl=
5.3 × 10⁻³/s andM
1= 5.0 inside the nucleus), which showed that the estimation ofQ(t) was
not substantially affected by clustering of Seh1 in these data.
Discussion
The switching model assumes constant and uniform rates. Accordingly, all data was acquired under conditions where the excitation and activation light intensities did not vary spatially across the sample, nor change as a function of time during the experiment. To adapt the meth-od for experiments in which the switching rate is varied, the illumination intensities should be recorded over time and included in a generalization of the switching model that includes time dependent switching rates. The method has been demonstrated on Alexa Fluor 647 dyes, but applies to any fluorophore that can effectively be described by the three-state switching model. Such a description becomes problematic for the existence of multiple long lived dark states with lifetimes on the same order of magnitude [20]. This would require a more substantial modification of the theory, in which the three-state model is expanded with one or more addi-tional states and two or more addiaddi-tional rates between the states. Subsequently, the average number of localizations per labeled sitehM(t)ineeds to be derived and expressed in a form that only depends on parameters that can be obtained from fits to the cumulative number of locali-zations and to the correlation parameterQ(t). Finally we note that fluorophore activation events that are missed by the localization algorithm, so-called false negative localizations, do not affect the accuracy of the method by more than 5 to 10% (seeS1 Text, section 3).
The analyses for the data presented in Figs1and3ashowed that overcounting errors on the order of 50% occur when neglecting reversible switching of the fluorophores and unknown stoichiometry of the fluorescent labels, as is typically done for example in pair-correlation anal-ysis [17]. As we noted before, the latter represents an alternative approach for estimating the spurious correlation parameterQ(t), and could therefore be corrected for overcounting similar to how we treat the estimate forQ(t) from the FRC. However, the pair-correlation analysis does require a parametric model for the correlations in the spatial distribution of the labeled sites, unlike the FRC approach. In-vitro calibration of fluorophore switching and bleaching rates for counting purposes may be susceptible to differences in the chemical environment of the fluorophores. Comparing the estimated rates for Neutravidin inFig 3(on glass) andS4 Fig
(in a cell) indicates that differences in these rates of a factor 2 to 3 may occur, which would re-sult in similar differences in the estimated number of localizations per site.
emitters. For labeling entities with single fluorophores the method can be used directly on the localization data. Otherwise the method requires only a one-time calibration of the number of fluorophores per label as an additional input, which can be used for all subsequent uses of that label. With spatial resolution approaching the molecular scale, this will expand the possibilities of researchers to address questions about the molecular stoichiometry and spatial organization of protein complexes. This is essential to establish localization microscopy as a method which may be used to not just observe the nanoscale“shape”of biological structures, but also to ob-tain quantitative information about their composition.
Materials and Methods
Experimental materials and methods
Preparation of fluorescent DNA oligonucleotidesTo characterize the on-off switching kinet-ics of single reversibly switchable fluorescent molecules, a single Alexa Fluor 647 fluorophore was conjugated to the end of a double stranded DNA (dsDNA) construct, and the construct was immobilized on a glass surface for single-molecule imaging. DNA constructs were labeled as previously described [19,28]. Briefly, PAGE purified DNA oligos (30 base pairs in length) with biotin and/or amine modifications at the ends were obtained from Eurofins Operon. Amine-modified oligos were labeled post-synthesis with amine reactive Alexa Fluor 647 (Life Technologies, A20006) following the manufacturer’s protocol. Dye-labeled oligos were purified using reverse-phase HPLC. Complimentary strands of DNA, one with a biotin label and the other with a fluorescent label, were annealed to form fluorescent biotinylated dsDNA. Anneal-ing was carried out by mixAnneal-ing equimolar amounts of the two complimentary strands in 10mM Tris-Cl (pH 7.5), 50mM NaCl, heating for 60s at 90°C, and cooling to room temperature dur-ing*1 hr.
Preparation of fluorescent Secondary Antibodies, Nanobodies, and NeutravidinDonkey anti-mouse secondary antibodies (Jackson ImmunoResearch # 715-005-150), anti-GFP camel-id antibody fragments (a.k.a. Nanobodies, Chromotek, GT-250), and Neutravcamel-idin tetramers (Life Technologies, A2666) were labeled with amine-reactive Alexa Fluor 647 according to the manufacturer’s protocol. Briefly, unlabeled antibodies, nanobodies, or neutravidin were mixed with amine reactive dye in a sodium bicarbonate buffer (0.1 M, pH 8.5), and the labeling reac-tion was left to proceed at room temperature for 30 min. The labeled product was separated from unreacted dye by running the reaction mixture over a gel filtration column (Illustra NAP-5 column, GE Healthcare), and eluting in PBS. The labeled product was stored at 4°C in PBS. The degree of labeling (DOL) of the antibodies, nanobodies, or neutravidin was measured using a UV/Vis spectrophotometer. The DOL was adjusted by varying the amount of dye that was added to the reaction.
FCS characterization of fluorescent Nanobodies, Neutravidin, and Secondary Antibod-iesThe fluorescence lifetime and brightness per particle of fluorescent antibodies, nanobodies, and neutravidin were measured using a commercial FCS spectrometer (Evotec FCS plus spec-trometer, Evotec Technologies, Hamburg, Germany). This instrument has been described in detail previously [29]. Samples were diluted in PBS or in MEA imaging buffer (see below) and loaded into 96-well plates. The sample was illuminated with a pulsed 633nm laser diode (Pico-quant) and imaged using an Olympus 60X 1.2NA water immersion objective and a confocal detection scheme. Fluorescence intensity traces were recorded and analyzed using the Evotec FCS++ analysis software. This yielded measurements of fluorescence brightness per particle and fluorescence lifetime for each sample.
(1.0 mg/mL, Sigma Aldrich) was first added to the coverslip, followed by 0.25 mg/mL streptavi-din (Life Technologies), and finally the DNA sample at a low concentration (*30 pM) in order to obtain a low surface density of DNA molecules such that individual molecules were well separated and optically resolvable from each other. The surface was rinsed with 10mM Tris-Cl (pH 7.5), 50mM NaCl solution prior to the addition of each reagent. MEA imaging buffer, described below, was added to the sample prior to imaging. Single molecule Neutravidin samples were prepared in a similar way. A biotinylated BSA solution was first added to the cov-erslip, followed by rinsing with Tris buffer, and then the neutravidin sample was added at a low concentration (*50 pM). Following a second rinsing step, the surface density of labeled neu-travidin molecules was low enough such that individual molecules were well separated and op-tically resolvable from each other. MEA imaging buffer, described below, was added to the sample prior to imaging.
Imaging bufferAll imaging experiments, including measurements of single molecule switching and STORM imaging, were carried out in MEA imaging buffer as previously de-scribed [19,28]. The imaging buffer consists of 50mM Tris-Cl (pH 8.0), 10mM NaCl, 10% Glu-cose (w/v), 10mMβ-mercaptoethylamine (pH 8.5, Sigma, 30070), and 1 of an enzymatic oxygen scavenger system stock solution. The oxygen scavenging system was added to the buffer immediately before use. The oxygen scavenger stock solution was prepared by mixing glucose oxidase powder (10 mg, Sigma, G2133) with catalase (50μL, 20 mg/mL, Sigma, C30) in PBS (200μL), and centrifuging the mixture at 13.000 rpm for 1 minute.
Fluorescent staining of cultured cellsFor experiments involving actin imaging, Vero cells were plated on coverslips and fixed in 4% paraformaldehyde for 10 minutes at room tempera-ture. The cells were permeabilized in 0.1% triton in PBS for 5 minutes, and then washed 3 times with blocking buffer (2% BSA in PBS) for 5 minutes. Cells were then labeled with biotin-xx phalloidin (Life Technologies, B7474) at 1:50 dilution in blocking buffer for 1 hour. Cells were rinsed with PBS 3 times for 5 minutes, and then labeled with fluorescent neutravidin (DOL 1.28) at a high dilution in blocking buffer for 1 hour. The cells were rinsed in PBS before mounting in imaging buffer and imaging.
For experiments involving tubulin imaging, Ptk2 cells were fixed with ice-cold methanol for 4 minutes, before washing 3 times for 5 minutes in blocking buffer. Cells were labeled with mouse anti-tubulin primary antibodies (Sigma T6074) at 1:100 dilution in PBS for 1 hour at room temperature, followed by 3 washes for 5 minutes in blocking buffer. The secondary anti-body was added at a high dilution in blocking buffer for 1 hour. The sample was rinsed in PBS before mounting in imaging buffer and imaging.
For fluorescent imaging of Nup153, Vero cells were fixed, permeabilized, and blocked as de-scribed above for the case of actin imaging. Cells were labeled with mouse anti-Nup153 prima-ry antibodies (Abcam ab24700) at 1:100 dilution in PBS for 1 hour at room temperature, followed by 3 washes for 5 minutes in blocking buffer. The sample was inclubated with the sec-ondary antibody in blocking buffer for 1 hour. The sample was rinsed in PBS before mounting in imaging buffer and imaging.
imaging we chose cells with low cytoplasmic GFP signal and excluded cells with aberrant nuclear shape.
MicroscopeAll imaging measurements were performed using a custom built inverted fluo-rescence microscope, similar to that described previously [31]. To summarize, an inverted fluo-rescence microscope stand (Olympus IX71) was fitted with a 100X oil-immersion objective lens (Olympus, UPLANSAPO100XO) which enabled efficient detection of single fluorophores. A custom-built focus lock system based on the reflection of an infra-red laser from the sample was used to maintain sample focus during all measurements. For STORM imaging, photo-switchable Alexa Fluor 647 was excited using 642 nm light, and in some measurements the sample was also exposed to 405 nm light to increase the activation rate of switching. A solid-state diode laser (Oxxius) was used to generate 405 nm light, and a fiber laser (MPB Communi-cations, 2RU-VFL-P-1500-642) was used to generate 642 nm light. The laser illumination was configured such that the illumination angle could be varied between an epi-illumination geom-etry and a total internal reflection (TIRF) illumination mode. For STORM data acquisition, the sample was illuminated with oblique illumination (not TIRF) for reduced background signal. Fluorescence emission of Alexa Fluor 647 was filtered using a dichroic mirror (Chroma, Z660DCXRU) and a bandpass emission filter (Chroma, ET700/75). Fluorescence was detected using an EMCCD camera (Andor Technology, Ixon DU897).
Imaging of IgERBL cells were seeded on aminosilane coverslips in Lab-Tek eight-well chambers (Nunc). The cells were then incubated for 60 min. at 37°C with 1μg/mL Alexa Fluor 647-conjugated IgE with a dye/antibody ratio of 1.5. Subsequently, cells were rinsed thrice for 5 min. in Phosphate Buffered Saline (PBS). Then, the cells were fixed in 4.0% (wt/vol) parafor-maldehyde and 0.2% glutaraldehyde in phosphate-buffered saline (PBS) for 60 min at room temperature, after which they were rinsed twice for 5 min. with 10 mM Tris and stored in PBS for imaging. Right before imaging, the cells were immersed in an imaging buffer consisting of 450μL 10% (w/v) glucose in 50 mM Tris, 10 mM NaCl, pH 8.5; 50μL oxygen scavenger buffer [14040U catalase (C9322-1G, Sigma Aldrich), 1688U glucose oxidase (G2133-50KU, Sigma Al-drich) in 50 mM Tris, 10 mM NaCl, pH 8.5; 5μL 1M mercaptoethylamine (MEA), pH 8.5. The
IgE samples were imaged with an epifluorescence microscope setup, consisting of an inverted microscope (IX71, Olympus), a 1.45-NA TIRF objective (U-APO 150X NA 1.45, Olympus), a 637-nm diode laser (HL63133DG, ThorLabs, with home built collimation optics) and an EMCCD camera (iXon 897, Andor) with EM gain set to 200. Samples were mounted into a 3D piezo stage (Nano-LPS100, Mad City Labs). For sample illumination and emission, a quad-band dichroic and emission filter set was used (FF01-446/523/600/677-25, Semrock). Images were taken in a TIRF configuration at 57 frames per second for 33,000 frames.
Data analysis methods
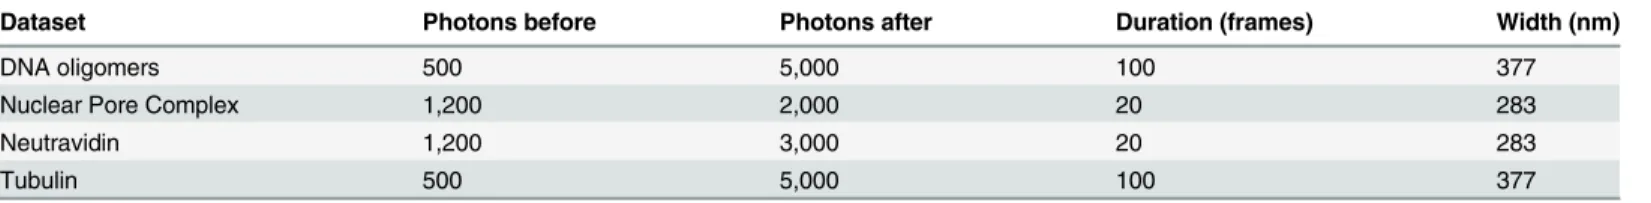
Localization analysisIdentification of regions of interest and estimation of the fluorophores’
width at half maximum. An overview of filter values is shown inTable 1. Photon count thresh-olds were chosen relatively high to filter out localizations due to sample contaminations for ob-taining accurate results in the cluster analyses (S6 Fig). Localizations were finally corrected for lateral stage drift using frame-by-frame cross-correlation, as documented elsewhere [28,34].
Estimating the correlation parameter QThe first step towards estimating the number of localizations per marker consists of estimating the spurious correlation parameterQat various points in time; typically 30 time points were used. The first steps of this estimation ofQwere the same as done previously [18] and culminate in the determination of the numeratorν(q) of the Fourier Ring Correlation (FRC) for spatial frequenciesq= 1/L, 2/L,. . .(Lis the size of the field of view). Briefly, the full set of estimated fluorophore positions is divided into two inde-pendent subsets. This yields two sub-imagesf1ð~rÞandf2ð~rÞ, where~rdenotes the spatial
coordi-nates. Subsequently the Fourier transforms of those images,^f1ð Þ~q and^f2ð Þ~q respectively, are
computed. The statistical correlation between those Fourier transforms is then evaluated over pixels on the perimeter of circles in Fourier space with radiusq:
nðqÞ ¼
1 2pqL
X
~q2circle ^
f1ð~qÞ^f2ð~qÞ
; ð5Þ
At high spatial frequenciesq,ν(q) is dominated by spurious correlations due to multiple locali-zations of the same site. Thus, the spurious correlation parameterQis computed byfittingν(q) with the following model function [18]:
Hðq;sm;DsÞ ¼ ffiffiffiffiffiffiffiffiffiffiffiffiffiffiffiffiffiffiffiffiffiffiffiffiffiffiffi1
1þ8p2Ds2q2
p exp
4p2s2mq2
1þ8p2Ds2q2
sincðqÞ2: ð6Þ
This function describes the theoretical decay of the spurious correlations, assuming that the uncertaintiesσof localizations follow a normal distributed with unknown meanσmand
stan-dard deviationΔσ.
The actual fit toν(q) is obtained using a novel method which involves the minimization of the cost function:
CnðQ;sm;DsÞ ¼
X
q
exp ðnðqÞ QHðq;sm;DsÞÞ
2
d2Q2Hðq;s
m;DsÞ
2 !
ð7Þ
wheredwas chosen to be 0.1. The rationale behind this cost function is that it promotes pa-rameters for whichν(q)/H(q) is constant for a large range of spatial frequencies. This objective was used in our previous work as a requirement for the manually provided parametersσmand Δσ[18]. The search for parametersQ,σmandΔσthat minimizeCνwas done with the
Nelder-Table 1. Parameters used for filtering localization events.Localizations were filtered for the minimum number of photons per event before grouping, mini-mum number of photons per event after grouping, the maximini-mum duration of the event after grouping, and the maximini-mum width (FWHM) of the Gaussian fitted to the spot.
Dataset Photons before Photons after Duration (frames) Width (nm)
DNA oligomers 500 5,000 100 377
Nuclear Pore Complex 1,200 2,000 20 283
Neutravidin 1,200 3,000 20 283
Tubulin 500 5,000 100 377
Mead simplex algorithm. This algorithm was initialized two times, where the starting values for the second optimization were randomly perturbed with respect to thefirst.
For each timet, this procedure of dividing localizations into subsets, computingν(q) and fit-ting it to obtain values forQ,σmandΔσwas repeated five or ten times with randomly perturbed
initial values forσmandΔσ. The median of the different estimates ofQ(t) at each timetwas then taken to obtain a robust estimation result forQ(t).
Estimating the number of localizations per labeled siteAfter the correlation parameterQ
(t) is obtained at various time pointst, the next step in estimating the number of localizations per labeled siteMinvolves a simultaneous model fit toQ(t) and the cumulative number of lo-calizationsN(t). This is achieved by minimizing the cost function:
CQðM1;kbl;N1Þ ¼
X
t
ðNðtÞ NmodelðtÞÞ
2
NmodelðtÞNmodelðtendÞ
ðQðtÞ QmodelðtÞÞ
2
QmodelðtendÞ
2
( )
ð8Þ
where the sum runs over all timestfor which the spurious correlation parameter was estimat-ed,tendis the total acquisition time, and:
NmodelðtÞ ¼N1ð1 expð kbltÞÞ ð9Þ
QmodelðtÞ ¼2M1 1
kblt
expðkbltÞ 1
þmM1ð1 expð kbltÞÞ: ð10Þ
OptimizingCQwas again performed using the Nelder-Mead simplex algorithm. The parameter
μwas a separate manual input for the optimization for the purpose of this work, obtained from a calibration detailed below. Thefitted valuesM1andkblare used to obtain thefinal estimate:
MðtÞ ¼ hSiM1ð1 expð kbltÞÞ ð11Þ
where the average number of emitters per labeled sitehSiwas obtained from the same calibra-tion asμ. Potentially,μcould be obtained from afit ofQ(t), completely eliminating the need for calibration experiments. It turned out, however, that for the datasets we considered this could not be done reliably, possibly due to residual errors in extractingQ(t) from the data or
flaws in the switching model.
Calibration of the labeling stoichiometryThe stoichiometry parameterμwas calibrated for the Neutravidin data as follows. The localizations obtained for the datasets of Neutravidin on glass were clustered as described below. Subsequently, clusters were discarded if there was another cluster within a square region of 7 CCD pixels around each of them. For the remaining clusters, the site was localized in the first frame of the raw sequence to accurately determine the number of signal photonsBof the site in that frame. If we assume that each fluorophore is ac-tive during the entire first frame, then computing the average and variance of the brightness over the found clusters provides the following equalities:
hBi ¼ hBsingleihSi ð12Þ
hB2i hBi ¼
hB2
singlei
hBsinglei
þ hBsingleim ð13Þ
Here,Bsingleis the brightness of a single emitter. For small DOL values it is assumed that the
la-beling is described by Poisson statistics givingμDOL andhSi DOL/ (1−exp(−DOL)). A linearfit on the data points forhBiwith DOL<2 gives values forhBsinglei, which are
points forhB2i/hBifor DOL<2 is used tofind the parameters needed to computeμfor all DOL-values. It appears that the value forhBsingleifitted fromEq 13is a factor 1.4 higher than
the valuefitted fromEq 12, possibly due to a bias in the clustering procedure or due to a break-down of the Poisson assumption. Bleaching in the initial switching-off phase of the data acqui-sition may introduce a small bias in the calibration procedure towards higher values ofhSiand μ(relative error at most about 1/M1).
In an alternative calibration approach, the markers were analyzed in solution with Fluores-cence Correlation Spectroscopy (FCS). The brightness per marker can be analyzed to find val-ues forhSijust as done for the cluster brightness analysis. Values for the stoichiometry parameterμare found by inverting the Poisson relationhSi=μ/((1−exp(−μ))), which gives rise to biases in the quenching regime DOL>2.
Cluster analysisThe ground truth for the distribution of the number of emitters per labeled site for the data ofFig 1c(DNA oligomers) andFig 3a(neutravidin tetramers) was established from the following steps. First, an image was created in which each localization was rendered as a Gaussian blob with a maximum of 1 and a standard deviation equal to the localization un-certainty obtained from the localization algorithm. The pixel size in these images was 8 nm. Subsequently, these images were thresholded at a value of 10−3, 8-connected regions of nonzero
pixels were identified and the localizations in these regions were assigned to clusters. For each cluster, the center position was determined using weighted-least squares estimation. The sum of squared Mahalanobis distances from the localizations to their cluster centers was then com-puted and clusters where this sum was significantly larger than expected for a sum of Gaussian localization errors (at statistical significance level of 10−3) were discarded for further analysis.
Finally, clusters without localizations before a specified time threshold were discarded on the suspicion that they were due to sample contaminations rather than fluorophores (S3 Fig); for the DNA oligomer data the threshold was at 10,000 frames, for the Neutravidin data at the 95 percentile value of the times between localizations in clusters. The remaining clusters of locali-zations were considered to be localilocali-zations of the same labeled site.
For the somewhat denser tubulin samples a different clustering method was found more suitable, based on nearest-neighbor linking. Localization events are considered as belonging to the same cluster if their relative distancej~rj<R2s, withσthe localization uncertainty. The likelihood of localizing an emitter at position~rfrom the true emitter position is a Gaussian in x and y with standard deviationσ. Therefore the likelihood of two localizations of the same emit-ters at relative position~ris a Gaussian in x and y with standard deviationpffiffiffi2s, as follows by
convolution of the two individual Gaussian likelihood functions. It follows then that the likeli-hood of two localizations of the same emitters at relative distancej~rj<Ris:
Pðj~rj<RÞ ¼1 expð R2=4
s2Þ ð14Þ
nm, i.e. close toR= 2σ. This value is somewhat higher than the precision of 3.0 nm found from the localization procedure, probably due to residual drift correction errors.
Supporting Information
S1 Text. Theoretical derivations.Theoretical results for the three-state activation-bleaching-model for single fluorophores, the number of activations per fluorophore in a mixed Poisson-geometric probability distribution, the effect of labeling stoichiometry, the estimation of the correlation parameterQat high labeling density, and the effect of false negative localizations. (PDF)
S1 Fig. Linearity of switching kinetics.(a) Empirical distributions of the on- and off-times, re-spectivelytonandtoff, of individual fluorophores were obtained for the data of DNA oligomers
labeled with single Alexa Fluor 647 dyes on a glass substrate shown inFig 1.tonwas determined
by finding all localizations belonging to the same activation event and determining the time be-tween the first and last localization. (b) The sum of estimated signal photonsnphotonsfrom the
combined localizations shows a single exponential distribution. (c)toffwas determined as the
time interval between subsequent localizations of the same fluorophore as determined by clus-ter analysis. The distribution oftonis mono-exponential, the distribution oftoffis reasonably
described with a single exponential distribution but possibly also by a bi-exponential distribu-tion, which can possibly be attributed to residual effects of sample contaminations.
(EPS)
S2 Fig. Stoichiometry calibration and characterization of neutravidin tetramers labeled with multiple Alexa Fluor 647 labels.(a) Average number of labels per neutravidin tetramer and (b) stoichiometry parameterμas a function of DOL calibrated from cluster brightness sta-tistics and FCS measurements for Phosphate Buffered Saline (PBS) and Oxygen Scavenging Buffer (OSB). Both indicate labeling according to Poisson statistics for DOL values below about 2 and significant quenching effects for higher DOL values. (c) The photon rate during on-events and the photon count per on-event (i.e. localization) do not depend on DOL. This indicates that single emitters are observed in the detected on-events and the brightness and off-switching of these emitters are not affected by nearby emitters on the same tetramer. (d) The time between localizations of the same neutravidin tetramer decreases with DOL indicating that multiple fluorescent labels are observed per tetramer for higher DOL.
(EPS)
S3 Fig. Sensitivity of estimation to the calibration ofμ.The plots show how the estimated
number of localizations per siteMfor the sparse neutravidin datasets fromFig 3would change with the value ofμused to fit the correlation parameterQ(t). Each plot represents the datasets at one DOL value; each solid line represents a single dataset with a red circle indicating the value forμand resultingMshown inFig 3. For all estimates per DOL,hSiwas kept constant. The estimate ofMdoes not vary more than 10% for changes inμsmaller than 1, suggesting that the estimation ofMis quite robust with respect to possible errors in the calibration proce-dure forμ.
(EPS)
S4 Fig. Additional examples of quantitative localization microscopy with multiple emitters per labeled site.(a) Image of neutravidin-biotin-phalloidin labeled actin. Note that the switch-ing model parameterskbl= 5.3 × 10⁻³/s andM1=ksw/kbl= 3.1 that were found differed a
parameters, as is done in e.g. kymograph analysis. Pixel size: 4 nm. (b) Image of a tubulin con-trol samples labeled using secondary antibodies. The secondary to primary DOL was kept low such that most primary antibodies only had a single secondary antibody to enable a compari-son to a cluster analysis based ground truth. Analyzing these data assuming a stoichiometry pa-rameterμ= DOL = 1.2 and an average number of emitters per sitehSi= DOL/ [1−exp (−DOL)] resulted inkbl= 8.7 × 10⁻³/s andM1= 8.4. Counting estimates on this sample and
similar samples for varying numbers of Alexa Fluor 647 fluorophores per antibody gave a RMSE of approximately 10%. Note that for non-sparse secondary antibody labeling there may be a reduced need to calibrate the secondary to primary antibody labeling stoichiometry (see
S1 Textsection 3,S5 Fig). Pixel size: 4 nm. (EPS)
S5 Fig. Effect of primary and secondary DOL on counting outcome.The plots show the re-sults of an analysis on the dataset of tubulin labeled with a secondary antibody (AB) labeling scheme shown in Fig. 3 of our previous work [18]. The secondary antibodies were conjugated to either Alexa Fluor 647 or Alexa Fluor 750 dyes. The secondary to primary DOLμ1and
fluor-ophore to secondary DOLμ2were unknown. Thus we investigated how the estimate of the
number of localizations per primary antibody would change with different assumptions forμ1
andμ2. The measured cumulative number of localizations was fit for the bleaching rate and the
correlation parameterQwas fit for a range of values for the unknown parametersμ1andμ2,
as-suming the Poissonian stoichiometry model described inS1 Textsection 3. It appears that the exact value of the secondary to primary DOLμ1has a very small effect on the final outcome of
the counting procedure provided it is larger than about 1.5. The secondary DOL has a bigger impact on the estimate implying that a calibration of the secondary DOL via e.g. absorption spectroscopy or FCS is advisable.
(EPS)
S6 Fig. Characterization of sample contaminations.The data of DNA oligomers labeled with single Alexa Fluor 647 dyes inFig 1were compared to data from a control sample without DNA oligomers. (a) The single frame brightness and (b) the total photons per“on-event”(i.e. after combining localizations in consecutive frames) in the unlabeled sample are somewhat lower. (c) The off-timestoffbetween localizations in the labeled sample have the same
distribu-tion as the timestfirstof the first localizations in the (retained) clusters used for counting.
Clus-ters that were discarded in the counting analysis (i.e. withtfirst>82.5 s or only localizations
with less than 5,000 photons) show a substantially different distribution. These clusters are at-tributed to sample contaminations and have substantially fewer localizations associated with them than localizations that were retained in the cluster analysis forFig 1(see (d)).
(EPS)
Acknowledgments
We thank Diane Lidke and Hannah Johnson for help in sample preparation.
Author Contributions
References
1. Betzig E, Patterson GH, Sougrat R, Lindwasser OW, Olenych S, Bonifacino JS, et al. Imaging Intracel-lular Fluorescent Proteins at Nanometer Resolution. Science. 2006; 313(5793):1643–1645.
2. Rust MJ, Bates M, Zhuang X. Sub-diffraction-limit imaging by stochastic optical reconstruction micros-copy (STORM). Nat Methods. 2006; 3(10):793–795. doi:10.1038/nmeth929PMID:16896339
3. Hess ST, Girirajan TPK, Mason MD. Ultra-high resolution imaging by fluorescence photoactivation lo-calization microscopy. Biophys J. 2006; 91(11):4258–4272. doi:10.1529/biophysj.106.091116PMID:
16980368
4. Fölling J, Bossi M, Bock H, Medda R, Wurm CA, Hein B, et al. Fluorescence nanoscopy by ground-state depletion and single-molecule return. Nat Methods. 2008; 5:943–945. doi:10.1038/nmeth.1257
PMID:18794861
5. Heilemann M, van de Linde S, Schüttpelz M, Kasper R, Seefeldt B, Mukherjee A, et al. Subdiffraction-Resolution Fluorescence Imaging with Conventional Fluorescent Probes. Angew Chem Int Ed Engl. 2008; 47(33):6172–6176. doi:10.1002/anie.200802376PMID:18646237
6. Lando D, Endesfelder U, Berger H, Subramanian L, Dunne PD, McColl J, et al. Quantitative single-mol-ecule microscopy reveals that CENP-ACnp1 deposition occurs during G2 in fission yeast. Open Biol. 2012; 2:120078. doi:10.1098/rsob.120078PMID:22870388
7. Wang S, Moffitt JR, Dempsey GT, Xie S, Zhuang X. Characterization and development of photoactiva-table fluorescent proteins for single-molecule-based superresolution imaging. Proc Natl Acad Sci U S A. 2014; 111(23):8452–8457. doi:10.1073/pnas.1406593111PMID:24912163
8. Annibale P, Vanni S, Scarselli M, Rothlisberger U, Radenovic A. Identification of clustering artifacts in photoactivated localization microscopy. Nat Methods. 2011; 8(7):527–528. doi:10.1038/nmeth.1627
PMID:21666669
9. Lee SH, Shin JY, Lee A, Bustamante C. Counting single photoactivatable fluorescent molecules by photoactivated localization microscopy (PALM). Proc Natl Acad Sci U S A. 2012; 109(43):17436– 17441. doi:10.1073/pnas.1215175109PMID:23045631
10. Puchner EM, Walter JM, Kasper R, Huang B, Lim WA. Counting molecules in single organelles with superresolution microscopy allows tracking of the endosome maturation trajectory. Proc Natl Acad Sci U S A. 2013; 110(40):16015–16020. doi:10.1073/pnas.1309676110PMID:24043832
11. Nan X, Collisson EA, Lewis S, Huang J, Tamgüney TM, Liphardt JT, et al. Single-molecule superresolu-tion imaging allows quantitative analysis of RAF multimer formasuperresolu-tion and signaling. Proc Natl Acad Sci U S A. 2013; 110(46):18519–18524. doi:10.1073/pnas.1318188110PMID:24158481
12. Durisic N, Laparra-Cuervo L, Sandoval-Álvarez A, Borbely JS, Lakadamyali M. Single-molecule evalu-ation of fluorescent protein photoactivevalu-ation efficiency using an in vivo nanotemplate. Nat Methods. 2014; 11(2):156–162. doi:10.1038/nmeth.2784PMID:24390439
13. Dempsey GT, Vaughan JC, Chen KH, Bates M, Zhuang X. Evaluation of fluorophores for optimal per-formance in localization-based super-resolution imaging. Nat Methods. 2011; 8(12):1027–1031. doi:
10.1038/nmeth.1768PMID:22056676
14. Grussmayer KS, Kurz A, Herten DP. Single-Molecule Studies on the Label Number Distribution of Fluo-rescent Markers. Chemphyschem. 2014; 15(4):734–742. doi:10.1002/cphc.201300840PMID:
24677641
15. Ehmann N, van de Linde S, Alon A, Laschenko D, Keung XZ, Holm T, et al. Quantitative super-resolu-tion imaging of Bruchpilot distinguishes active zone states. Nat Commun. 2014; 5 (4650). doi:10.1038/ ncomms5650PMID:25130366
16. Sengupta P, Jovanovic-Talisman T, Skoko D, Renz M, Veatch SL, Lippincott-Schwartz J. Probing pro-tein heterogeneity in the plasma membrane using PALM and pair correlation analysis. Nat Methods. 2011; 8(11):969–975. doi:10.1038/nmeth.1704PMID:21926998
17. Veatch SL, Machta BB, Shelby SA, Chiang EN, Holowka DA, Baird BA. Correlation functions quantify super-resolution images and estimate apparent clustering due to over-counting. PLoS One. 2012; 7(2): e31457. doi:10.1371/journal.pone.0031457PMID:22384026
18. Nieuwenhuizen RPJ, Lidke KA, Bates M, Leyton Puig D, Grünwald D, Stallinga S, et al. Measuring Image Resolution in Optical Nanoscopy. Nat Methods. 2013; 10(6):557–562. doi:10.1038/nmeth.2448
PMID:23624665
19. Bates M, Blosser TR, Zhuang X. Short-range spectroscopic ruler based on a single-molecule optical switch. Phys Rev Lett. 2005; 94(10):108101. doi:10.1103/PhysRevLett.94.108101PMID:15783528
21. Cronshaw JM, Krutchinsky AN, Zhang W, Chait BT, Matunis MJ. Proteomic analysis of the mammalian nuclear pore complex. J Cell Biol. 2002; 158(2):915–927. doi:10.1083/jcb.200206106PMID:
12196509
22. Ori A, Banterle N, Iskar M, Andres-Pons A, Escher C, Bui HK, et al. Cell type-specific nuclear pores: a case in point for context-dependent stoichiometry of molecular machines. Mol Syst Biol. 2013; 9 (1):648. doi:10.1038/msb.2013.4PMID:23511206
23. Bui KH, von Appen A, DiGuilio AL, Ori A, Sparks L, Mackmull MT, et al. Integrated Structural Analysis of the Human Nuclear Pore Complex Scaffold. Cell. 2013; 155(6):1233–1243. doi:10.1016/j.cell.2013. 10.055PMID:24315095
24. Kasha M, Rawls HR, El-Bayoumi MA. The exciton model in molecular spectroscopy. Pure Appl Chem. 1965; 11(3–4):371–392.
25. Rösch U, Yao S, Wortmann R, Würthner F. Fluorescent H-Aggregates of Merocyanine Dyes. Angew Chem Int Ed Engl. 2006; 118(42):7184–7188. doi:10.1002/ange.200602286
26. Bollmann S, Löllmann M, Sauer M, Doose S. Dimer formation of organic fluorophores reports on biomo-lecular dynamics under denaturing conditions. Phys Chem Chem Phys. 2011; 13(29):12874–12882. doi:10.1039/c1cp21111kPMID:21687885
27. Espinoza FA, Oliver JM, Wilson BS, Steinberg SL. Using Hierarchical Clustering and Dendrograms to Quantify the Clustering of Membrane Proteins. Bull Math Biol. 2012; 74(1):190–211. doi:10.1007/ s11538-011-9671-3PMID:21751075
28. Bates M, Huang B, Dempsey GT, Zhuang X. Multicolor super-resolution imaging with photo-switchable fluorescent probes. Science. 2007; 317(5845):1749–53. doi:10.1126/science.1146598PMID:
17702910
29. Kask P, Palo K, Fay N, Brand L, Mets U, Ullmann D, et al. Two-Dimensional Fluorescence Intensity Dis-tribution Analysis: Theory and Applications. Biophys J. 2000; 78(4):1703–1713. doi: 10.1016/S0006-3495(00)76722-1PMID:10733953
30. Szymborska A, de Marco A, Daigle N, Cordes VC, Briggs JAG, Ellenberg J. Nuclear Pore Scaffold Structure Analyzed by Super-Resolution Microscopy and Particle Averaging. Science. 2013; 341 (6146):655–658. doi:10.1126/science.1240672PMID:23845946
31. Bates M, Dempsey GT, Chen KH, Zhuang X. Multicolor Super-Resolution Fluorescence Imaging via Multi-Parameter Fluorophore Detection. ChemPhysChem. 2012; 13:99–107. doi:10.1002/cphc. 201100735PMID:22213647
32. Smith CS, Joseph N, Rieger B, Lidke KA. Fast, single-molecule localization that achieves theoretically minimum uncertainty. Nat Methods. 2010; 7(5):373–375. doi:10.1038/nmeth.1449PMID:20364146
33. Huang F, Schwartz SL, Byars JM, Lidke KA. Simultaneous multiple-emitter fitting for single molecule super-resolution imaging. Biomed Opt Express. 2011; 2(5):1377–1393. doi:10.1364/BOE.2.001377
PMID:21559149
34. Mlodzianoski MJ, Schreiner JM, Callahan SP, Smolkova K, Dlaskova A, Santorova J, et al. Sample drift correction in 3D fluorescence photoactivation localization microscopy. Opt Express. 2011; 19