www.ann-geophys.net/32/1035/2014/ doi:10.5194/angeo-32-1035-2014
© Author(s) 2014. CC Attribution 3.0 License.
Difference between even- and odd-numbered cycles in the
predictability of solar activity and prediction of the
amplitude of cycle 25
A. Yoshida
Shizuoka University, 836, Ohya, Suruga-ku, Shizuoka, 422-8529, Japan
Correspondence to: A. Yoshida ([email protected])
Received: 23 January 2014 – Revised: 24 April 2014 – Accepted: 17 July 2014 – Published: 25 August 2014
Abstract. It was shown previously that the sunspot number (SSN) at a point 3 years before the minimum is well corre-lated with the maximum SSN of the succeeding cycle, and a better correlation is obtained when the maximum SSN is replaced by the average SSN over a cycle for which the av-erage SSN is calculated by dividing cycles at a point 3 years before the minimum (Yoshida and Yamagishi, 2010; Yoshida and Sayre, 2012). Following these findings, we demonstrate in this paper that the correlation between the SSN 3 years before the minimum and the amplitude of the coming cy-cle differs significantly between even-numbered and odd-numbered cycles: the correlation is much better for even-numbered cycles. Further, it is shown that the amplitude of even-numbered cycles is strongly correlated with that of the succeeding odd-numbered cycles, while the correlation be-tween amplitudes of odd-numbered cycles and those of suc-ceeding even-numbered cycles is very poor. Using the excel-lent correlations, we estimate the maximum SSN of the cur-rent cycle 24 at 81.3 and predict the maximum SSN of cycle 25 to be 115.4±11.9. It is of note, however, that a peak of the SSN has been observed in February 2012 and the peak value 66.9 is considerably smaller than the estimated maxi-mum SSN of cycle 24. We conjecture that the second higher peak of the SSN may appear.
Keywords. Solar physics, astrophysics, and astronomy (general or miscellaneous)
1 Introduction
Knowing solar activity in advance is an important issue not only for space-weather researchers who are in charge of giv-ing a warngiv-ing to astronauts operatgiv-ing in outer space but also
for solar physicists who study the solar-dynamo theory and state administrators who are responsible for making space-exploring plans. Nowadays, climatologists also have strong interests in the change of solar activity, if any sign indicat-ing approach of a Little Ice Age is observed. Consequently, a large number of studies have been carried out trying to pre-dict the amplitude of coming solar cycles. Since the under-lying key factor that brings about the around 11-year-period variation of solar activity is still not elucidated, most of the studies are inevitably empirical ones based on various kinds of proxies that show relatedness to the amplitude of the com-ing cycle (e.g., Pesnell, 2008).
Maximum SSN Maximum SSN
8 8
CC 0.717 CC 0.946
(a) (b)
Average SSN Average SSN
8
8
8
8
CC 0.738 CC 0.956
(c) (d)
SSN at a point 3 years before the minimum SSN at a point 3 years before the minimum
SSN at a point 3 years before the minimum SSN at a point 3 years before the minimum
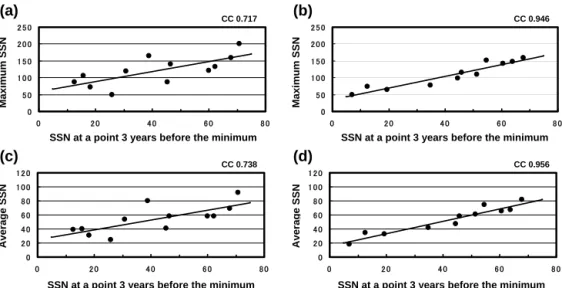
Figure 1. (a) Scatterplot of maximum SSN versus SSN 3 years before the minimum for odd-numbered cycles. (b) Same as panel (a) but for even-numbered cycles. The correlation coefficient and its lower and upper limits of the 95 % confidence interval are 0.717, 0.243 and 0.921 for the former case, while those for the latter case are 0.946, 0.800 and 0.986, respectively. (c) Scatterplot of average SSN versus SSN 3 years before the minimum for odd-numbered cycles. (d) Same as panel (c) but for even-numbered cycles. The correlation coefficient and its lower and upper limits of the 95 % confidence interval are 0.738, 0.284 and 0.915 for the former case, while those for the latter case are 0.956, 0.833 and 0.989, respectively.
at a point 3 years before the minimum exhibits the strongest correlation. Yoshida and Sayre (2012), then, showed that a better correlation is obtained when the average SSN over a cycle is taken instead of the maximum SSN, and that the correlation coefficient becomes the largest when the average SSN is calculated by dividing cycles at a point 3 years before the minimum. They also showed that the correlation between the average SSN and the maximum SSN is also strongest for the average SSN thus calculated. Based on these findings, Yoshida and Sayre (2012) proposed that the average SSN is better than the maximum SSN as the representative of the amplitude of solar activity, and that a point 3 years before the minimum is the most appropriate point to define cycle’s start and end.
In this paper, we demonstrate that the correlation between the amplitude (the average or the maximum SSN) and the SSN at a point 3 years before the minimum differs signif-icantly depending on whether the succeeding cycle is an or an odd-numbered cycle: the correlation for even-numbered cycles is incomparably better than the correlation for odd-numbered cycles. Using the excellent correlations, we first estimate the average SSN of the current cycle 24, and then, predict the maximum SSN of cycle 25.
2 Difference in the predictability between even-and odd-numbered cycles
Figure 1a and b show scatterplots between the maximum SSN and the SSN at a point 3 years before the minimum for odd-numbered cycles and for even-numbered cycles,
respectively. The monthly smoothed SSN data are obtained from the Solar Influence Data Analysis Center (http://www. sidc.be/sunspot-data/). The correlation coefficient for odd-numbered cycles is 0.717, while that for even-odd-numbered cy-cles is 0.946. TheP value in the null hypothesis test for the former case is 0.00868, while that for the latter case is 1.085×10⁻⁵, respectively, indicating that the correlation for even-numbered cycles is accepted at a very high significance level. Figure 1c and d are the same as Fig. 1a and b except that the average SSN is taken instead of the maximum SSN. In this scatterplot as well, it is seen that the correlation for even-numbered cycles is much better, giving the correlation coefficient of 0.956 against that of 0.738 for odd-numbered cycles. The P value for odd-numbered cycles is 0.00618, while that for even-numbered cycles is 4.511×10⁻⁶, respec-tively, showing as well that the correlation for the latter case is highly significant. Here, it is to be noted that the aver-age SSN over a cycle is calculated by dividing solar cycles at a point 3 years before the minimum (Yoshida and Sayre, 2012). The average SSN thus calculated is most strongly cor-related with the SSN at the dividing point not only for even-numbered cycles but also for odd-even-numbered cycles.
8 8
Maximum SSN Maximum SSN
SSN at a point 3 years after the minimum SSN at a point 3 years after the minimum
CC 0.929 CC 0.989
(a) (b)
SSN at a point 3 years after the minimum SSN at a point 3 years after the minimum
Average SSN Average SSN
CC 0.928
(c) (d) CC 0.978
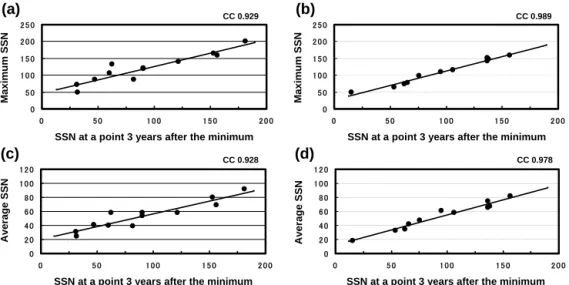
Figure 2. (a) Scatterplot of maximum SSN versus SSN 3 years after the minimum for odd-numbered cycles. (b) Same as panel (a) but for even-numbered cycles. The correlation coefficient and its lower and upper limits of the 95 % confidence interval are 0.929, 0.762 and 0.980 for the former case, while those for the latter case are 0.988, 0.955 and 0.997, respectively. (c) Scatterplot of average SSN versus SSN 3 years after the minimum for odd-numbered cycles. (d) Same as panel (c) but for even-numbered cycles. The correlation coefficient and its lower and upper limits of the 95 % confidence interval are 0.928, 0.759 and 0.980 for the former case, while those for the latter case are 0.978, 0.914 and 0.994, respectively.
at a point 3 years after the minimum for odd-numbered cy-cles and for even-numbered cycy-cles, respectively. It is seen that the correlation for even-numbered cycles (Fig. 2b) is very strong, carrying a correlation coefficient of 0.989. Al-though the scatterplot for odd-numbered cycles is a bit more dispersive, the correlation is also strong, giving a correla-tion coefficient of 0.929. The P value for even-numbered cycles is 1.051×10⁻⁸and that for odd-numbered cycles is 1.231×10⁻⁵, respectively, indicating that both of the cor-relations are accepted at a very high significance level. Fig-ure 2c and d are the same as Fig. 2a and b except that the average SSN is taken instead of the maximum SSN. The cor-relation coefficient for odd-numbered cycles is 0.928, while that for even-numbered cycles is 0.978, and the P value is 1.309×10⁻⁵and 2.015×10⁻⁷for odd-numbered and even-numbered cycles, respectively. Therefore, it can be said that the so-called Waldmeier effect, though it is a bit clearer for numbered cycles, is well recognized for both even-numbered and odd-even-numbered cycles. It is of note here that, in the correlation between the average SSN and the SSN at a point 3 years after the minimum, the best correlation is ob-tained when the average is calculated by dividing cycles at a point 3 years before the minimum, not at a point 3 years after. This fact supports our previously presented idea that a point 3 years before the minimum is the most appropriate point to define the beginning and end of the solar cycle (Yoshida and Sayre, 2012).
In summarizing the above-described results, we would like to emphasize that significant difference seems to exist in the predictability of the amplitude of the coming cycle between even-numbered and odd-numbered cycles: the amplitude of
even-numbered cycles is predicted with a higher precision than that of odd-numbered cycles.
Cameron and Schussler (2007a, b, 2008) presented an idea that most well-known correlations between precursors and following cycle amplitude are explained by cycle asymme-try and cycle overlapping, where the Waldmeier effect, the larger the rate of increase of the SSN in the early stage of cycle, the larger the amplitude of the cycle, plays an essen-tial role. If this is the case, the solar cycle amplitudes may constitute a purely random sequence whereby the amplitude is decided only by how fast the SSN increases from mini-mum (Cameron and Schussler, 2008). Our finding that cor-relations between the average SSN over a cycle and either of the SSN at a point 3 years before and 3 years after the minimum become strongest when the average is calculated by dividing cycles at a point 3 years before the minimum (Yoshida and Sayre, 2012) may be considered to support the idea. However, we think something more might be hidden in the observation of the significant difference in the corre-lations between even-numbered and odd-numbered cycles. The observation that the amplitude of even-numbered cycles is well correlated with the amplitude of the succeeding odd-numbered cycles (see Fig. 4) also seems to suggest existence of a kind of inter-cycle relation.
8
8 8
Average SSN
of northern hemi.
CC 0.765 (a)
Average SSN
of sout
hern hem.
CC 0.444 (b)
Average SSN of the w
h
ole
CC 0.966 (c)
SSN at a point 3 years after the minimum
SSN at a point 3 years after the minimum
SSN at a point 3 years after the minimum
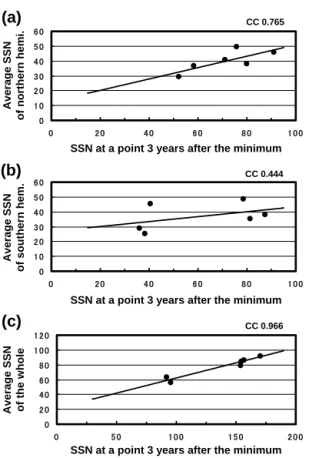
Figure 3. (a) Scatterplot of average SSN versus SSN 3 years after the minimum for the data of Northern Hemisphere. (b) Same as panel (a) but for the data of Southern Hemisphere. (c) Same as (a) but for the data of the whole sphere. The correlation coefficient and its lower and upper limits of the 95 % confidence interval are 0.764,
−0.123 and 0.972 for the case (a), 0.444,−0.574 and 0.923 for the case (b), and 0.966, 0.717 and 0.996 for the case (c), respectively. In these plots we used the SSN data during cycles 18 to 23 obtained by the National Astronomical Observatory of Japan by obtaining 13-month averages.
into Northern and Southern hemispheres, and found that the “Waldmeier effect” is not seen for either data.
We examined if the Waldmeier effect, in the sense of that by Cameron and Schussler (2008), is recognized in the hemi-sphere SSN data. Figure 3a, b, and c show scatterplots of average SSN versus SSN 3 years after the minimum for the SSN of Northern and Southern hemispheres and that of the whole sphere, respectively, where average SSNs are calcu-lated by dividing the cycle changes at a point 3 years before each of the minima. In the analysis we used the SSN data during cycles 18 to 23 obtained by the National Astronomical Observatory of Japan by obtaining 13-month averages. It is apparently seen that the correlation for the SSN of the whole sphere is strongest, that for the Northern Hemisphere SSN is the next, and that for the Southern Hemisphere SSN is weak-est. The correlation coefficient is 0.765, 0.444 and 0.966 for the Northern Hemisphere SSN, for the Southern Hemisphere SSN, and for the SSN of the whole sphere, respectively, and
theP value for each of the correlations is 0.0765, 0.378 and 0.002. Therefore, only the correlation (the Waldmeier effect) is not denied for the SSN of the whole sphere at a confidence level of 1 %.
Having made separate simulations of sunspot cycles for Northern and Southern hemispheres by using the flux-transport dynamo prediction scheme (Dikpati et al., 2006), Dikpati et al. (2007) found that the skill level was only slightly lowered. Belucz and Dikpati (2013), who conducted simulations of solar cycles by changing properties of merid-ional circulation only in the south, obtained results that the Northern Hemisphere experienced virtually no change in spite of all the changes that occurred in the Southern Hemi-sphere. These results of simulations suggest that the north and the south are linked very weakly and that many of solar cycle characteristics within a hemisphere can be reproduced from information from previous cycles only from that hemi-sphere (Dikpati et al., 2007).
Our results that the Waldmeier effect is apparently stronger for the SSN of Northern Hemisphere than that for the SSN of Southern Hemisphere may indicate that the dy-namo in the two hemispheres is conducted independently as was indicated in simulations by Belucz and Dikpati (2013). And the finding that the Waldmeier effect is significant only when the SSNs of the whole sphere are analyzed may sug-gest that the effect is not a manifestation of some elementary dynamo process, but it is a phenomenon which appears by a “coarse-grained” overview.
8
8 Maximum SSN of even cycle
8
8
8
8 CC 0.393
(a) (b)
Average SSN of even cycle Average SSN of odd cy
c
le
8
8
8
8
CC 0.537 CC 0.985
(c) (d)
Maximum SSN of even cycle Maximum SSN of odd cy
c
le
8 8
CC 0.436 CC 0.986
(e) (f)
CC 0.972
Maximum SSN of odd cy
c
le
Maximum SSN of the preceding odd cycle Maximum SSN of the preceding even cycle
Average SSN of the preceding odd cycle Average SSN of the preceding even cycle
Average SSN of the preceding odd cycle Average SSN of the preceding even cycle
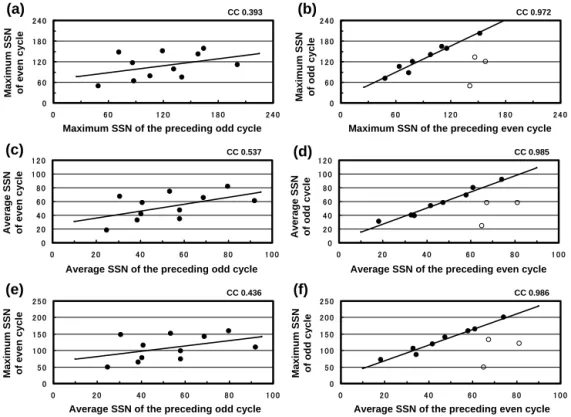
Figure 4. (a) Scatterplot of maximum SSN of even-numbered cycles versus maximum SSN of the preceding odd-numbered cycles. Panel (b) is the same as panel (a) but for odd- and the preceding even-numbered cycles. White circles represent outliers in the correlation. The correlation coefficient and its lower and upper limits of the 95 % confidence interval are 0.393,−0.271 and 0.803 for the former case, while those for the latter case except three outliers are 0.972, 0.848 and 0.995, respectively. (c) Scatterplot of average SSN of even-numbered cycles versus average SSN of the preceding odd-numbered cycles. Panel (d) is the same as panel (c) but for odd- and the preceding even-numbered cycles. White circles represent outliers in the correlation. The correlation coefficient and its lower and upper limits of the 95 % confidence interval are 0.537,−0.093 and 0.860 for the former case, while those for the latter case except three outliers are 0.985, 0.917 and 0.997, respectively. (e) Scatterplot of maximum SSN of even-numbered cycles versus average SSN of the preceding odd-numbered cycles. Panel (f) is the same as panel (e) but for odd- and the preceding even-numbered cycles. White circles represent outliers in the correlation. The correlation coefficient and its lower and upper limits of the 95 % confidence interval are 0.436,−0.221 and 0.821 for the former case, while those for the latter case except three outliers are 0.986, 0.920 and 0.998, respectively.
We do not know at present the reason why outliers appear in the strong relationship between the amplitude of an even-numbered cycle and that of the succeeding odd-even-numbered cy-cle. However, as will be explained in the Discussion, appear-ance of an outlier is foreseen in the early stage of the preced-ing even-numbered cycle. Before proceedpreced-ing to that we try to predict the amplitude of cycle 25 using the above-described correlations.
3 Prediction of the maximum SSN of cycle 25
Now that more than 3 years have passed since the SSN took the latest minimum value in December 2008, we can use the excellent relationship between the SSN at point 3 years af-ter the minimum and the average SSN for even-numbered cycles (Fig. 2d) to estimate the average SSN of the current cycle 24. The estimated value, 39.4±4, is plotted with a bar of 1-σerror range on the scatterplot between the SSN at a point 3 years after the minimum and the average SSN
for even-numbered cycles (Fig. 5a). In order to predict the maximum SSN of cycle 25, we next use the strong corre-lation between the maximum SSN of odd-numbered cycles and the average SSN of the preceding even-numbered cycles (Fig. 4f). The predicted value is 115.4±11.9 (Fig. 5b). The maximum SSN of cycle 25 can also be estimated by using the relationships shown in Figs. 2b and 4b, where a value 116.5±15.9 is given.
Although outliers occasionally appear in the relationship between the amplitude of even-numbered cycles and that of the succeeding odd-numbered cycles, we have a good reason to consider that cycle 25 will not be an outlier (see Fig. 6).
8
8
Maximum SS
N
of odd cycle
Average SSN of the preceding even cycle SSN at a point 3 years after the minimum
Average SSN
(a)
(b)
Figure 5. (a) Scatterplot of average SSN versus SSN 3 years af-ter the minimum for even-numbered cycles. The estimated average SSN for cycle 24 is represented by a solid circle with a bar of 1-σ range. (b) Scatterplot of maximum SSN of odd-numbered cycles versus average SSN of the preceding even-numbered cycles. A solid circle shows the value of the predicted maximum SSN of cycle 25.
maximum SSN estimated by the correlation shown in Fig. 2b. The difference between the observed peak value and the es-timated value of the maximum SSN, 81.3, is 14.4, which amounts to about 2.5 times the standard deviation 5.8 of the excellent correlation between the SSN at a point 3 years af-ter the minimum and the maximum SSN for even-numbered cycles (Fig. 2b). Here, it is worth noting that many cycles showed two or more peaks, and cycles for which a higher peak appeared later are not rare. It has occurred in cycles 5, 12 and 16, for example. Therefore, we think it is highly probable that the real maximum SSN of the current cycle has not yet appeared. In fact, according to the sunspot number data of the Solar Influence Data Analysis Center, a monthly smoothed SSN at September 2013 was 73.1, though the value is still provisional as of April 2014. In any case, we will see if the prediction of the amplitude of the current cycle based on the correlation between even-numbered and the successive odd-numbered cycles is successful or not before long.
4 Discussion
In predicting the maximum SSN of cycle 25, we used the strong correlation between the amplitude of even-numbered cycles and that of the succeeding odd-numbered cycles. A problem in making the prediction on the basis of the correla-tion is that there are outliers in the correlacorrela-tion, as is seen in Fig. 4b, d, and f. At present, we do not know why such appar-ent outliers appear in the strong correlation. However, we can foresee appearance of an outlier in the early stage of the pre-ceding even-numbered cycle. Figure 6a shows changes in the
8 8
8
8
8 8
M
o
nt
hl
y
s
m
oot
hed s
u
ns
pot numbe
r
Month after the minimum
Cycle number
Ri
s
ing r
ate
of
th
e SSN
(a)
(b)
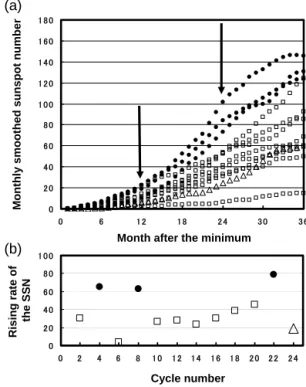
Figure 6. (a) Increase of the SSN of even-numbered cycles in 36 months after taking minimum values. Curves plotted by solid points show cycles 4, 8, and 22 for which succeeding odd-numbered cy-cles became outliers. Minimum values are set to be 0 for all cycy-cles. (b) Increasing rate of the SSN during the period 12–24 months after minima. Note that the increasing rate for cycles 4, 8, and 22 were exceptionally large. A triangle represents the increasing rate of the current cycle 24. Its small increasing rate suggests that cycle 25 will not be an outlier.
SSN for 12 even-numbered cycles during the first 36 months after taking a minimum value, where cycles 4, 8, and 22, for which succeeding odd-numbered cycles became outliers, are plotted by solid points. Note that the rate of increase of the SSN in the early stage of cycles 4, 8, and 22 was exception-ally large. That characteristic is obviously seen in Fig. 6b, where the rate of increase during the period 12–24 months after minima is shown. Now, if noted that the rate of increase of the current cycle 24, shown by a triangle, is such a small value, we may say with certainty that cycle 25 will not be an outlier.
is seen in Fig. 1a and b, the correlation between the SSN at a point 3 years before the minimum and the amplitude of the following cycle is incomparably better for even-numbered cycles than that for odd-numbered cycles. The correlation be-tween the SSN at a point 3 years after the minimum and the maximum SSN of the cycle is also better for even-numbered cycles compared to that for odd-numbered cycles. All of these characteristics seem to indicate that change of the SSN in even-numbered cycles is more regulated than that in odd-numbered cycles, and that the so-called Hale cycle, i.e., the 22-year-period solar cycle which takes a reversal of the sun’s dipole magnetic field into account, consists of pairs of an even-numbered cycle and the succeeding odd-numbered cy-cle, not those of an odd-numbered cycle and the following even-numbered cycle. We speculate that physical process that underlies the Hale cycle might be participating in cre-ating the significant difference in regularities between even-numbered and odd-even-numbered cycles.
Observation of the correlation between the SSN at a point 3 years before the minimum and the amplitude of the fol-lowing cycle, especially that for even-numbered cycles, as well as the correlation between amplitudes of even- and successive odd-numbered cycles, may be a sign of the so-called memory effect in solar cycles. By simulating solar cy-cles using a flux-transport-type dynamo model, Dikpati and Gilman (2006) showed that the combination of poloidal mag-netic fields in the past three cycles (n−1,n−2, andn−3) contributes in determining the strength of cycle n. Based on a similar Babcock–Leighton model, Charbonneau and Dikpati (2000) obtained a result that suggests a correlation with a lag time of two cycles. On the other hand, Yeates et al. (2008), using their Babcock–Leighton-type model, found that when magnetic flux is assumed to be transported dom-inantly by diffusion, not by advection, the memory persists for mainly one cycle. In any case, existence of an inter-cycle correlation is a basis of the search for “precursors”. An ex-treme idea on this matter is the one presented by Cameron and Shussler (2008), who maintained that most precursors so far proposed can be explained by overlapping of cycles and the Waldmeier effect, though they do not deny the possibil-ity that some memory exists. They noted the importance of finding a quantity that is not “contaminated” by early infor-mation leaking in from the new cycle. I do not claim that the correlation shown here corresponds to the one, but I think something meaningful is hidden in the difference between even- and odd-numbered cycles.
It might not be worthless to note here that, besides the positive correlation between the average SSN for even-numbered (2n) cycles and that for the succeeding odd-numbered (2n+1) cycles, the average SSN for (2n+1) cy-cles is weakly negatively correlated to that for (2n+4) cycles (Yoshida and Sayre, 2012). It is interesting that when these positive and negative correlations are combined, solar cycles are divided into two series that do not mix or merge, where one is composed of cycles 1, 4, 5, 8, 9, 12, 13, 16, 17, 20, 21,
. . . , and the other is composed of 2, 3, 6, 7. 10, 11, 14, 15, 19, 23, . . . . This finding does not necessarily mean that so-lar activity could be predicted over a long range, for outliers do appear occasionally in the correlations. Nevertheless, this pattern of inter-cycle relatedness may lead to better under-standing of the solar dynamo.
Acknowledgements. The author thanks the SIDC-team, World Data Center for the Sunspot Index, Royal Observatory of Belgium for the smoothed monthly mean SSNs, and the National Astronomical Ob-servatory of Japan for the sunspot data. I thank Leif Svalgaard for reviewing the manuscript and for his helpful comments. I also thank an anonymous reviewer for a number of useful comments that have helped improve the paper.
Topical Editor M. Temmer thanks L. Svalgaard and one anony-mous referee for their help in evaluating this paper.
References
Belucz, B. and Dikpati, M.: Role of asymmetric meridional circulation in producing north-south asymmetry in a solar cycle dynamo model, Astrophys. J., 779, doi:10.1088/0004-637X/779/1/4, 2013.
Cameron, R. and Schussler, M.: Solar cycle prediction using pre-cursors and flux transport models, Astrophys. J., 659, 801–811, 2007a.
Cameron, R. and Schussler, M.: Are solar cycle predictable?, As-tron. Nachr, 328, 1087–1091, 2007b.
Cameron, R. and Schussler, M.: A robust correlation between growth rate and amplitude of solar cycles: Consequences for pre-diction methods, Astrophys. J., 685, 1291–1296, 2008.
Charbonneau, P. and Dikpati, M.: Stochastic fluctuations in a Babcock-Leighton model of the solar cycle, Astrophys. J., 543, 1027–1043, 2000.
Dikpati, M. and Gilman, P. A.: Simulating and predicting solar cy-cles using a flux-transport dynamo, Astrophys. J., 649, 498–514, 2006.
Dikpati, M., de Toma, G., and Gilman, P. A.: Predicting the strength of solar cycle 24 using a flux-transport dynamo-based tool, Geo-phys. Res. Lett., 23, L05102, doi:10.1029/2005GL025221, 2006. Dikpati, M., Gilman, P. A., de Toma, G., and Ghosh, S. S.: Sim-ulating solar cycles in northern and southern hemisphere by as-similatingmagnetic data into a calibrated flux-transport dynamo, Solar Physics, 245, 1–17, 2007.
Dikpati, M., Gilman, P. A., and de Toma, G.: The Waldmeier effect: An artifact of the definition of Wolf sunspot number?, Astrophys. J., 673, L99–L101, 2008.
Hathaway, D. H. and Wilson, R. M.: Geomagnetic activity indicates large amplitude for sunspot cycle 24, Geophys. Res. Lett., 33, L18101, doi:10.1029/2006GL027053, 2006.
Hathaway, D. H., Nandy, D., Wilson, R. M., and Reichmann, E. J.: Evidence that a deep meridional flow sets the sunspot cycle period, Astrophys. J., 589, 665–670, 2003.
Kane, R. P.: A preliminary estimate of the size of the coming so-lar cycle 24, based on Ohl’s precursor method, Soso-lar Phys., 243, 205–217, 2007.
Ohl, A. I.: Forecast of sunspot maximum number of cycle 20, Solice Donie, 9, 84–85, 1966.
Pesnell, W. D.: Prediction of solar cycle 24, Solar Phys., 252, 209– 220, 2008.
Schatten, K. H.: Fair space weather for solar cycle 24, Geophys. Res. Lett., 32, L21106, doi:10.1029/2005GL024363, 2005. Svalgaard, L., Cliver, E. W., and Kamide, Y.: Sunspot cycle 24:
Smallest cycle in 100 years?, Geophys. Res. Lett., 32, L01104, doi:10.1029/2004GL021664, 2005.
Thompson, R. J.: The rise of solar cycle number 22, Solar Phys., 117, 279–289, 1988.
Waldmeier, M.: Neue Eigenschaften der Sonnenfleckenkurve, As-tronomische Mitteilungen Zurich, 14, 105–130, 1935.
Yeates, A. P., Nandy, D., and Mackay, D. H.: Exploring the physi-cal basis of solar cycle predictions: Flux transport dynamics and presence of memory in advection- versus diffusion-dominated solar convection zones, Astrophys. J., 673, 544–556, 2008. Yoshida, A. and Sayre, R.: Tendency of discreteness of the solar
amplitude and intercycle relatedness, Advances in Astronomy, 2012, 519852, doi:10.1155/2012/519852, 2012.