Abstract— Heat exchangers are some of the most important parts in thermoacoustic devices. In an oscillatory flow condition, the flow and temperature fields around the heat exchangers can be quite complex and it may significantly affect their heat transfer behaviour. As a result, one cannot directly apply the heat transfer correlations for a steady flow to the design of heat exchangers operating in oscillatory flow conditions. However, the fundamental knowledge of heat transfer in oscillatory flow is still not well established. The aim of the current work is to establish the heat transfer correlation for a few selected finned-tube heat exchangers, by measuring the heat transfer from the heat exchangers to the oscillatory flow in a range of operating conditions. Among the main parameters considered are fin spacing, fin length, thermal penetration depth, and gas displacement amplitude, and their effect on the thermal performance of heat exchangers. The results are presented in term of heat transfer effectiveness, which is the ratio of actual heat transfer rate to the maximum possible heat transfer rate. The correlations are proposed between the heat transfer effectiveness and the ratios of the fin length to the displacement amplitude and the fin spacing to the thermal penetration depth. The uncertainties associated with all the measurement data are also considered.
Index Terms— heat exchangers, thermoacoustics, oscillatory flow, heat transfer effectiveness
I. INTRODUCTION
HERMOACOUSTIC technologies rely on ‘thermoacoustic effect’ to produce acoustic power from heat or to transfer heat by consuming acoustic power. Accordingly, the practical devices can be designed to function as heat pumps or prime movers. Over other alternative technologies, the thermoacoustic devices have their advantages, such as the use of environmental friendly gases as working media, and little maintenance required due to the lack of moving parts. Having been the research subject over the past decades, the design of the thermoacoustic devices still involve significant technical challenges to achieve a satisfactory system efficiency. One major factor contributing to the overall efficiency of thermoacoustic devices is the effectiveness of heat transfer from the heat exchangers to the oscillating gas.
Manuscript received March 06, 2013.
Wasan Kamsanam is a PhD student at Department of Engineering, The University of Leicester, University Road, Leicester, LE1 7RH, UK. (e-mail: [email protected])
Xiaoan Mao (e-mail: [email protected]), and
Artur J. Jaworski are with Department of Engineering, The University of Leicester, University Road, Leicester, LE1 7RH, UK. (phone: +44 (0) 116 223 1033; fax: +44 (0) 116 252 2525; e-mail: [email protected]).
In thermoacoustic devices, the gas parcels follow a periodic oscillatory motion. The heat transfer characteristics of a heat exchanger in an oscillatory flow can be significantly different from those typical for unidirectional steady flow. Therefore, the approaches widely used to analyse the thermal performance of a heat exchanger in a steady flow cannot be directly employed in thermoacoustic flow conditions.
The heat transfer performance of heat exchangers in an oscillatory flow has been investigated by a number of researchers. Garrett [1] described the design and fabrication technique of heat exchanger for using in thermoacoustic devices. A couple of fin and tube heat exchangers were made and their performance was predicted. The convective heat transfer coefficient of heat exchangers was estimated using Blasius-Pohlhausen model for laminar flow. The results showed that the performance was in excellent agreement with the model. However, the comparison of convective heat transfer between the model and measurement was shown in limited testing conditions. The influences of parameters that may affect the heat transfer performance were not demonstrated. It was suggested that the heat exchanger performance could be improved if material of high thermal conductivity and more sophisticated fabrication technique are used.
Peak [2] studied experimentally the heat transfer performance of a micro-channel heat exchanger in both steady and oscillating flows. A comparison between heat transfer coefficients in oscillating flow determined from the measurements and those predicted from different models was made. The results revealed that the heat transfer in micro-channel heat exchangers could be predicted using a modified steady flow correlation based on the acoustic Reynolds number, defined as Rerms = urmsDh/ν, where urms,
Dh, and ν are the rms velocity, fin spacing hydraulic diameter and gas kinematic viscosity. Discrepancies of up to 36% were observed between the measured heat transfer coefficients and the predictions from different models.
Piccolo [3] reported a numerical study of the heat transfer characteristics of parallel plate thermoacoustic heat exchanger. The temperature distribution and the heat fluxes at the junctions between a parallel plate stack and two adjacent heat exchangers in a standing wave sound field were investigated. The effects of acoustic amplitude, fin spacing and fin length on the heat transfer performance were examined. The results revealed that the fin length should be in the order of the peak-to-peak acoustic displacement amplitude and the optimal fin spacing was found to be
Experimental Investigation of Heat Transfer
Effectiveness on Finned-Tube Thermoacoustic
Heat Exchanger
Wasan Kamsanam, Xiaoan Mao and Artur J. Jaworski
around four times the thermal penetration depth. It was pointed out that further experimental study is necessary to verify the simulation results.
Nsofor [4] carried out an experimental study of the heat transfer from the heat exchangers in a thermoacoustic refrigeration system. The measured data were processed in terms of Nusselt number, Prandtl number and Reynolds number to develop a correlation for heat transfer performance. The proposed correlation could predict the experimental data within 18%. The results showed that a higher mean pressure results in a greater heat transfer coefficient if the system operates in the corresponding resonance frequency.
Wakeland [5] investigated the heat transfer between two identical parallel-plate heat exchangers in an oscillating flow over a range of frequencies and gas displacement amplitudes. The experiments were conducted in air at ambient atmospheric pressure. The spacing between two heat exchanger plates was 6.35 mm. In this experiment, two quantities were varied, which are the displacement amplitude and the frequency. The results were presented in term of heat transfer effectiveness. The results revealed that the heat transfer rate continued to increase even as the gas moved beyond the extremities of both heat exchangers. Regarding the effect of plate spacing, the heat transfer effectiveness can be raised to nearly 1 by decreasing plate spacing. A function to estimate the heat transfer was developed. The prediction matches the measurement data fairly well with less than 10% discrepancy. However, substantial errors were observed at low displacement amplitudes, especially when the displacement amplitude was smaller than the gap between two heat exchangers. The heat transfer performance of finned-tube heat exchangers under oscillatory flow conditions was experimentally studied by Mao [6]. The effects of normalized displacement amplitude and normalised fin spacing on Nusselt number were presented and discussed. Criteria for the optimum design of thermoacoustic heat exchangers were also provided. Recently, Kamsanam [7] carried out an experimental study that similar to [6], but different in some testing conditions. In the study, effects of hot heat exchanger temperature were additionally reported.
In the current research, the heat transfer performance of finned-tube heat exchanger in oscillating flow field is investigated. The results are presented in term of effectiveness heat transfer. The experimental setup is similar to that used by [6] and [7]. From the experimental data, relevant parameters such as fin spacing, fin length, thermal penetration depth and gas displacement amplitude that may influence the heat transfer performance are investigated. The results are integrated to propose a correlation for the heat transfer rate. The uncertainty of measured data was evaluated.
II. EXPERIMENTAL SETUP AND PROCEDURE
To study the heat transfer performance in oscillatory flow, a common type of finned-tube heat exchanger was chosen for its structural simplicity. Two identical finned-tube heat exchangers were designed and fabricated. The fin spacing (D), which is the height of the channel formed between two
fins, fin length (L) in the oscillating flow direction and fin
thickness (t) of both exchangers is 0.7 mm, 20 mm, and 0.3
mm, respectively. The outside diameter of the tubes is 6 mm with 0.5 mm wall thickness. Fins, tubes, and heat exchanger case are made from copper C101. These components are joined by vacuum brazing. One assembled finned-tube heat exchanger and the sectional view of the test section are illustrated in Fig. 1 (a) and (b). The experimental apparatus is showed in Fig. 2. The two identical heat exchangers are placed side by side. A ceramic spacer is used to provide 5 mm interval space between the two heat exchangers. One of heat exchangers works as a hot heat exchanger and the other as a cold heat exchanger.
(a) (b)
Fig. 1. One assembled finned-tube heat exchanger (a), and sectional view of the test section (b).
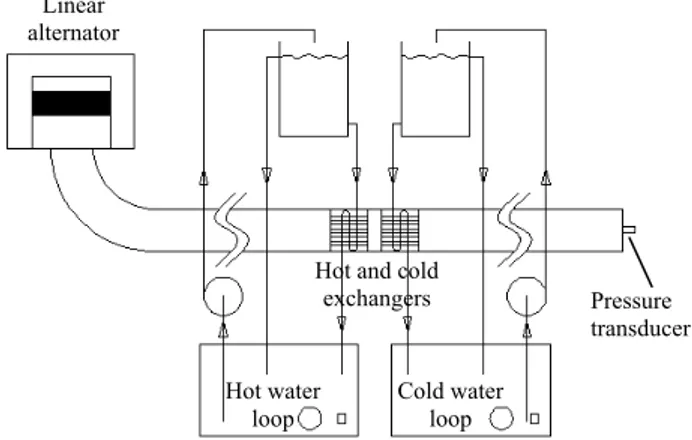
The test rig manly consists of a resonator pipe, a linear alternator and the test section, shown in Fig. 1b. The resonator is made of stainless steel pipe with an internal diameter of 50mm, and a length of 8.8m. A linear alternator (QDrive model 1S102M/A) is used to generate the oscillatory flow. The alternator can be controlled to achieve various operating frequencies and displacement amplitudes. Helim is used as the working medium in this investigation.
Fig. 2. Schematic diagram of the experimental apparatus.
Hot and cold water is used to deliver and remove heat to/from the hot side and cold side heat exchangers, respectively. The hot water flow loop consists of an unstirred water bath with 1.5 kW heating power, a circulation water pump and an insulated water container mounted above the heat exchanger. Hot water is produced in the hot water bath and delivered into the hot water container.
Hot water flows from the container through the hot heat exchanger driven by gravity, so that the water flow rate can
Hot water loop
Hot and cold exchangers Linear
alternator
Pressure transducer
Cold water loop PE sheet
PTFE
Thermocouple probes Wool
Ceramic spacer
H
ot
e
xc
ha
ng
er
Co
ld
e
xc
ha
ng
be kept constant throughout the experiment. A similar setup is arranged for the cold water loop. The hot and cold water flow rates are chosen at a certain level in order to realize a sufficient temperature drop between the inlet and outlet of each heat exchanger. In this study, the analysis of heat transfer is considered only on the hot heat exchanger.
The mass flow rate was found by weighting water at a given elapsed time. The hot water inlet temperature was controlled at 80 Cby a PID temperature controller. At the
cold side heat exchanger, cold water delivered from the cold water bath is kept at 22 C by means of secondary cooling
loop.
Prior to the experiment, the resonator is vacuumed and re-pressurized with helium to the set operating pressure. At each test condition, the flow rig was always operated at its resonance frequency. When the inlet temperatures of both hot side and cold side are steady at the preset value, and the water flow rate is constant at the desired value, the alternator is excited at a given displacement amplitude. When the heat exchangers reach a thermal equilibrium status, temperature readings are recorded.
To reduce heat losses from the heat exchangers to the environment, insulation is installed as illustrated in Fig. 1b. The ceramic plate is used to provide a space between the heat exchangers to prevent the heat conduction between them. Each heat exchanger rests on a PTFE cylinder to avoid a thermal contact with the stainless steel case. Pieces of PE sheets with 10cm length are attached to the internal surface of the stainless steel resonator pipe to reduce heat loss from the oscillating fluid to the pipe. Silicate wool is put in the cavity between heat exchangers and stainless steel case to reduce the heat loss due to natural convection in the empty volume. With these efforts, the heat losses still exist. This part of heat loss is calculated and added to the cold side to give the approximate total heat output. The heat imbalance between the heat input and output is used as an indication of the accuracy of the experimental data. In the present study, the average heat imbalance is 13.42%.
III. DATA REDUCTION
The heat transfer rate at various testing conditions can be calculated from the inlet and outlet temperatures of water for both hot and cold heat exchangers, and the corresponding mass flow rate of water. The heat transfer rate on the hot heat exchanger can be calculated according to
whi who
p h
w
c
T
T
m
Q
, ,
, (1)where mw,h, cp, Tw,hi, and Tw,ho are the mass flow rate, specific heat, and the temperature of hot water at the inlet and outlet of the heat exchanger, respectively. The specific heat of water is estimated at the mean temperature of hot water at the inlet and outlet of the heat exchanger. Its value can be deduced from the equation [8]
T T C
p c
C T p c
036 . 0 10 011160 . 0
26 . 5 100
100 0002874
. 0 996185 . 0 15
(2)
Here, the reference value of specific heat of water at 15ºC is 4.1855 J/(g·º C) .
The heat transfer performance of finned-tube exchanger in oscillatory flow is presented in term of effectiveness (), which is the ratio of the actual heat transfer rate )(Q to the
maximum possible heat transfer rate (Qmax)of that heat exchanger.
max
/Q Q
(3)
The maximum possible heat transfer rate Qmaxcan be
obtained from [5]
Tc
h T c m
Qmax p (4)
where m is the mass flow rate of the gas oscillating
between the heat exchangers, which can be found by
f A x
m m eff c (5)
with
La xeff min ,
From (5), m, xeff , Ac, f , and a are the density of working gas, the fin effective length, the minimum free-flow area of the heat exchanger, the oscillation frequency of the flow, and the gas displacement amplitude, respectively.
h
T and Tcare the average temperature of water in the hot and cold heat exchangers. Combine (4) and (5). The maximum available heat transfer is
) (
max mxeffAcf cp Th Tc
Q (6)
As for heat transfer in oscillatory flow, the working gas flows periodically, when the gas displacement amplitude
)
(a is beyond the heat exchanger extremities that may not be benefit the heat transfer performance. In the other hand, a short moving distance of gas parcel could be ineffective in transferring the required heat load. In addition, one of the important parameters to control the heat transfer is the distance that heat can diffuse through the gas during the moving cycle which referred to as thermal penetration depth
)
(k . The variables a and k are then normalized by fin
length and fin spacing, respectively. Once Qmax is obtained,
can be found by (3). The values of are plotted against non-dimensional parameters, a Land D k. The acoustic
displacement amplitude (a) and thermal penetration depth )
(k are determined using the following equations:
a
m x
n k a P
a
sin (7)
p c m k
k
2 (8)
where Pa,kn,x,,m,a, and k are the acoustic pressure, the wave number, the distance between the heat exchanger and the closed end of the resonator where the anti-node of the acoustic pressure is, the angular frequency of the acoustic oscillation, the gas density, the sound speed in the gas, and the thermal conductivity of the gas, respectively. Here, helium gas properties are evaluated at corresponding mean pressure and local temperature.
overall uncertainty in experimental results consists of several components which can be categorized into two groups, which are precision or random error, and bias or fixed error, according to the estimation method for their numerical values. The majorities of uncertainty considered in this study arise from the measurement of water mass flow rate and temperature measurement. The uncertainty in heat transfer rate (Q) is estimated by the following procedure. From (1), the uncertainty (UQ)of the experimental result
)
(Q is given by the combination of a precision error(PQ), and a bias error(BQ).
2 / 1 2
2 )
( Q Q
Q P B
U (9)
The estimations of the precision and bias errors are made according to the error propagation equation [11].
2 2 2 2 2 2 2 2 2 ) / ( ) / ( ) / ( ) / ( i T i o T o p c p m Q P T Q P T Q P c Q P m Q P (10) and 2 2 2 2 2 2 2 2 2 ) / ( ) / ( ) / ( ) / ( i T i o T o p p m Q B T Q B T Q c B c Q B m Q B (11)
The precision errors, Pm , PTo, and PTi , are evaluated as the standard deviation of unsteadiness of a set of observations of m, To, and Ti, respectively. For the specific heat capacity (cp) obtained from (2), both precision error (Pcp) and bias errors (Bcp) are counted into
the bias error of the property value. This error on the specific heat capacity is around 0.5% [12]. The components of bias error resulted from mass flow rate is calculated based on the error propagation equation [11]. The bias error arised from temperature measurements are taken from the precision of type K thermocouple probe. The values of bias error from mass flow rate and temperature measurement are 0.1% and 0.5 C, respectively. Hence, the overall
uncertainty of the experimental heat transfer rate results evaluated at 95 percent confidence interval shows average value of ± 6% for 17Q(W)128.
IV. EXPERIMENTAL RESULTS AND DISCUSSION The heat transfer rates on the hot heat exchanger is investigated at various a /L and D/k. Since, the fin length and the fin inter spacing are fixed, thus the parameter
L
a /
and D/k can be varied by changing the acoustic displacement amplitude (a)and thermal penetration depth
)
(k . For a given testing condition, a required value of a and k can be achieved by adjusting the piston excursion of the linear alternator and the mean operating pressure, respectively.
Fig. 3 illustrates the heat transfer rate at the hot heat exchanger as a function of the acoustic displacement amplitude normalized by the fin length (a/L) at various
k
D/ . The secondary x-axis on the upper horizontal axis
shows the absolute gas displacement amplitude. The value of D/k in this test is limited to 3.5 due to the maximum mean pressure allowed in the system, which is 40 bars. The value of a /L is limited to 1.5 because of the maximum
piston excursion of the linear alternator. One may see from Fig. 3 that the heat transfer rate for a given D/k is presented in positive value even at zero a /L. There is no
oscillating at this point. This part of heat transfer occurring is caused by the heat conduction through the medium gas, in addition to all heat losses. Since the amount of heat transfer rate at zero amplitude (Q0) does not contribute to the heat transfer in oscillatory flow, it is subtracted from the raw heat transfer data (Qraw). Accordingly, the subsequent analysis is based on the corrected heat transfer rate )(Q , which is
0
Q Q
Q raw (12)
Fig. 3. Raw heat transfer rate, Qraw(W) on a /L for various values ofD/k.
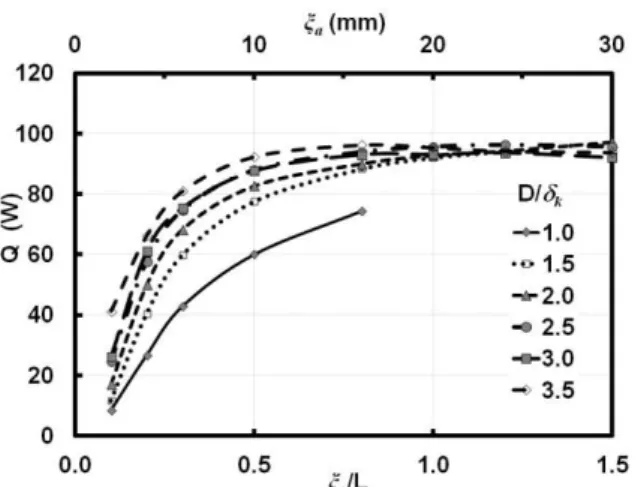
Fig. 4. Dependence of heat transfer rate, Q(W) on a/L for various values ofD/k.
Fig. 4 shows the corrected heat transfer rate Q0 versus
L
a /
. The heat transfer rate increases rapidly as the a /L
increases from 0.1 to 0.5. The growth becomes gentle when
L
a /
>0.5 and reaches a maximum at a /L around 1.0.
exchanger which leads to more heat transferred. Generally, at a /L<0.5, the heat transfer rate at high D/k is greater
than that at low D/k. At a /L above 1.0, the curves almost overlap each other and roughly remain stable afterward.
According to the definition of heat transfer effectiveness in (3), the maximum possible heat transfer rate (Qmax) is estimated and plotted in Fig. 5. At nearly all values of
k
D/ the maximum possible heat transfer rate
max
Q
steadily increase with the displacement amplitude owing to the increase of effective length. The highest value is achieved when a /L approaches 1.0. The values ofmax
Q become constant after a /L=1.0 due to the effective
length is limited to the fin length.
Fig. 5. The dependence of maximum possible heat transfer rate,
) ( maxW
Q on a/L for various values ofD/k.
The heat transfer effectiveness for various values of k
D/ is plotted in Fig. 6. For almost all values of D/k, a
sharp increase of effectiveness is visible for the values of
L
a /
between 0.2 and 0.3. This corresponds to the steep increase of the heat transfer rate at the same a /L in Fig.
4. For 0.5a /L1.0, the increase in the heat transfer
rate )(Q is not too strong while the growth of the maximum
possible heat transfer rate (Qmax) is higher. This makes the heat transfer effectiveness decrease gradually. However, the heat transfer effectiveness levels off at a /L>1.0 because
both Q and Qmax are almost constant.
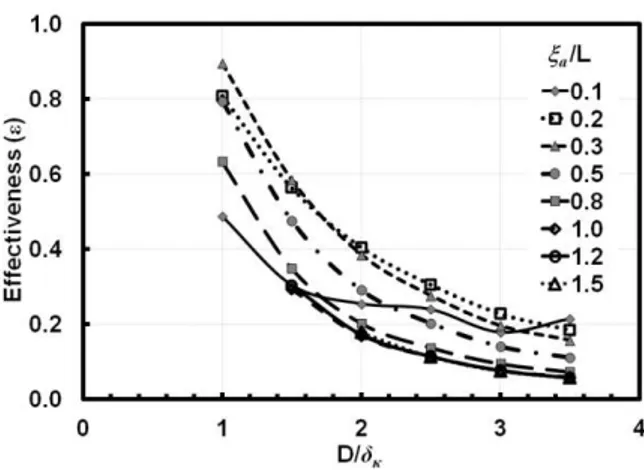
The data from Fig. 6 is re-plotted to illustrate the influence of D/k on the heat transfer effectiveness. Fig. 7 shows the curves of the heat transfer effectiveness for various a/L values. The plot exhibits the drop of the heat
transfer effectiveness at the high values of D/k. It is clear to be seen that whena /L=0.1 the heat transfer
effectiveness does not decrease smoothly as for any other values of a /L. At this smallest value of a /L, the
displacement amplitude is 2 mm, or 4 mm in peak-to-peak amplitude. As described in section II, the space between hot and cold heat exchangers is fixed at 5 mm. Compared to the
space, the moving distance of oscillating gas parcels at
L
a /
=0.1 is so small that they are not able to carry heat over the interval gap. Nevertheless, the heat transfer effectiveness shows positive values which means the heat transfer still exists at this small amplitude. This may be related to the heat transfer enhancement by an oscillatory flow. However, the phenomenon of heat transfer in such small amplitude has not been examined. The analysis on this point needs to be further explored. As the curve of
L
a /
=0.1 is considered unreliable, the data at this ratio is neglected in the following formation of the heat transfer correlation.
Fig. 6. The dependence of effectiveness () on a /L.
Fig. 7. The dependence of effectiveness () on D/kfor various values ofa/L.
The data from Fig. 7 is taken to plot in log-log scale as shown in Fig. 8. It reveals that the lines for a /L1.0
collapse into a single linear line. According to this line, a function of effectiveness and D/k is proposed.
91 . 1
)
/(
64
.
0
D
(13)for a/L1.0.
One more important objective to be achieved according to the data in Fig. 8 is finding a model that applicable for other
L
a /
Fig. 8. The dependence of effectiveness () on D/kfor selected a/L plotted on log-log scale graph.
The concept of developing a correlation of heat transfer effectiveness and D/kfor a/L<1.0 is to have a factor
)
(F to modify the model in (13) that fits the data. This
factor incorporates the parameters D/k and a /L. From the present data, F factor is established in the form
7 . 1
) / )( / ( 7 . 0 1
) / ( 7 . 0 1
L D
D F
a k
k
(14)
To estimate the heat transfer rate, the correlation suggested to be used is as follows
F Q
Qest max (15)
when F=1.0 for a /L1.0
and F from (14) for a /L<1.0.
As for the abovementioned correlation, the estimated heat transfer rate (Qest) is compared to the measurement results as depicted in Fig. 9. The results of estimated heat transfer rate are drawn in solid lines, whereas the dotted curves represent the measurement results. In the plot, only selected
k
D/ are shown in order to make it easier to distinguish
the curves.
Fig. 9. The comparison of experimental heat transfer rate results (dotted lines) to the estimation from developed correlations (solid lines).
As shown in Fig. 9, the proposed model can reflect the rise in heat transfer rate with the increase of a/L in the
range 0.1a /L1.0. At higher values of a/L, the
prediction from the model level off and lie well on the measurement data. However, the model over predicted the
heat transfer effectiveness on D/k=1.0. Generally, the calculated heat transfer rate by (15) is at 3.4% on average. The maximum deviation at 11.7% is found when
k
D/ =1.0.
V. CONCLUSIONS
The experimental study on heat transfer in oscillatory flow is carried out. The measurement of heat transfer rate is done on a finned-tube heat exchanger. The dependence of heat transfer on non-dimensional parameters a /L and
k
D/ is investigated. A model based on effectiveness heat
transfer is developed. The estimation on heat transfer rate is available using the proposed model. The discrepancy is found to be within 11.7% the experimental data. According to the results, the model that integrates some other parameters such as temperature dependency and heat exchanger geometry can be established. The further investigation will be useful for thermoacoustic heat exchanger design.
REFERENCES
[1] S. L. Garrett, D. K. Perkins, and A. Gopinath, “Thermoacoustic refrigerator heat exchangers - design, analysis and fabrication,” in Proc. 10th International Heat Transfer Conference, Brighton, UK, Vol
4, 1994, pp. 375-380.
[2] I. Paek, J. E. Braun, and L. Mongeau, “Characterizing heat transfer coefficients for heat exchangers in standing wave thermoacoustic coolers,” Journal of the Acoustical Society of America, Vol. 118, no. 4, pp. 2271-2280, 2005.
[3] A. Piccolo, “Heat transfer characteristics of parallel-plate thermoacoustic heat exchangers,” in Proc. ASME-ATI-UIT 2010 Conference on Thermal and Environmental Issues in Energy Systems, Sorrento, Italy, 16 – 19 May 2010.
[4] E. C. Nsofor, S. Celik, and X. Wang, “Experimental study on the heat transfer at the heat exchanger of the thermoacoustic refrigerating system,” Applied Thermal Engineering, Vol. 27, pp. 2435-2442, 2007.
[5] R. S. Wakeland and R. M. Keolian, “Effectiveness of parallel-plate heat exchangers in thermoacoustic devices,” Journal of the Acoustical Society of America, Vol. 115, no. 6, pp. 2873-2886, 2004.
[6] X. A. Mao, W. Kamsanam, and A. J. Jaworski, “Convective heat transfer from fins-on-tubes heat exchangers in an oscillatory flow,” in Proc. The 23rd IIR International Congress of Refrigeration, Prague, Czech Republic, 2011.
[7] W. Kamsanam, X. A. Mao, and A. J. Jaworski. “Heat transfer performance of finned-tube thermoacoustic heat exchangers in oscillatory flow,” in Proc. The 19th International Congress on Sound and Vibration, Vilnius, Lithuania, 2012.
[8] M. J. Richardson. (2005). Tables of physical & chemical constants, the National Physical Laboratory, 2.3.6 Specific heat
capacities.[Online]. Available: www.kayelaby.npl.co.uk
[9] J. H. Kim, T. W. Simon, and R. Viskanta, “Journal of heat transfer policy on reporting uncertainties in experimental measurements and results,” Journal of Heat Transfer-Transactions of the Asme, Vol. 115, no. 1, pp. 5-6, 1993.
[10] E. P. Rood, and D. P. Telionis, “Journal of fluids engineering policy on reporting uncertainties in experimental measurements and results,” Journal of Fluids Engineering-Transactions of the Asme, Vol. 113, no. 3, pp. 313-314, 1991.
[11] S. J. Kline, and F. A. McClintock, “Describing uncertainties in single-sample experiments,” Mechanical Engineering, Vol. 75, No. 1, pp. 3-8, 1953.