Experimental Analysis Of Heat Transfer From Square Perforated
Fins In Staggered Arrangement
Siddiqui. M. Abdullah*, Dr. A. T. Autee**
*(Department of Mechanical Engineering, Marathwada Institute of Technology, Aurangabad, Maharashtra, 431028, India)
** (Department of Mechanical Engineering, Marathwada Institute of Technology, Aurangabad, Maharashtra, 431028, India)
ABSTRACT
This project gives the experimental analysis of heat transfer over a flat surface equipped with Square perforated pin fins in staggered arrangement in a rectangular channel. The Fin dimensions are 100mm in height & 25mm in width. The range of Reynolds number is fixed & about 13,500– 42,000, the clearance ratio (C/H) 0, 0.33 and 1, the inter-fin spacing ratio (Sy /D) 1.208, 1.524, 1.944 and 3.417. Sy i.e. stream wise distance is varies and Sx i.e. span wise distance is constant. The friction factor, enhancement efficiency and heat transfer correlate in equations with each other. Here we are comparing Square pin fins with cylindrical pin fins. Staggered arrangement and perforation will enhance the heat transfer rate. Clearance ratio and inter-fin spacing ratio affect on Enhancement efficiency. Both lower clearance ratio and lower inter-fin spacing ratio and comparatively lower Reynolds number give higher thermal performance. Friction factor & Nusselt number are Key parameter which relates with efficiency enhancement and heat transfer rate.
Keywords
– Staggered arrangement, perforated square pin fins, Performance Analysis, Heat Transfer EnhancementI.
INTRODUCTION
There are numerous situations where heat is to be transferred between a fluid and a surface.
In such cases the heat flow depends on three factors namely (i) area of the surface (ii)
Temperature difference and (iii) the convective heat transfer coefficient.
The base surface area is limited by design of the system. The temperature difference depends on the process and cannot be altered. The only choice appears to be the convection heat transfer coefficient and this also cannot be increased beyond a certain value. Any such increase will be at the expense of power for fans or pumps. Thus the possible option is to increase the base area by the so called extended surfaces or fins.
The main aim of the study is to design fins to optimise the use of a given amount of material to maximise heat transfer. For this purpose it will be desirable that the fin surface temperature is closer to the base surface temperature. This can be achieved by the use of materials of high thermal conductivity like copper or aluminium. In terms of weight and ease of lubrication aluminium will score over copper though its thermal conductivity will be lower.
Extended surfaces (fins) are frequently used in heat exchanging devices for the purpose of increasing the heat transfer between a primary surface and the surrounding fluid.A pin fin is a cylinder or other shaped element attached perpendicular to a wall with
the transfer fluid passing in cross flow over the element. Pin fins having a height-to-diameter ratio, H/d, between 0.5 and 4 are accepted as short fins, whereas long pin fins have a pin height-to-diameter ratio, H/d, exceeding 4 [1]. Short pin fins are widely used in the trailing edges of gas-turbine blades, in electronic cooling and in the aerospace industry. The large height-to-diameter ratio is of particular interest in heat-exchanger applications in which the attainment of a very high heat-transfer coefficient is of major concern.
The various important parameters in the analysis of fins are, (1).Heat transfer coefficient (2).Length of the fin, (3). Cross sectional area of the fin (4). Thermal conductivity of fin. (5) Efficiency and Effectiveness of fin. The use of extended surfaces is of practical importance for numerous applications such as cooling the Air-cooled engine cylinder head, Economizers for steam power plants, Radiators of automobiles, Small capacity compressors, Transformers, Electronic equipment.
In this experimental analysis we are using the same parameters and setup as that of the work done on the cylindrical pin fins but here only aim is to prove that the Square cross section pin fins are having influencing Effectiveness (εf) and efficiency (η) on the cylindrical pin fins.
There have been many investigation regarding heat transfer and pressure drop of channels with pin fins has been done by the following researchers considering the different factors for heat transfer.
Amol B. Dhumne, Hemant S. Farkade [1] performed experimental study of the overall heat transfer, friction factor and the effect of the various design parameters on the heat transfer and friction factor for the heat exchanger equipped with circular cross-sectional perforated pin fins. The effects of the flow and geometrical parameters on the heat transfer and friction characteristics were determined, and the
enhancement efficiency correlations have been obtained. The average Nussult number calculated on the basis of projected area increased with decreasing clearance ratio and inter-fin spacing ratio. The friction factor increased with decreasing clearance ratio and inter-fin distance ratio. Enhancement efficiencies increased with decreasing Reynolds number. Therefore, relatively lower Reynolds number led to an improvement in the heat transfer performance.
Bayram Sahin, Alparslan Demir [2] studied the heat transfer enhancement and the corresponding pressure drop over a flat surface equipped with square cross-sectional perforated pin fins in a rectangular channel. The experiments covered the following range: Reynolds number 13,500–42,000, the clearance ratio (C/H) 0, 0.33 and 1, the inter-fin spacing ratio (Sy/D) 1.208, 1.524, 1.944 and 3.417. Correlation equations were developed for the heat transfer, friction factor and enhancement efficiency. The experimental results showed that the use of the square pin fins may lead to heat transfer enhancement. Both lower clearance ratio and lower inter-fin spacing ratio and comparatively lower Reynolds numbers are suggested for higher thermal performance.
Okamoto et al. [3] studied the flow field in a matrix of surface mounted square blocks with width D = 23 mm and height H = 5 mm placed in a boundary layer. The face to face distance S was varied as S/H = 2, 3, 5, 7, 10 and 13 in both streamwise and spanwise direction. The study showed that for S/H < 5 the flow did not reattach at the channel floor and that the inter-obstacle space was fully covered by a large flow recirculation.
Meinders and Hanjalic [4] reported that horseshoe-type vortex originates at the front face and an arc-shaped vortex exists in the wake flow. They found that the observed local flow structure, in particular flow separation and reattachment, caused marked variation in the distribution of the local heat transfer coefficient, with large gradients detected particularly at the top and side faces of the cubes. The study showed that surface and cube averaged Nusselt number had maximum values at the front of the cubes and had minimum values at rear of the cubes.
Tzer-Ming Jeng, Sheng-Chung Tzeng [5] studied the pressure drop and heat transfer of a square pin-fin array in a rectangular channel. The variable parameters are the relative longitudinal pitch (XL = 1.5, 2, 2.8), the relative transverse pitch (XT = 1.5, 2, 2.8) and the arrangement (in-line or staggered). The result shows that the in-line square pin-fin array has smaller pressure drop than the in-line circular pin-fin array at high XT (XT = 2.0 or 2.8) but an equivalent (or even slightly higher) pressure drop at low XT (such as XT = 1.5). Additionally, the staggered square pin-fin array has the largest pressure drop of NOMENCLATURE
A heat transfer area D diameter of the fins Dh hydraulic diameter of the duct
d diameter of the perforation F friction factor
h heat transfer coefficient H height of the fins I current
L length of base plate k conductivity of air
Number of the pins
Nu Nussult number (=hDh/k) Nussult number for smooth
base plate
Nussult number based on
projected area
Re Reynolds number (=UDh/𝜐) Q heat transfer rate
U mean velocity of the air V voltage
W width of the base plate and the duct
∆P pressure difference
the three pin fin arrays (line circular pfins, in-line square pin-fins and staggered square pin-fins). Most in-line square pin-fin arrays have poorer heat transfer than an in-line circular pin-fin array, but a few, as when XL = 2.8, exhibit excellent heat transfer at high Reynolds number. For instance, when XL = 2.8, XT = 1.5
II.
EXPERIMENTATION
FACILITY
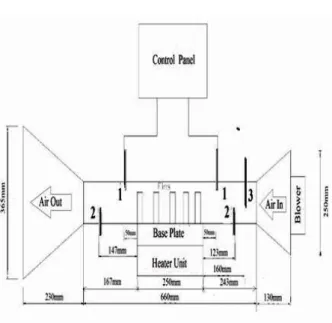
The experimental set-up used for present study is designed and fabricated with reference to the literature work. The set up consist of the following parts
1. Tunnel 2. Heater Unit 3. Base Plate 4. Control Panel
1. Tunnel
The tunnel is designed such that the material used for the tunnel is Wood because wood is a bad heat conductor. The tunnel is of 20 mm thickness, & had an internal cross-section of 250 mm width and 100 mm height the total length of the channel is 1120 mm. The tunnel consists of the two portions one is convergent and second is divergent, the convergent section is at inlet and the divergent portion is on outlet section of the tunnel. Both the convergent & divergent parts are having an inclination of 30° from the base. The convergent section is having height of 250mm and width of 400mm whereas the divergent section is having height of 365mm and a width of 515mm. The test section is having the dimensions of 250mm x 100mm. The tunnel is insulated from the inside to avoid the heat losses with the help of gypsum plaster or also called plaster of Paris.
The Reynolds number range used in this experiment was 13,500–42,000, which is based on the hydraulic diameter of the channel over the test section (Dh) and the average velocity (U) The inlet and outlet temperature of the air stream and temperature of base plate will be measured by RTD Sensors having a range of 0°c to 450°c which mounted in wind tunnel.
2. Heater Unit
Heater Unit (test section) has a cross-section of 250 mm x 250 mm square; the heating unit mainly consists of an electrical heater on which M.S. Plate having the thickness of 3mm & same dimensions as that of base plate is placed, a heater is placed in Square shaped box which is insulated by the asbestos blanket at the base surrounded by the ceramic wool. Dimensions of the electrical heater assembly placed on the jack are 250 mm x 250 mm. The heater output has a power of 2000W at 220V and a current of 8 amps.
3. Base Plate
It consist of square plate at base having the dimension 250 mm x 250 mm, thickness is 6mm and the pin fins and base plate made of the same material i.e. Aluminum because of the considerations of conductivity, machinability and cost.
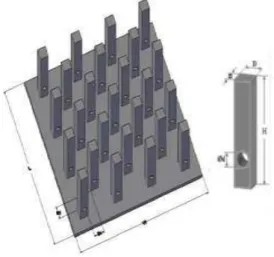
The fins have a square cross section of 15 mm x15 mm and are attached on the upper surface of the base plate as shown in Fig 1. Square pin fins with different lengths, corresponding to C/H (Clearance ratio) values of 0, 0.333 and 1, are perforated at the 17 mm from bottom tip of those by an 8 mm diameter drill bit. The pin fins are fixed uniformly on the base plate with a constant spacing between the spanwise directions of 18.125 mm, with different spacing between the pin fins in the streamwise direction. The spacing ratios of the pin fins in the Stream- wise direction (Sy/D) were 1.208, 1.524, 1.944 and 3.417 mm, giving different numbers of the pin fins on the base plate. It is well-known fact that if the inter-fin spacing in the spanwise direction decreases, the flow blockage will increase and thus, pressure drop along to tested heat exchanger will increase. Because the aim of the study is to determine inter-fin spacing in streamwise direction, the spacings in the spanwise direction will not be considered in this study. The temperature of the base plate is measured by RTD Sensors which can sense the temperature from 0°c to 450°c and it is screwed into groove in the base plate the readings of the RTD Sensors will be shown on control panel.
Fig. 1 Base plate having Sy/D=1.208. No. of fins 25.
4. Control Panel
temperature of air and one gives temperature of base plate .There is one temperature contractor which can maintain the temperature of base plate, it will not allow to exceed the temperature of base plate above desired values. Inlet flow rate of air is indicated by velocity indicator
Fig. 2.Photographic View of Base Plates
Table I. Details of Dimensions and Number of Base plate and Fins[1]
Sr. No.
Particular Size Quantity
1 Base
Plate(Without Fins )
250mmx 250mm
1
2 Base Plate (With Fins )
250mmx 250mm
12
3 Square
Perforated Fins
100mm 75
4 Square
Perforated Fins
75mm 25
5 Square
Perforated Fins
50mm 25
6 Cylindrical perforated Fins
100mm 75
7 Cylindrical perforated Fins
75mm 25
8 Cylindrical perforated Fins
50mm 25
using Anemometer. MCB (Main Circuit breaker) Hegger switches are mounted to cut off the power supply in case any short circuit.
Fig. 3 Schematic view of Experimental set up (1)RTD Sensors (2) Manometer (3) Anemometer
Fig.4 Photographic view of Experimental set up
III.
DATA
PROCESSING
The convective heat transfer rate “Q” convection from electrically heated test surface is calculated by using,[1][2]
(1) Where: Qconv, Qelect, Qcond, Qrad indicates the heat transfer rate by convection, electrical, conduction and radiation.
The electrical heat input is calculated from the electrical potential and current supplied to the surface [1] [4],
(2) Where “I” is current flowing through the heater and “R” is the resistance.
two terms of Eq. (1) may be ignored. The heat transfer from the test section by convection can be expressed as, [1][2]
(3) Hence,
(4) Either the projected or the total area of the test surface can be taken as the heat transfer surface area in the calculations. The total area is equal to the sum of the projected area and surface area contribution from the pin fins. These two areas can be related to each other by
Total area = Projected area + Total surface area contribution from the blocks. For perforated square fins it will be, [1][2]
AS= W×L+ 4NP×HD + NP ×(πDd-0.5πd2) (5) For perforated cylindrical fins it will be,
2
s p p
A =W×L+[
πDH-2πab]N +[(2πr +2πrD)-2πab]N
(6)
where “W” is the width of the base plate, “L” its length, “Np” is the number of fins, “H” the height of fin and “D” is the diameter of the fins, “a” is semi major axis of ellipse, “b” is semi minor axis of ellipse. “a” and “b” are calculated by the development of surfaces and its come “a”=4.8mm and “b”=4mm and r =4mm.
The dimensionless groups are calculated as follows,
(7)
Friction factor,
(8) Reynold‟s number,[6][7]
(9) All the calculations are done by considering mean temperature of the system which is[8]
(10)
IV.
RESULTS
AND
DISCUSSION
1. Heat transfer
In order to have a basis for the evaluation of the effects of the fins, some experiments were carried out without any fins attached to the plate. Using the data obtained from these test, the average Nusselt number (Nus) for the smooth surface (without pin fins) was correlated as function of Re and Pr as follows:
Nus = 0.077Re 0.716 Pr 1/3 (11)
The Nusselt number based on both the projected area and total area was related to the Reynolds number, clearance ratio (C/H), inter-fin distance ratio (Sy/D) and Prandtl number. Thus, the following correlation equations were obtained,
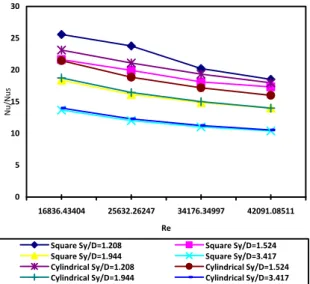
(12) This equations are valid for the experimental conditions of 13,500 ≤ Re ≥ 42,000, 1.208 < Sy/D < 3.417, 0 ≤ C/H ≤ 1 and Pr = 0.7 by using this equation the Nu/Nus and Re will be determine for perforated square and cylindrical fins for different C/H ratio i.e. C/H=0, C/H=0.333, C/H=1 at constant Sy/D=1.208 and for different Sy/D ratios i.e. Sy/D=1.208, Sy/D=1.524, Sy/D=1.944, Sy/D=3.417 at constant C/H=0. The same will be find out for perforated cylindrical fins and the comparative graph between Nu/Nus and Re for perforated square and cylindrical fins is plotted as below,
0 5 10 15 20 25 30
0 10000 20000 30000 40000 50000 Re
Nu
/Nu
s
Square C/H =0 Square C/H =0.33 Square C/H =1 Cylindrical C/H =0 Cylindrical C/H =0.33 Cylindrical C/H =1
Fig 5: Variation of Nu/Nus based on projected area of Square & Cylindrical Perforated fins with Reynolds number for various clearance ratios at Sy/D = 1.208.
0 5 10 15 20 25 30
16836.43404 25632.26247 34176.34997 42091.08511 Re
Nu/Nus
Square Sy/D=1.208 Square Sy/D=1.524 Square Sy/D=1.944 Square Sy/D=3.417 Cylindrical Sy/D=1.208 Cylindrical Sy/D=1.524 Cylindrical Sy/D=1.944 Cylindrical Sy/D=3.417
Fig 6. Variation of Nu/Nus based on projected area with Reynolds number for various inter-fin Spacing ratios at C/H = 0 for square and cylindrical Perforated
fins
Fig 6 shows the behavior of the Nu/Nus as a function of the duct Reynolds number and inter-fin distance ratios (Sy/D) for a constant clearance ratio (C/H) of 0. Decreasing Sy/D means that the fin numbers on the base plate increases. It is seen from this figure that since the number of fins increases with decreasing Sy/D, which also means an increase in the total heat transfer area, the heat transfer rate (Nu/Nus) increases. Perforated Square fins have higher Nusselt number values than cylindrical fins.
2. Friction factor
The experimental pressure drops over the test section in the finned duct were measured under the heated flow conditions. These measurements were converted to the friction factor, f. Using the experimental results, f was correlated as a function of the duct Reynolds number, Re, and geometrical parameters. The resulting equation is
(13) This equation is valid for 13,500 < Re < 42,000, 1.208 < Sy/D < 3.417, 0 < C/H < 1 By using the above equation the variations in the friction factor “f” for different clearance ratios (C/H) i.e. C/H=0, C/H=0.333, C/H=1 at constant Sy/D = 1.208 and for different inter-fin space ratios (Sy/D) i.e. Sy/D=1.208, Sy/D=1.524, Sy/D=1.944, Sy/D=3.417 at constant C/H = 0 is determined. The same experiment will be carried out for the cylindrical perforated fins and friction factor will be find out for the same and the comparative graph between f and Re for perforated square and cylindrical fins is plotted as shown in fig 7.
It can be seen from Fig 7 that the friction factor increases with decreasing C/H. Because the pin height increases with decreasing C/H, the by-pass area over the fin tips decreases. Thus, resistance against the flow increases.
0 0.2 0.4 0.6 0.8 1 1.2
0 10000 20000 30000 40000 50000
Re
F
Square C/H=0 Square C/H=0.33
Square C/H=1 Cylindrical C/H=0
Cylindrical C/H=0.33 Cylindrical C/H=1
Fig 7. Variation of friction factor with Reynolds number for various clearance ratios at Sy/D =1.208
for square and cylindrical Perforated fins
It is seen from Fig 8 that the friction factor values are almost independent of the Reynolds number and each C/H value. It underscores another optimization study for a finned heat exchanger that interestingly, streamwise distance between fins is more effective parameter on the friction factor than spanwise distances. On the other hand, as the resistance to the flow will be smaller due to the perforations & the shape, hence friction factor is lower for the perforated cylindrical fins than the perforated Square fins.
0.85 0.9 0.95 1 1.05 1.1
0 10000 20000 30000 40000 50000
Re
F
Square Sy/D=1.208 Square Sy/D=1.524
Square Sy/D=1.944 Square Sy/D=3.417
Cylindrical Sy/D=1.208 Cylindrical Sy/D=1.524
Cylindrical Sy/D=1.944 Cylindrical Sy/D=3.417
Fig 8.Variation of friction factor with Reynolds number for various inter-fin spacing ratios at C/H = 0
for square and cylindrical Perforated fins
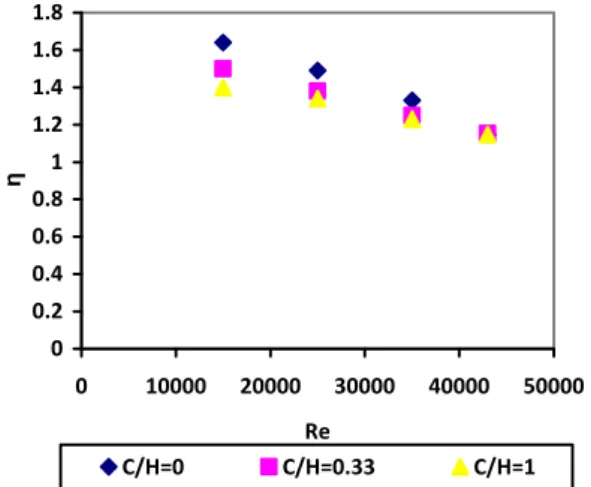
3. Enhancement Efficiency
(14) Where “ha” and “hs” are the convective heat transfer coefficient with and without pin fins, respectively the following equation can be written for the heat transfer efficiency for the pin fins according to total heat transfer surface area,
(15) By using this equation the effect of the inter-fin distance on heat transfers enhancement efficiency for different inter-fin spacing ratios (Sy/D) i.e. Sy/D=1.208, Sy/D=1.524, Sy/D=1.944, Sy/D=3.417 at constant C/H = 0 will be determine and graph is plotted. Similarly the effect of the clearance ratio on enhancement efficiency for different clearance ratio (C/H) i.e. C/H=0, C/H=0.333, C/H=1 at constant Sy/D = 1.208 will be determined and graph is plotted.
0 0.2 0.4 0.6 0.8 1 1.2 1.4 1.6 1.8 2
0 10000 20000 30000 40000 50000
Re
η
Sy/D=1.208 Sy/D=1.524 Sy/D=1.944 Sy/D=3.417
Fig 9. Variation of enhancement efficiency (ƞ) with Reynolds number for various inter-fin spacing ratios
at C/H = 0 for square Perforated fins
0 0.2 0.4 0.6 0.8 1 1.2 1.4 1.6 1.8
0 10000 20000 30000 40000 50000
Re
ƞ
C/H=0 C/H=0.33 C/H=1
Fig 10. Variation of enhancement efficiency (ƞ) with Reynolds number for various clearance ratios at Sy/D
= 1.208 for square Perforated fins
Fig 9 Show the effect of the inter-fin distance ratio on enhancement efficiency (ƞ) for perforated square fins, while Fig 10 shows the effect of the clearance ratio on enhancement efficiency (ƞ) on perforated square fins. For a net energy gain, the value of the ƞ must be greater than unity. In other words, for an effective heat transfer enhancement technique, it must have values greater than unity. From Fig 9 and Fig 10, it is clear that as the Reynolds number increases, the enhancement efficiency decreases for both the inter-fin spacing ratio and clearance ratio. Fig 9 and Fig 10 show that the heat transfer enhancement efficiency increases with increasing Sy/D and decreasing C/H.
V.
CONCLUSIONS
/FUTURE
SCOPES
1.
ConclusionIn this study, the overall heat transfer, friction factor and the effect of the various design parameters on the heat transfer and friction factor for the heat exchanger equipped with square cross-sectional perforated pin fins were investigated experimentally & compared with the Cylindrical perforated fins . The effects of the flow and geometrical parameters on the heat transfer and friction characteristics were determined, and the enhancement efficiency correlations have been obtained. The conclusions are summarized as:
a. The average Nusselt number calculated on the basis of projected area increased with decreasing clearance ratio & inter-fin spacing ratio by 10%.
b. The friction factor increased with decreasing clearance ratio and inter-fin distance ratio by 6%.
c. Enhancement efficiencies increased by [8 to 10 %] with decreasing Reynolds number. Therefore, relatively lower Reynolds number led to an improvement in the heat transfer performance.
d. The most important parameters affecting the heat transfer are the Reynolds number, fin spaces (pitch) and fin height. Heat transfer can be successfully improved by controlling these parameters. The maximum heat transfer rate was observed at 17350 Reynolds number, 3.417 Sy/D and100 mm fin height.
e. The most effective parameter on the friction factor was found to be fin height. The minimum friction factor was observed at 50 mm fin height, 42,000 Reynolds number and 3.417 pitch.
2.
Future Scopesa. In future the analysis can be done with the help of Computational Fluid Dynamics [CFD] and hence more accuracy and better results will emerge.
b. Analysis can also be done on the compound geometry [Cylindrical & Square] pin fins. c. Analysis can also be done on the Square pin
fins with staggered arrangement for more than one perforation.
d. Analysis can also be done on the Square pin fins with different inclinations of Perforations.
R
EFERENCES[1] Mr. Amol B. Dhumne and Hemant Farkade, “Heat transfer analysis of cylindrical perforated fins in staggered arrangement”,
International Journal of Engineering Science and Technology (IJEST), Volume No. 6, Issue No. 05, May.
[2] Bayram Sahin, AlparslanDemir Performance analysis of a heat exchanger having perforated square fins, Applied Thermal
Engineering 28 (2008) 621–632.
[3] S. Okamoto, K. Tsunoda, T. Katsumata, N. Abe, M. Kijima,Turbulent near-wakes of periodic array of square blocks on a plate,Int. J. Heat Fluid Fl. 17 (3) (1996) 211–218.
[4] E.R. Meinders, K. Hanjalic, Vortex structure and heat transfer in turbulent flow over a wall-mounted matrix of cubes, Int. J. Heat
Fluid Fl. 20 (1999) 255–267.
[5] Tzer-Ming Jeng,Sheng-Chungzeng, Pressure drop and heat transfer of square pin-fin arrays in in-line and staggered arrangements,
International Journal of Heat and Mass Transfer 50 (2007) 2364–2375.
[6] J. P. Holman, 2004, “Heat Transfer”, 9th
Edition, „Tata McGraw Hill‟, Page No.43-53 & 315-350.
[7] Yunus A. Çengel, 2004, “Heat Transfer- A
Practical Approach”, SI units 2nd Edition, Tata McGraw Hill, Page No. : 156-168, 333-352& 459-500.