tion, split into numerous intervals. Filling up the intervals by item-by-item examination of the possible numerical val-ues of the parametersx, y,z, . . ., expressed with integers, will be non-uniform.
Any algorithm has its own individual frequent distribu-tion. The distributions can be created∗for any formula, which
has two or more free parameters (the distributions of the pa-rameters can sometimes have unexpected or complicate form, containing both minima and peaks of the probability).
Frequent distributions give a possibility for bonding the probability of the appearance of numerical values of a func-tion in the region of its existence. This is because the number of the numerical values of the function, hitting into a respec-tive interval, in by item-by-item examination of the possible numerical values of the function’s arguments, is proportional to the probability of an average numerical value of the func-tion in the interval. The frequent distribufunc-tions manifest the reproductivity of numerical values of the function due to the possible variations of its arguments. A frequent distribution itself cannot provide exact numerical solutions. However, if the object or process under consideration is described by not a single function but a few ones, the frequent distributions of these functions can logically be summarized or multiplied in order to manifest, more clear, such regions wherein the probability is high to that in the rest regions. Form of the distribution depends on both the form of the function and the dependencies among the positive integers; in the distribution obtained as above, the properties of the integers become not limited by the plain function of their item-by-item examina-tion, but are more complicate thus anindividualizationof the integers occurs.
Once sharp manifested maxima, attractors, or regions of zero probability appear, it is important to find what peculiar-ities the algorithm bears. This however can be done only through respective analysis of a large number of the calcula-tion results. In early years, this problem was unable to be con-sidered in serious: processing so large numerical databases,
∗There is a ready-to-use function “frequency” in MS Excel; another
soft-only due to the computer techniques.
It should be noted that the discrete nature of experimen-tal results was discovered in the background of normal dis-tribution of their numerical values (fine structure of the his-tograms) in already many years ago, by experimental stud-ies conducted, commencing in 1951, by Simon E. Shnoll and his experimental team (see his monograph [1] and bibliogra-phy therein). As a result, Shnoll suggested that form of the histograms is connected with the mathematical algorithms, which express the respective processes we measure.
Below are specific examples, which illustrate the connex-ion of the frequent distributconnex-ions and the real physical pro-cesses and phenomena.
There is a very interesting property of the frequent dis-tributions: several kinds of the distributions include the ra-tios of masses of the elementary particles. This property is attributed to the frequent distributions of the databases of nu-merical values of the functions, constructed onfractions. We found these are plain exponential functionsAx/y, whereAis presented by special numbersπ=3.1416. . .,e=2.17183. . ., and the reverse fine structure constantα=137.036. . .In a few cases (hyperons), we meanAthe relative mass of the proton
mp/me=1836.
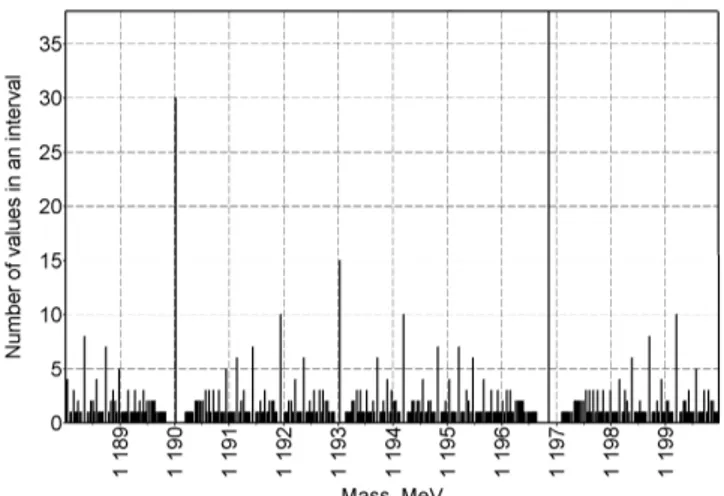
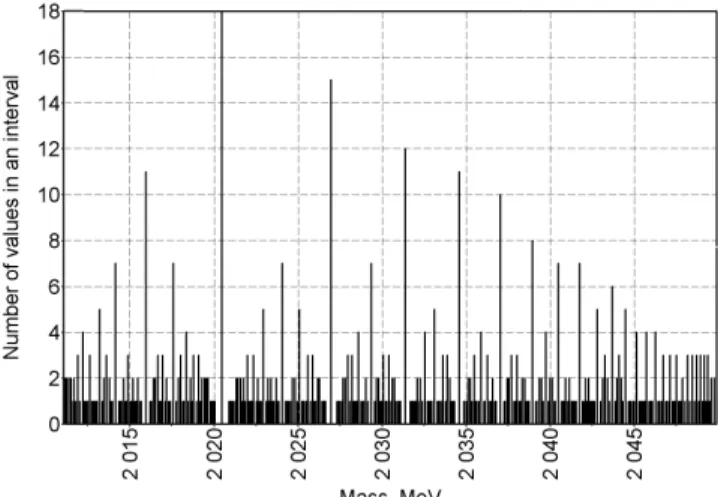
In order to be sure in it, we should do follows. Collect a database of numerical values of such a function in the frame-work of the complete item-by-item examination of its argu-mentsxandypresented by integers, and in the scale which is enough large for covering the necessary scale of masses of the elementary particles (in the units of mass of the electron). Then we should distribute the numerical values along the axis of abscissas, covering numerous intervals by them. Once the distribution done, we will see that it has local maxima (peaks) in numerous locations of the scale, which meet the numerical values of masses of the elementary particles. Peaks of the distributions have a delta-like form.
Fig. 1: Mass of the proton (938.27) in distribution 0.511πx/y. Fig. 2: Mass of the neutron (939.57) in distribution 0.511ax/y.
Fig. 3: Mass of theΣ+(1189) particle in distribution 0.511ex/y. Fig. 4: Masses of theΣ+(1189.4),Σ0(1192.5),Σ−(1197.3) parti-cles in distribution 0.511ax/y.
Fig. 5: Mass of theη(548.8) particle in 0.511 (mp/me)x/y distrib-ution.
Fig. 6: Masses of theΩ−,Σ
1(1672, 1670) particles in distribution
Fig. 7: Mass of theΞ−- (1321) particle in 0.511 (m
p/me)x/y dist-ribution.
Fig. 8: Mass of theΛ(1115) particle in distribution 0.511ax/y.
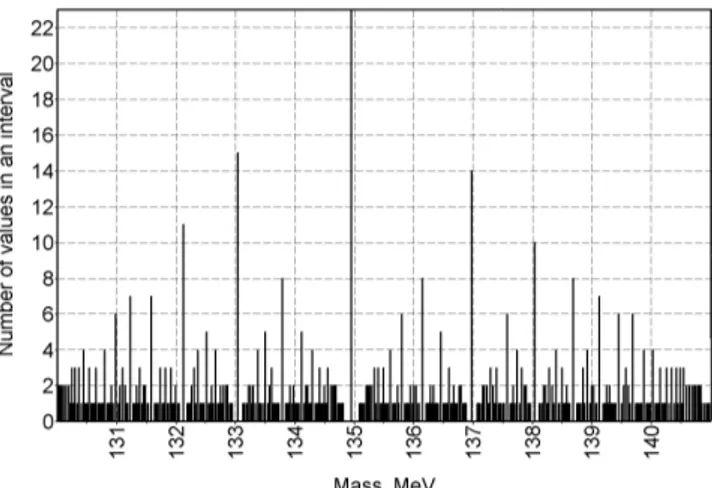
Fig. 9: Mass of theπ0(134.9) particle in distribution 0.511ax/y. Fig. 10: Mass of theµ−(105.7) particle in distribution 0.511ex/y.
Fig. 11: Mass of the K0(498.7) particle in distribution 0.511ax/y. Fig. 12: Mass of theΛ
Fig. 13: Masses of the b0
1,∆1(1233, 1232) particles in distribution
0.511ax/y.
Fig. 14: Mass of the K∗(892.2) particle in distribution 0.511ax/y.
Fig. 15: Mass of the B (1230) particle in distribution 0.511πx/y. Fig. 16: Mass of theω(782.7) particle in distribution 0.511ex/y.
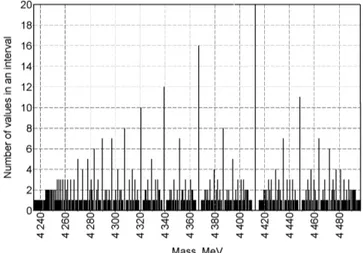
Fig. 17: Masses of theηc(2820),χ(3556) particles in distribution 0.511ax/y.
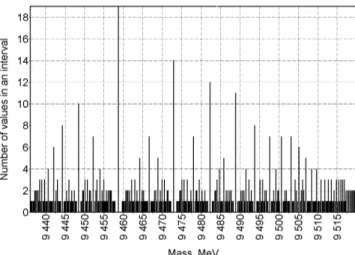
Fig. 19: Mass of the Y (9460) particle in distribution 0.511ex/y. Fig. 20: Some main peaks correspond with masses of the D0
(1863), D∗0 (2006),Σ
3(2030), N4 (2190),Λ+c (2260) particles in distribution 0.511ax/y.
Fig. 21: Main peaks correspond with masses of the τ− (1782),
Λ3,Ξ1(1820, 1820), D+(1868), S (1940) particles in distribution
0.511πx/y.
Fig. 22: Main peaks correspond with masses of the f′, Λ
2, N2
(1516, 1518, 1520),ρ′(1600),∆
2(1650), N3, g (1688, 1690)
par-ticles in distribution 0.511ax/y.
Fig. 25: Mass of theη′(958) particle in distribution 0.511πx/y. Fig. 26: Mass of the h (2020) particle in distribution 0.511πx/y.
Fig. 27: Mass of theϕ(1020) particle in distribution 0.511ex/y. Fig. 28: Mass of the A (1310) particle in distribution 0.511ax/y.
the relative masses of very different particles. The axis of abscissas is given in MeV. The histograms are created in the same way; they have 1000 numerical values distributed along 350 intervals.
It is probable, all the masses meet respective peaks in the distributions. This is not a result of my “passion” to nu-merology. This also does not mean that the masses of the particles are expressed just by the same functions. Mean-while, these correspondences appear with so high precision and so often that they cannot be random, absolutely. On the other hand, the numerical values of some masses meet not the peaks, whose height is proportional to the number of the pairsxandyproducing the same fraction, but empty spaces neighbouring the peaks (the spaces are presented by most rare appeared ratios of the prime numbers). As is obvious, the empty space neighbouring the peaks manifest minima of the relative density of rational numbers in their distribution along the numerical axis. Connexion of the spaces with the most stable states of oscillation processes was shown by Kyril I. Dombrowski [2, 3].
Is there a spectrum of masses of the elementary particles, if we mean it as the presence of the cross-dependency of the masses, and a possible algorithm of their calculation? I think that not. This is despite we can suppose that the numerical values of the masses constitute the “fine structure” of a distri-bution according to an unknown algorithm.
It is likely as the numerical values of the masses have a probabilistic origin, and are connected somehow with the properties of the prime numbers. It is probable, a rˆole is played here by the fact that the prime number fractions or ratios are more fundamental quantities than the prime num-bers themselves. This is because each single fraction of the infinite row is a result of ratios of infinite number of the pairs of arbitrary prime numbers.
At present time, many elementary particles were experi-mentally discovered. The particles have very different lifes-pans. This fact and also the shape of distributions constructed on fractions lead us to a conclusion that the first order masses “create” the second order masses, the second order masses
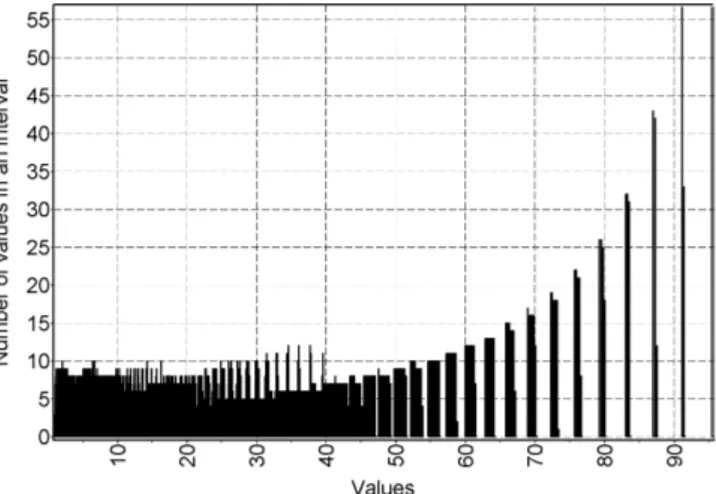
Fig. 31: Distribution on the function 100 exp −ax(b–y)0.5 , where
a=0.00147,b=1000.
process is specific to a continuous non-viscous medium, when perturbations appear in it. We cannot except that physical ex-periments can produce infinite variety of the elementary par-ticles.
Another example is provided by frequent distribution of the exponent (Fig. 31)
100 exp−ax(b–y)0.5
,
modelling the well-known formula which expresses the trans-parency of the potential barrier of the tunnelling effect, where
xandy are variables characterizing mass and energy of the particle. Shape of the distribution is very dependent on the numerical coefficientsaandb. Moreover, several numerical values of the function are not realized at all. This form of his-tograms is specific to those functions, which do not contain ratios or fractions.
In this case, in item-by-item examination of the integers
xandyalong an abstract scale from 1 to 100, there is about 10,000 numerical values of the exponent. The axis of ordi-nates means the number of the coinciding numerical values of the function along the interval.
As we found, the distribution of the exponent has the most number of the intervals (nonzero numerical values of the or-dinate, whose common number is as well dependent also on the given length of the unit interval) with several specific nu-merical valuesaandb. For instance, Fig. 31. Withb=1000 anda=0.00147, difference between the neighboring intervals (i.e. the relative length of the interval) is 0.003 of the current numerical value f the function, while this is in the background of 1124 nonzero intervals (the graph has 10,000 intervals to-tally).
With these parameters, the term under the exponent ap-proaches numerically to−1 independent from the “size” of
field of the gravitational potential) of the attracting masses they orbit.
It is obvious that the discrete distributions of experimen-tal data, and also their connexion with the aforementioned frequent distributions, are true for the microscales in the first row. There in the microscales, physical quantities exist in the boundary of their decay, thus the possibility of this solution is due to the discrete origin of physical phenomena, which is manifested in the microscales very much. On the other hand, our conclusion are most probable true for a general case as well: non-prime numbers can be represented as the ratios of primes, so the aforementioned frequent distributions are still true for even smallest intervals.
Are we lawful to claim that the parameters of physical or other processes, which are described as above, have not only the quantitative expression but also the probabilistic expres-sion as just said before?
Should we, within the given dependencies which describe some processes or phenomena, find out a possibility for the prediction of the regions of the most probable solutions as those most rational to the others, or for the prediction of those intervals of numerical values, where the considered phenom-enon processes most intense (all these not only in the mi-croscales)?
If so, we get a possibility for solving the reverse prob-lems, which target re-construction of the probabilistic distri-bution of the primary experimental results on the basis of a respective algorithm. This is related first of all to those prob-lems, which are based on the discrete data (primes). This is, for instance, industry or economics: the number of working sections, workgroups, units of equipment, produced units, the number of working personell, and so on.
If all that has been said above is true, and the results of solving similar algorithms (in the case where the algorithms are expressed by the functions whose arguments are more than two) can bear not only a numerical meaning but also a probabilistic meaning, this fact leads to important sequels. There are many problems where numerous parameters are un-known, or cannot be determined in exact. This is economics,
fysikarkivet, Stockholm, 2009, 388 pages.
2. Dombrowski K. I.Bulletin of Soviet Atron. Geodesical Society, 1956, no. 17(24), 46–50.
3. Dombrowski K. I. Rational numbers distribution and resonance. Prog-ress in Physics, 2005, v. 1, 65–67.