© Author(s) 2006. This work is licensed under a Creative Commons License.
Chemistry
and Physics
Characterization of aerosol pollution events in France using
ground-based and POLDER-2 satellite data
M. Kacenelenbogen, J.-F. L´eon, I. Chiapello, and D. Tanr´e
Laboratoire d’Optique Atmosph´erique, Centre National de la Recherche Scientifique -Universit´e des Sciences et Technologies de Lille, Villeneuve d’Ascq, France
Received: 28 March 2006 – Published in Atmos. Chem. Phys. Discuss.: 12 July 2006 Revised: 20 September 2006 – Accepted: 23 October 2006 – Published: 26 October 2006
Abstract. We analyze the relationship between daily fine particle mass concentration (PM2.5) and columnar aerosol optical thickness derived from the Polarization and Direc-tionality of Earth’s Reflectances (POLDER) satellite sen-sor. The study is focused over France during the POLDER-2 lifetime between April and October POLDER-2003. We have first compared the POLDER derived aerosol optical thickness (AOT) with integrated volume size distribution derived from ground-based Sun Photometer observations. The good cor-relation (R=0.72) with sub-micron volume fraction indicates that POLDER derived AOT is sensitive to the fine aerosol mass concentration. Considering 1974 match-up data points over 28 fine particle monitoring sites, the POLDER-2 derived AOT is fairly well correlated with collocated PM2.5 mea-surements, with a correlation coefficient of 0.55. The cor-relation coefficient reaches a maximum of 0.80 for particular sites. We have analyzed the probability to find an appropriate air quality category (AQC) as defined by U.S. Environmental Protection Agency (EPA) from POLDER-2 AOT measure-ments. The probability can be up to 88.8% (±3.7%) for the “Good” AQC and 89.1% (±3.6%) for the “Moderate” AQC.
1 Introduction
Atmospheric pollution due to airborne fine particles is an en-vironmental issue of a worldwide increasing concern. At-mospheric aerosols also called Particulate Matter (PM) in-teract with the solar and thermal radiation and thus affect the Earth’s radiative balance (Anderson et al., 2003). The PM mass measured at the ground level is a common way to quantify the amount of aerosol particles in the atmosphere and is used as a standard to evaluate air quality. PM moni-toring is particularly important for human health protection
Correspondence to: M. Kacenelenbogen
(meloe@loa.univ-lille1.fr)
because the exposure to suspended particles can contribute, among others, to some lung and respiratory diseases and even premature death. However, most of the air quality-monitoring stations are located close to major urban areas leaving large areas without operational observations. Satel-lite remote sensing is well suited for a daily monitoring of the aerosol load (Kaufman et al., 2002; King et al., 1999). In the recent years several set of satellite data have fostered a com-prehensive description of the temporal and spatial variabil-ity of different aerosol species, from anthropogenic aerosols (Tanr´e et al., 2001) to desert dust (L´eon and Legrand, 2003). The monitoring of aerosols from space has also been widely used during this last decade for the evaluation of aerosol influence on global climate change through the impact on the Earth-atmosphere radiation budget (Boucher and Tanr´e, 2000; Br´eon et al., 2002). Primary aerosol quantity derived from space borne remote sensors operating in the solar spec-trum is the aerosol optical thickness. The relationship be-tween column aerosol optical thickness (AOT) derived from satellite imagery and fine particulate mass ground measure-ments (PM) has already been explored over the United States (Engel-Cox et al., 2004; Wang and Christopher, 2003; Al-Saadi et al., 2005) and other populated and industrialized regions in Asia (Li et al., 2005) and Europe (Chu et al., 2003) using retrievals from the MODIS radiometer (MOD-erate Imaging Spectroradiometer, on board Earth Observ-ing System (EOS) TERRA and AQUA satellites). Wang and Christopher (2003) have used a simple linear relation-ship between MODIS derived AOT and 24 hr mean PM2.5 to quantitatively estimate air quality categories as defined by the U.S. Environmental Protection Agency (EPA) with an ac-curacy of more than 90% in cloud-free conditions.
0 10 20 30 40 50 60 70
j f m a m j j a s o n d
PM 2.5 (
µ
g/m3)
0 0.1 0.2 0.3 0.4 0.5 0.6 0.7 0.8
POLDER derived AOT (440 nm)
PM2.5 AOT POLDER
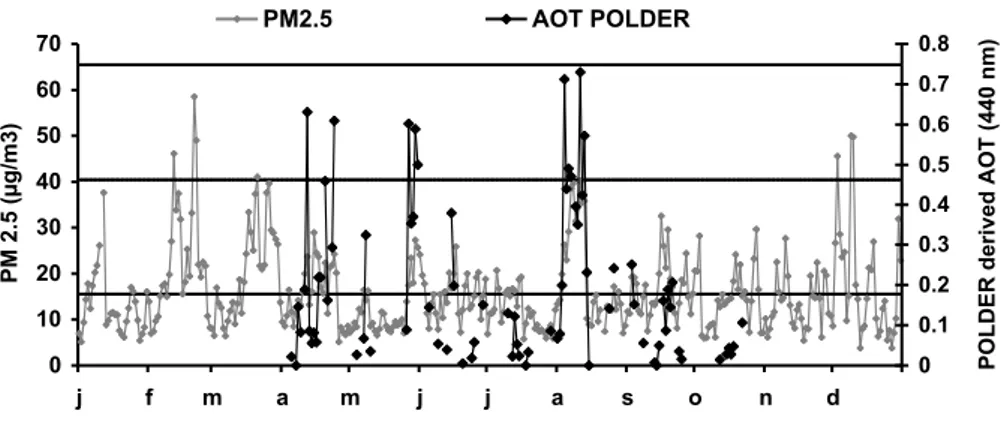
Fig. 1. Temporal evolution of 24-h averaged fine particulate mass concentration (PM2.5 inµg/m3) during year 2003 over Lille (North of
France). We show the different Air quality categories (according to the EPA) such as Good (between 0 and 15.4µg/m3)and Moderate (between 15.5 and 40.4µg/m3). The POLDER derived AOT at 440 nm over the PM2.5 site of Lille is also presented between April and October 2003.
on the global aerosol distribution has been acquired. No comparison studies between radiometer POLDER-2 and PM ground measurements have been achieved yet. The aim of this paper is to analyze the capacity of POLDER mea-surements in estimating aerosol pollution events and to in-vestigate the possible use of satellite data for air quality monitoring. We base our analysis on the data collected by POLDER-2 on ADEOS-2 and collocated ground measure-ments in France from local air quality monitoring stations and Sun photometer sites of the AERONET/PHOTONS net-work.
2 Satellite and ground-based data
2.1 Daily mean fine particulate mass PM2.5
The Particulate mass concentration measured at the ground level (PMxmeans the mass of particles with an aerodynamic diameter lower thanxµm) is a common way to quantify the amount of particles in the atmosphere and is used as a stan-dard to evaluate air quality. The small aerosol component, PM2.5 inµg/m−3, is of most concern to human health be-cause it can be easily inhaled deep into the lungs. Therefore we chose to base our study on PM2.5 data more appropri-ate for health relappropri-ated studies than PM10 data. PM 2.5 are found in smoke and haze and generally result from com-bustion, including motor vehicles, power plants, residential wood burning, forest fires, and agricultural burning. In terms of aerosol pollution monitoring, particulate mass concentra-tion is measured by several air quality agencies scattered over France and handled by the French Environment and En-ergy Management Agency (ADEME). The mass concentra-tion of the PM fracconcentra-tion is determined continuously using a Tapered Element Oscillating Microbalance (TEOM, uncer-tainty of a fewµg/m3 on the PM values). There could be an underestimation of the PM values by the TEOM caused by
the evaporation of ammonium-nitrate (Hodzic et al., 2005). We have centred our attention on the year 2003 in order to use the measurements recorded during the POLDER-2 ob-servation period between April and October 2003. More-over, during 2003, local air quality monitoring stations have recorded (over Paris and its outskirts) a slight increase in the mean level of fine particles even though the amount of fine particles had remained stable from 1998 to 2002. Fig-ure 1 presents the temporal evolution of ground-based 24-h PM2.5 mass concentrations recorded in downtown Lille city in North of France during year 2003. In general, there are more particulate pollution events and of higher intensity dur-ing winter than durdur-ing the rest of the year. Among the peaks recorded during year 2003, we observe on Fig. 1 an abso-lute PM2.5 maximum value in winter up to 60µg.m−3 dur-ing February. In summer, the maximum (up to 40µg.m−3)
is observed in August. To give an order of magnitude, the U.S. Environment Protection Agency (EPA) has estab-lished that the 24-hour averaged PM2.5 concentration must be less than 40.5µg.m−3for healthy conditions concerning the whole population (including special groups such as el-derly and children). We can observe on Fig. 1 that this 40.5µg.m−3threshold has been exceeded 6 times during the
whole winter period. Taking into account the assumed well mixed aerosols in the boundary layer, the increase of con-centration of pollutants at ground level in winter could be explained by an inversion layer trapping aerosols underneath a “thermal lid” (a significant decrease of ground temperature values by night tend to induce a lower morning air tempera-ture at the ground than at high altitude).
spatial resolution is 6 km×7 km and its wide field of view induces a 2400 km swath that allows a nearly global daily coverage. To increase the signal to noise ratio, the algo-rithm is applied to 3×3 POLDER pixels, leading to a res-olution in the aerosol AOT of 21 km×18 km. AOT retrieval from the POLDER polarized measurements is described by Deuz´e et al. (2001). The AOT is retrieved at the 670 nm and 865 nm channels equipped with polarized filters. Only cloud-free pixels selected according to the cloud-screening algorithm of Br´eon and Colzy (1999) are processed. The surface contribution is modelled as a semi-empirical bidirec-tional polarized distribution function that depends on the nor-malized difference vegetation index (NDVI) and the geo-type of the pixel according to the IGBP classification (Nadal and Br´eon, 1999). Ten mono-modal lognormal size distributions are considered with corresponding effective radius from 0.05 to 0.15µm and a standard deviation of 0.403 for a complex refractive index of 1.47–0.01 i. In this study, we consider the AOT at 440 nm extrapolated from the measurements at 670 and 865 nm. Physical AOT values are considered to be valid down to 0. Figure 1 shows along with the PM2.5 mea-surements the corresponding POLDER derived AOT over the site of Lille, France between April and October 2003. Gen-erally, the temporal trend in the optical thickness is very sim-ilar to the trend directly recorded in ground-based PM2.5, especially in August. However, some days show a peak of POLDER AOT not recorded at the ground by the PM mea-surements like on 27 May (POLDER AOT = 0.60 and PM2.5 = 15.5µg/m3). This could be due to the presence of a high altitude aerosol plume. On another hand, days like the 15th of April present a strong local PM value (29µg/m3) not ob-served by POLDER-2 (AOT=0.08). This phenomenon could be due to the coarse resolution of the POLDER-2 instrument compared to the local station, or the choice of selecting daily mean PM2.5 compared to instantaneous POLDER-2 data. We can notice the difference in the number of observations between the ground-based PM2.5 (213 observations over the POLDER-2 operating period) and the satellite (78 observa-tions) due to the impact of the cloud cover. As we focus on the capacity of POLDER to derive information on the particle mass, we first consider the comparison of POLDER derived AOT with integrated volume size distribution. For this purpose we use the data collected by the globally dis-tributed AErosol RObotic NETwork (AERONET) (Holben et al., 1998) hardware, which consists in more than 140 iden-tical automatic sun-sky scanning spectral radiometers. The aerosol size distribution (between 0.05 and 15µm) and opti-cal parameters (single scattering albedo, volume concentra-tion, refractive index, and effective radius) are derived from the angular distribution of sky radiances measured in the al-mucantar according to the algorithm developed by Dubovik and King (2000). In this work, we use level 1.5 AERONET data (Smirnov et al., 2002) and the retrievals of the vol-ume size distribution of aerosols derived from AERONET are selected with the highest possible accuracy according to
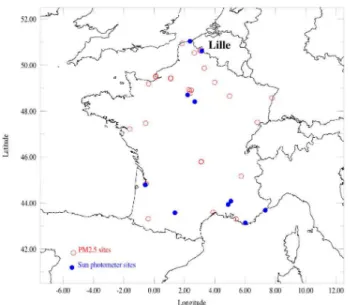
Fig. 2. Locations of (Red dots) the 28 PM2.5 stations and (Blue
dots) the 10 AERONET/PHOTONS Sun photometer sites used in this study.
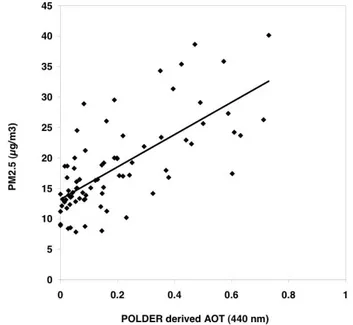
Dubovik et al. (2000). As we use daily average PM2.5, we have also compared the POLDER derived AOT with daily mean Sun photometer volume size distribution. Considering daily average rather than instantaneous observations may in-troduce a bias in the comparison. However, the difference between the satellite instantaneous observation and daily av-erage AOT for urban/industrial area remains less than 10% (Smirnov et al., 2002). POLDER-2 data are averaged within a 3×3 pixels size area (0.6◦) centred on the AERONET site of interest. During the POLDER-2 lifetime, 10 Sun pho-tometers from the AERONET/PHOTONS network were op-erating over France. Their geographical locations are dis-played on Fig. 2. We have compared the POLDER derived AOT and integrated volume size distribution from April to October 2003, providing a total of 473 match-up data points. The correlation (see Fig. 3) between the two quantities is en-hanced from 0.66 to 0.72 when considering a cut-off radius of 1.0µm, roughly corresponding to the PM2.5 physical cut-off radius. This is consistent with the fact that polarization by aerosol mainly comes from small spherical particles in the accumulation mode (Vermeulen et al., 2000). It indicates that POLDER derived AOT is well suited for remote sensing of fine mode particles.
3 Comparison between POLDER-2 derived AOT and PM2.5 mass
Table 1. Statistics over 10 bins of 197 match-up points between POLDER AOT at 440 nm and PM2.5 (data shown in Fig. 5). The two
first columns correspond to the minimum and the maximum aerosol optical thickness (AOT) for each of the 10 bins. The third and the forth columns respectively show, for each bin, the fraction of the corresponding PM2.5 values that fit into the AQC “good” (PM2.5≤15.4µg.m−3)
and AQC “moderate” (15.5µg.m−3≤PM2.5≤40.4µg.m−3). The last column shows the 90% level confidence interval on the population of associated AOT and PM2.5 values.
AOT Min. AOT Max. AQC “Good” AQC “Moderate” Error (%)
0.00 0.01 88.8 11.2 3.7
0.01 0.03 80.7 19.3 4.6
0.03 0.05 65.0 35.0 5.6
0.05 0.07 66.5 33.5 5.5
0.07 0.10 64.5 35.5 5.6
0.10 0.13 52.8 47.2 5.9
0.13 0.17 56.3 43.7 5.8
0.17 0.24 33.0 67.0 5.5
0.24 0.34 28.4 70.1 5.4
0.34 0.99 8.0 89.1 3.6
Fig. 3. Regression lines between POLDER derived AOT at 440
nm and Sun photometer integrated size distribution for the total size distribution (r≤15µm in black, Volume concentration = 0.25 AOTPOLDER+ 0.05, R=0.66, RMS=0.04) and the submicron
frac-tion (r≤1µm in grey, Volume concentration = 0.15 AOTPOLDER+
0.03, R=0.72, RMS=0.02) over 10 selected AERONET/PHOTONS sites (N=473).
440 nm are averaged in a 3×3 pixels size area (correspond-ing to 60×60 km2) centred on the PM2.5 station of inter-est. Among the 35 stations available, 7 are classified as strongly affected by local car traffic and not considered in this study. The overall match-up database corresponds to 1974 comparison points. 5 stations among the 28 stations show a correlation coefficient over 0.70. Fig. 4 gives an ex-ample of the regression found for the station of Lille,
corre-Fig. 4. Comparison between collocated daily averaged PM2.5 and
POLDER derived AOT at 440 nm for a station close to the city of Lille from April to October 2003 (PM2.5= 26.56 AOTPOLDER +13.20, R=0.70, N=78, RMS = 5.28).
sponding to the data presented in Fig. 1. A significant offset of 13µg.m−3indicates that the satellite has a limited
The comparison of this first relationship between POLDER AOT and PM2.5 with those previously established by using MODIS is complicated by the influence of sev-eral factors, like using PM10 instead of PM2.5 (Chu et al., 2003; Li et al., 2005), different wavelengths and spatial res-olutions for the satellite AOT (Engel-Cox et al., 2004; Wang and Christopher, 2003), different time periods, and alterna-tive approaches forcing the offset of the PM/Satellite AOT relationship through 0. Additionally the difference of sen-sitivity of the two sensors to fine particles, and their differ-ent inversion algorithm for the AOT might have a signifi-cant impact on their relationship with PM2.5. Despite these limitations, the slope (26µg.m−3 per unit AOT) and offset (12µg.m−3)we have derived from POLDER are in the same range than those established by Engel Cox et al. (2004) tween MODIS AOT and PM2.5 over the United States be-tween April and September 2002 (slope of 19µg.m−3, offset
around 8µg.m−3). Other studies using MODIS found higher
values for the regression slopes like, for example, the local study by Wang and Christopher (2003) over Alabama (slope
∼71µg.m−3per unit of MODIS AOT using PM2.5), or the comparison by Chu et al. (2003) over northern Italy (slope
∼55µg.m−3per unit of AERONET AOT using PM10). Fur-ther investigations should be performed to interpret these dif-ferences and evaluate the impacts of POLDER-2’s coarser spatial resolution (21×18 km) compared to MODIS (Level 2 MODIS’s aerosol product is 10×10 Km), and POLDER-2’s sensitivity to fine particles on these AOT/PM relationships.
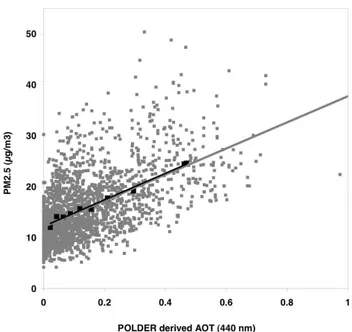
In our study, when data are arranged by bins of 197 points each (the last bin contains 201 points), the correlation co-efficient rises up to 0.99 (also displayed on Fig. 5). Based on the bin averaged data set, we have assessed POLDER’s capacity to estimate the EPA Air Quality Categories (AQC, see Wang and Christopher, 2003) over France for the 28 sta-tions. Due to the relatively low PM2.5 values in our data set, it is only possible to consider the two first categories, i.e. below 15.5µg.m−3 (classified as “good”) and between 15.5µg.m−3 and 40.4µg.m−3 (classified as “moderate”). Table 1 presents the minimum and maximum AOT for each of the 10 bins as well as the percentage of the correspond-ing PM2.5 values that fit into the two respective EPA cate-gories. Few points exceed 40.5µg.m−3in the last two bins, respectively 1% and 3% of the data. Concerning the other bins, 100% of the points are below 40.5µg.m−3. The error is given for a 90% confidence level. For very low optical thickness (first bin, AOT<0.01), 88.8% of the points are in the AQC labelled “good”. Considering AOT above 0.35 the probability to have PM2.5 in the AQC “moderate” is 89.1%. Since we are lacking values above 40.5µg.m−3, we can-not establish an upper limit for the AOT in the “moderate” AQC. For a POLDER AOT up to 0.10, the averaged proba-bility to find a corresponding PM2.5 below 15.5µg.m−3is 73%. Below a threshold of 0.17 for the POLDER AOT, this probability is 68%. If we also consider this threshold as a lower value for the “Moderate” AQC, the probability to have
Fig. 5. Regression line between daily POLDER derived AOT at 440
nm and PM2.5 measured at the ground (Grey dots, PM2.5= 25.67
AOTPOLDER+12.10, R=0.55, N=1974, RMS = 5.53) over 28 PM
stations in France from April to October 2003 and considering the mean values of each of the 10 bins (Black squares, PM2.5= 26.57
AOTPOLDER+12.21, R=0.99, N=10, RMS = 0.57).
POLDER AOT that corresponds to a PM2.5 concentration between 15.5µg.m−3and 40.4µg.m−3is 75.4%. POLDER observations are performed only in cloud-free conditions. In consequence, there are much less POLDER observations than PM2.5 data for a given site. If we consider the 28 sta-tions, we have 2577 POLDER observations against 4573 for PM2.5 measurements from April to October, i.e. a ratio be-tween the two data sets of 56%. The number of PM2.5 obser-vations that exceed the 15.5µg.m−3threshold is 1497 while
the number of values of POLDER AOT above 0.17 is 817. However, we have estimated the relative difference between the number of PM2.5 and POLDER AOT observations as-sessed to be in the “Moderate” AQC, computed according to Eq. (1):
εmod erate= (1)
P Nstation
N b(PM2.5≥15.5µg/m3) P
Nstation
N b(PM2.5)
− P Nstation
N b(AOTPOLDER≥0.17) P
Nstation
N b(AOTPOLDER)
Whereεmoderate is the relative difference between both kind
of measurements and Nb is the number of observations for each PM station, numbered from 1 to Nstation (28 over France). We have evaluatedεmoderate to 1%. As we observe
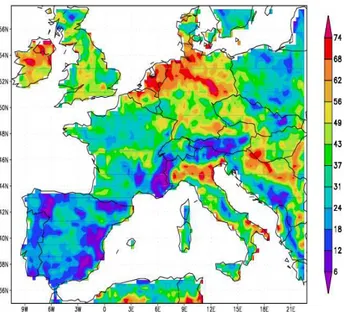
Fig. 6. Number of daily observations with a POLDER AOT above
0.17 and given as a percentage of the total number of observations during the POLDER-2 period (April–October 2003).
It should be noted that this threshold is based on a 7-month period from April to October 2003 and might be different in winter conditions. Moreover, the relationship between column aerosol optical thickness derived from satellite im-agery and fine particulate mass ground-based measurements (PM2.5) is not straightforward and depends on the vertical resolution of the particles and their optical and microphysical properties. To those uncertainties should be added the ones on both type of measurements. In the case of the satellite in-version algorithm, there could be a major influence of the sur-face representation, the different aerosol model and the spa-tial resolution. Furthermore, to obtain our POLDER thresh-old for PM2.5 AQC assessment we have used several ground-based stations scattered over France associated to moderate aerosol loads but it should be validated over a broader area, especially over the most polluted regions of the world like Asia. Applying this threshold to all POLDER AOT over Western Europe allows to derive a map (see Fig. 6) of the percentage of days in the Moderate AQC during the period of April to October 2003. We can notice on Fig. 6 that POLDER shows that the main industrial areas of Western Europe, like the Netherlands, North Germany or Northern Italy are char-acterized by the highest frequency of days with Moderate air quality.
4 Conclusions
We have used for the first time 7 months of POLDER-2 re-trieved AOT over France in 2003 to characterize aerosol pol-lution load at the ground on a regional scale. POLDER AOT
retrieval algorithm over land is based on the measurement of the linear polarization of the light backscattered to space. The algorithm is particularly sensitive to aerosol particles in the accumulation mode that polarize the signal. Based on a comparison with Sun photometer derived volume size dis-tribution, we show that POLDER derived AOT is well cor-related to the atmospheric aerosol submicron volume frac-tion. This capacity to monitor the aerosol fine fraction is con-firmed by the significant correlation obtained when compar-ing directly the POLDER derived AOT with ground-based PM2.5 data. The comparison between collocated daily av-eraged PM2.5 and POLDER derived AOT shows a lot of scattering, which might be due to the influence of the ver-tical distribution of the aerosol in the atmosphere. However, we find a significant correlation between POLDER AOT and PM2.5 over the 28 stations considered in this study. We have statistically tested the ability of the POLDER AOT measure-ments to assess the two first EPA Air Quality Categories. The lack of higher PM2.5 concentrations in our data set prevents us from studying the other AQC. For the first AQC, the fre-quency of occurrence of daily PM2.5 below 15.5µg.m−3is decreasing as a function of the POLDER AOT. We have as-sessed that a threshold of 0.17 for the POLDER AOT can be used to estimate the frequency of days showing a “Moder-ate” AQC. A further validation of this estimate still needs to be carried on at a broader scale, especially for the regions of the world the most affected by particle air pollution. It should also be mentioned that our study is limited to the period of POLDER-2’s lifetime between April–October 2003, and that both PM/AOT relationships and POLDER AOT threshold for estimating AQC might be significantly different in the win-ter season. The winwin-ter season is generally characwin-terized by a shallow boundary layer, leading to an increase of the slope of the regression between PM2.5 and AOT while the given threshold for the Moderate AQC should be lower. Moreover, a comprehensive investigation of the impact of the vertical distribution of aerosols in the relationship between ground-based PM2.5 and AOT measurements is now required to bet-ter analyze the capability of POLDER or other space-based passive remote sensors observations in estimating aerosol pollution events.
Acknowledgements. The French space agency, CNES and the
Nord-Pas-De-Calais regional council support this research. We thank ADEME for providing the PM2.5 data and the AERONET/PHOTONS network for the Sun photometer data. This work is within the frame of the Institut de Recherche en Environnement Industriel (IRENI).
References
Al Saadi, J., Szykman, J., Pierce, R. B., Kittaka, C., Neil, D., Chu, D. A., Remer, L. A., Gumley, L., Prins, E., Weinstock, L., MacDonald, C., Wayland, R., Dimmick, F., and Fish-man, J.:, Improving national air quality forecasts with satel-lite aerosol observations, Bull. Am. Meteorol. Soc., 1249–1261, doi:10.1175/BAMS-86-9-1249, 2005.
Anderson, T. L., Charlson, R. J., Schwartz, S. E., Knutti, R., Boucher, O., Rodhe, H., and Heintzenberg, J.: Climate forcing by aerosols – A hazy picture, Science, 300, 1103–1104, 2003. Boucher, O. and Tanr´e, D.: Estimation of the aerosol perturbation to
the Earth’s radiative budget over oceans using POLDER satellite aerosol retrievals, Geophys. Res. Lett., 27, 1103–1106, 2000. Br´eon, F.-M. and Colzy, S.: Cloud detection from the spaceborne
POLDER instrument and validation against surface synoptic ob-servations, J. Appl. Meteorol., 36, 777–785, 1999.
Br´eon, F.-M., Tanr´e, D., and Generoso, S.: Aerosol effect on cloud droplet size monitored from satellite, Science, 295, 834–838, 2002.
Chu, D. A., Kaufman, Y. J., Zibordi, G., Chern, J. D., Mao, J., Li, C., and Holben, B. N.: Global monitoring of air pollution over land from Earth Observing System-Terra Moderate Reso-lution Imaging Spectroradiometer (MODIS), J. Geophys. Res., 108, doi:10.1029/2002JD003179, 2003
Deuz´e, J.-L., Br´eon, F.-M., Devaux, C., Goloub, P., Herman, M., Lafrance, B., Maignan, F., Marchand, A., Nadal, F., Perry, G., and Tanr´e, D.: Remote sensing of aerosols over land surfaces from POLDER-ADEOS-1 polarized measurements, J. Geophys. Res., 106, 4913–4926, 2001.
Dubovik, O. and King, M. D.: A flexible inversion algorithm for retrieval of aerosol optical properties from sun and sky radi-ance measurements, J. Geophys. Res., 105(D16), 20 673–20 696, 2000.
Dubovik, O., Smirnov, A., Holben, B. N., King, M. D., Kauf-man, Y. J., Eck, T. F., and Slutsker, I.: Accuracy assessments of aerosol optical properties retrieved from Aerosol Robotic Net-work (AERONET) Sun and Sky radiance measurements, J. Geo-phys. Res., 105(D8), 9791–9806, 2000.
Engel-Cox, J. A., Holloman, C. H., Coutant, B. W., and Hoff, R. M.: Qualitative and quantitative evaluation of MODIS satellite sensor data for regional and urban scale air quality, Atmos. Environ., 38, 2495–2509, doi:10.1016/j.atmosenv.2004.01.039, 2004.
Hodzic, A., Vautard, R., Bessagnet, B., Lattuati, M., and Moreto, F.: Long-term urban aerosol simulation versus routine particulate matter observations, Atmos. Environ., 5851–5864, 2005 Holben, B. N., Eck, T. F., Sluster, I., Tanr´e, D., Buis, J. P.,
Set-zer, A., Vermote, E., Reagan, J. A., Kaufman, Y. J., Nakajima, T., Lavenu, F., Jankowiak, I., and Smirnov, Z.: AERONET-A federated instrument network and data archive for aerosol char-acterisation, Rem. Sens. Environ., 66, 1–16, 1998.
Kaufman, Y. J., Tanr´e, D., and Boucher, O.: A satellite view of aerosols in the climate system, Nature, 419, 215–223, 2002. King, M. D., Kaufman, Y. J., Tanr´e, D., and Nakajima, T.: Remote
sensing of tropospheric aerosols from space: past present and future, Bull. Am. Meteorol. Soc., 80(11), 2229–2259, 1999. L´eon, J.-F. and Legrand, M.: Mineral dust sources in the
surround-ing of the North Indian Ocean, Geophys. Res. Lett., 30(6), 1309, doi:10.1029/2002GL016690, 2003.
Li, C., Lau, A. K., Mao, J., and Chu, D. A.: Retrieval, valida-tion, and application of the 1-Km aerosol optical depth From MODIS measurements over Hong Kong, EEE Trans. Geosci. Re-mote Sens., 43(11), 2650–2658, 2005.
Nadal, F. and Br´eon, F. M.: Parametrisation of surface polarised reflectance derived from POLDER spaceborne measurements, IEEE Trans. Geosci. Remote Sens., 37, 1709–1718, 1999. Smirnov, A., Holben, B. N., Eck, T. F., Slutsker, I., Chatenet, B.,
and Pinker, R. T.: Diurnal variability of aerosol optical depth ob-served at AERONET (Aerosol Robotic Network) sites, Geophys. Res. Lett., 29(23), 2115, doi:10.1029/2002GL016305, 2002. Tanr´e, D., Br´eon, F.-M., Deuz´e, J.-L., Herman, M., Goloub, P.,
Nadal, F., and Marchand, A.: Global observation of anthro-pogenic aerosols from satellite, Geophys. Res. Lett., 28(24), 4555–4558, 2001.
Vermeulen, A., Devaux, C., and Herman, M.: Retrieval of the scat-tering and microphysical properties of aerosols from ground-based optical measurements including polarization. I. Method, Appl. Opt., 39(33), 6207–6220, 2000.