www.atmos-chem-phys.net/11/5805/2011/ doi:10.5194/acp-11-5805-2011
© Author(s) 2011. CC Attribution 3.0 License.
Chemistry
and Physics
A reanalysis of MODIS fine mode fraction over ocean using OMI
and daily GOCART simulations
T. A. Jones1,3and S. A. Christopher1,2
1Earth System Science Center, UAHuntsville, Huntsville, AL, USA 2Department of Atmospheric Sciences, UAHuntsville, Huntsville, AL, USA 3Cooperative Institute for Mesoscale Meteorological Studies, Norman, OK, USA
Received: 30 July 2010 – Published in Atmos. Chem. Phys. Discuss.: 7 December 2010 Revised: 11 May 2011 – Accepted: 17 June 2011 – Published: 22 June 2011
Abstract. Using daily Goddard Chemistry Aerosol Ra-diation and Transport (GOCART) model simulations and columnar retrievals of 0.55 µm aerosol optical thickness (AOT) and fine mode fraction (FMF) from the Moderate Resolution Imaging Spectroradiometer (MODIS), we esti-mate the satellite-derived aerosol properties over the global oceans between June 2006 and May 2007 due to black car-bon (BC), organic carcar-bon (OC), dust (DU), sea-salt (SS), and sulfate (SU) components. Using Aqua-MODIS aerosol properties embedded in the CERES-SSF product, we find that the mean MODIS FMF values for each aerosol type are SS: 0.31±0.09, DU: 0.49±0.13, SU: 0.77±0.16, and (BC + OC): 0.80±0.16. We further combine information from the ultraviolet spectrum using the Ozone Monitoring Instrument (OMI) onboard the Aura satellite to improve the classification process, since dust and carbonate aerosols have positive Aerosol Index (AI) values>0.5 while other aerosol types have near zero values. By combining MODIS and OMI datasets, we were able to identify and remove data in the SU, OC, and BC regions that were not associated with those aerosol types.
The same methods used to estimate aerosol size charac-teristics from MODIS data within the CERES-SSF product were applied to Level 2 (L2) MODIS aerosol data from both Terra and Aqua satellites for the same time period. As ex-pected, FMF estimates from L2 Aqua data agreed well with the CERES-SSF dataset from Aqua. However, the FMF estimate for DU from Terra data was significantly lower (0.37 vs. 0.49) indicating that sensor calibration, sampling differences, and/or diurnal changes in DU aerosol size char-acteristics were occurring. Differences for other aerosol types were generally smaller. Sensitivity studies show that
Correspondence to:T. A. Jones ([email protected])
a difference of 0.1 in the estimate of the anthropogenic com-ponent of FMF produces a corresponding change of 0.2 in the anthropogenic component of AOT (assuming a unit value of AOT). This uncertainty would then be passed along to any satellite-derived estimates of anthropogenic aerosol radiative effects.
1 Introduction
their elevation (Torres et al., 2007). UV-absorbing aerosols include both elevated dust and black carbon, whereas sul-fates and sea-salt are not included. Using a combination of these data in conjunction with GOCART simulated aerosols, we estimate satellite-derived columnar aerosol properties for various aerosol types in both space and time. This distinc-tion is important since different aerosol types can produce different radiative effects (Christopher and Jones, 2008a).
One objective of this study is to present a follow-up to the analysis first discussed by Jones and Christopher (2007a) (hereafter JC07). In JC07, MODIS FMF, TOMS Aerosol In-dex (AI), and MOPITT Carbon Monoxide (CO) retrievals were combined with GOCART simulations (Chin et al., 2002, 2004) to assess the concentration, size, and vertical distribution of SS, DU, and AN (anthropogenic) aerosols. The goal of JC07 and the current research is to assess satellite-retrieved aerosol properties corresponding to indi-vidual aerosol types and determine what combination of these properties is unique to each aerosol type. Previous re-search (Kaufman et al., 2005a, b; Bellouin et al., 2005, 2008) and more recently Yu et al. (2009) has also employed similar techniques to assess aerosol characteristics through the use of satellite data. Kaufman et al. (2005a, b) developed a mathe-matical relationship between SS, DU, and AN AOT using as-sumptions about the FMF characteristics of each aerosol type to solve for either DU or AN AOT. The FMF values used to characterize these aerosol types were derived from averaging MODIS FMF retrievals in predefined regions where it was assumed that the total AOT was predominately from a sin-gle aerosol type. The resulting component AOT values were then used to estimate aerosol radiative effects from the indi-vidual aerosol types. Bellouin et al. (2005, 2008) performed a similar analysis though did not make a distinction between DU and SS aerosols. They also incorporated TOMS-AI data into the aerosol classification algorithm to further enhance its abilities. Finally, Yu et al. (2009) followed a similar method-ology as did Kaufman et al. (2005a, b), but analyzed the ef-fects of spatial and temporal variations in the SS AOT on the determination of aerosol components and showed that vari-ation in the SS component can have significant impacts on resulting estimates of anthropogenic aerosol forcing. Aver-age MODIS FMF values corresponding to individual aerosol types from each study are summarized in Table 1a. Fine mode aerosols are generally interpreted to be anthropogenic in nature whereas mechanically produced aerosols such as DU and SS are predominantly coarse mode. We use the term “predominantly” to note that SS and DU are not devoid of fine mode, and neither is smoke and sulfate completely de-void of coarse mode aerosols. However, many differences in FMF estimates remain between studies, especially when it comes to SS and AN (Yu et al., 2009). Using additional data sources such as TOMS-AI, JC07 attempted to reduce these uncertainties, but were only partially successful owing to several limitations.
We reexamine the previous study using improved meth-ods, updated datasets, and multi-dataset comparisons that are combined to produce a more accurate picture of satellite-retrieved aerosol properties. GOCART aerosol simulations are used in this study at a daily resolution compared to the monthly resolution available for JC07. Given that the MODIS aerosol properties were not available for everyday use during a particular month, we were required to make the assumption in JC07 that available data represented an ade-quate measure of the monthly average. We also replaced TOMS-AI with OMI-AI since the latter is available at a higher resolution and at nearly the same observation time as the Aqua MODIS data. Finally, we performed this analysis for three separate satellite datasets to assess the importance of instrument calibration, sampling, and diurnal variability to the retrieved properties of individual aerosol types. Overall, the goal of this research is to further refine satellite-derived aerosol properties for individual aerosol types using multi-ple data sets and two different techniques for determining where certain aerosol types are located. The first will use the boundaries defined by Kaufman et al. (2005a, b) while the second will use regions defined using the GOCART model. The average FMF for each aerosol type from both methods is computed for three separate data sets (one from Terra and two from Aqua). OMI-AI data is within the Aqua compar-ison to assess its ability to provide value-added information to the aerosol classification process. The sensitivity of an-thropogenic AOT due to differences in FMF estimates from different methods and data sets is then computed. This pro-vides an important tool for assessing the relative impacts of the characteristics of different assumptions of aerosol types on climate studies.
2 Data
2.1 CERES-SSF (Aqua)
Table 1.(a) Comparison of aerosol FMF estimates from previous research for SS, DU, and AN aerosol types. (b) Average component FMF from the Aqua Collection 5 CERES-SSF and MYD04, and MOD04 satellite products as well as the GOCART simulations for the regions defined using GOCART. (c) Same as (b), but averaged over the regions defined in Kaufman et al. (2005a, b) and also in Yu et al. (2009). AN aerosols represents the combination of anthropogenic sulfates and all carbonates. FMF values in parenthesis indicate average FMF values for CC, NSU, and ASU aerosol components, where available. Variability listed for this research represent the standard deviation of FMF within a particular aerosol component region.
(a) Previous Research
Study Sea-Salt Dust Anthro
Kaufman et al. (2005a) 0.30±0.10 0.50±0.05 0.90±0.05
Kaufman et al. (2005b) 0.32±0.07 0.51±0.05 0.92±0.03
Bellouin et al. (2005) 0.35±0.05 NA 0.83±0.05
JC (2007) 0.25±0.09 0.44±0.06 0.83±0.04
Yu et al. (2009) 0.45±0.05 0.37±0.05 0.90±0.05
(b) Present Research using GOCART defined regions
Dateset Sea-Salt Dust Anthro (CC, NSU, ASU)
GOCART 0.44±0.04 0.27±0.02 0.98±0.01 (0.99,0.99.0.97)
MOD04 C5 (Terra) 0.25±0.12 0.37±0.15 0.81±0.16 (0.81,0.74,0.81)
MYD04 C5 (Aqua) 0.34±0.11 0.46±0.14 0.76±0.18 (0.77,0.86,0.74)
CERES-SSF C5 (Aqua) 0.31±0.09 0.49±0.13 0.78±0.16 (0.80,0.69,0.77)
(c) Present Research using Kaufman et al. (2005a, b) regions
Dataset Sea-Salt Dust Anthro
GOCART 0.43±0.04 0.30±0.06 0.83±0.09
MOD04 C5 (Terra) 0.49±0.25 0.36±0.15 0.84±0.16
MYD04 C5 (Aqua) 0.50±0.21 0.40±0.16 0.83±0.14
CERES-SSF C5 (Aqua) 0.49±0.20 0.45±0.16 0.87±0.13
environments. The CERES-SSF product combines mea-surements from the CERES instrument with those from the MODIS on the same satellite using a point-spread function (PSF) to apply appropriate weights to the 10 km resolution MODIS Collection 5 AOT within each 20 km CERES foot-print. This product has been used extensively for studying aerosol forcing (e.g. Christopher et al., 2006).
2.2 MODIS (Terra and Aqua)
Aerosol properties are also derived from the Level-2 (L2), Collection 5 Terra (MOD04) and Aqua (MYD04) products for the same time period to compare against the MODIS val-ues contained within the Aqua CERES-SSF dataset. While the aerosol products in the CERES-SSF files are reported at the CERES instrument resolution of 20 km, the raw MODIS L2 AOT data are available at a higher 10 km resolution. The AOT uncertainty over the ocean is given asτ=0.03±0.05τ with FMF uncertainty on the order of 30 % (Remer et al., 2005). The greatest uncertainties in FMF occur when aerosol concentrations are low (τ <0.1), such as the case for sea-salt aerosols over otherwise clean ocean conditions (e.g.
Klei-dman et al., 2005). When aerosol concentrations are low, the differences in reflectances between bands necessary to retrieve aerosol size information become comparable with the uncertainties in reflectance measurements. The uncer-tainties must be noted when studying the size properties of aerosol in these conditions. Additional uncertainties in aerosol retrievals arise from the effects of nearby clouds (Zhang and Reid, 2006). To reduce these uncertainties, we remove all pixels where MODIS (MOD04) cloud fraction is greater than 30 % (Gupta and Christopher, 2008). The cloud fraction in the MOD04 aerosol product is derived from the MOD35 cloud mask. Comparing MODIS cloud fraction with FMF also showed that FMF does not appear to change sig-nificantly as a function of cloud fraction for most regions over the ocean until cloud fraction exceeds at least 50 % (Jones et al., 2009).
thresholds over a larger area, introducing a “clear-sky” bias to the data (Christopher and Jones, 2008b). The result of the bias is that AOT reported by the CERES-SSF product is un-derestimated compared to MODIS L2 AOT in regions where significant cloud cover is often present. Whether or not this bias translates into a difference in retrieved aerosol size char-acteristics will be examined as part of this study.
MODIS L2 data from the Terra satellite (MOD04) were also acquired and analyzed to determine if either instrument biases or diurnal changes in aerosol properties produce a measurable impact on observed aerosol size distributions. The Terra satellite is also a polar orbiter but has an equato-rial overpass time of approximately 1030 local time, or∼3 h before Aqua. Total aerosol concentrations are expected to be similar to Aqua observations, though Remer et al. (2008) noted an unexplained offset of 0.015 between Terra and Aqua AOT retrievals. The 3 h difference in observation time be-tween Terra and Aqua may also produce different results in certain regions due to diurnal variability in aerosol concen-trations, cloud cover, humidity, and sampling (e.g. Smirnov et al., 2002; Wang et al., 2004).
2.3 OMI-AI
The UV Aerosol Index (AI) from the Ozone Monitoring In-strument (OMI) on the Aura satellite has an equatorial over-pass time of about 1345 local time similar to that of Aqua and is used to assess UV-absorbing aerosols such as mineral dust. At nadir, the OMI pixel resolution is 13×24 km. We use level-2, Collection 3 AI which represents the difference in wavelength dependence of reflected radiation at 342.5 and 388 nm compared to a pure molecular (Rayleigh scattering) background (Torres et al., 2007). Large concentrations of DU or BC aerosols exhibit positive AI values whereas SU and SS have AI values near zero or slightly negative. Torres et al. (1998, 2002), Hsu et al. (1999), and Ginoux and Tor-res (2003) all noted an important sensitivity to UV-absorbing aerosols as a function of height. For a given aerosol con-centration, OMI-AI will be larger the higher in the atmo-sphere the aerosols exist. This sensitivity does not extend to non-absorbing aerosols. The sensitivity of OMI-AI to both aerosol type and height makes it useful for satellite-derived aerosol classification techniques. To account for sub-pixel cloud contamination, AI pixels whose quality flags indicate the presence of clouds (QC≥1) are removed from consider-ation.
2.4 GOCART
Since MODIS and OMI cannot separate each pixel into spe-ciated components a-priori, we use GOCART model simula-tions to estimate the aerosol composition (Chin et al., 2002, 2004). GOCART simulates global distributions of BC, OC, SU, DU, and SS aerosols. These simulations are used to determine aerosol speciation since we are updating a
pre-vious study that uses GOCART (JC07) . This model uses global emissions of aerosols and precursor gases from an-thropogenic, natural, and biomass burning sources and in-cludes transport and removal processes that are driven by as-similated meteorological fields. The simulated mass load-ings of each aerosol species are then converted to AOT us-ing mass extinction coefficients assumus-ing external mixus-ing and spherical particles. See Chin et al. (2002, 2003, 2004, 2009) for further details. Aerosol products modeled by GO-CART are produced with a spatial resolution of 2.5◦×2.0◦
with daily averaged data used in this research. GOCART defines FMF as the ratio of the sum of the optical depths from SU, BC, and OC, (which are assumed to be 100 % fine mode,re<0.5 µm), and fine mode components of DU and SS (re<1.0 µm) to the total AOT. For hygroscopic aerosols (i.e. all types except dust), aerosol size is also dependent on the surrounding atmospheric humidity with aerosols increas-ing in size for more humid environments (Chin et al., 2002). The naturally occurring and anthropogenic components of SU, OC, and BC are also simulated by GOCART, providing the opportunity for more in-depth analysis of these aerosol types. In particular, a significant amount of SU in the at-mosphere originates from volcanic emissions and to a lesser extent, dimethylsulfide (DMS) (Chin et al., 2009). On av-erage, 20 % of the total SU component of AOT is assumed to be from natural sources (Chin et al., 2002). The naturally occurring component of OC from biomass burning is also considered but only contributes less than 10 % to the total OC component of AOT. In addition, the naturally occurring component of BC is assumed to be zero. As a result, we do not discriminate between natural and anthropogenic carbon-ate aerosols for the remainder of this research. Finally, GO-CART provides vertical distributions of each aerosol species based on source region and atmospheric transport (Chin et al., 2007).
GOCART has been thoroughly validated over the years (e.g. Chin et al., 2009), but significant assumptions and un-certainties remain present that could cause errors when com-puting individual aerosol type regions. One important as-sumption made by GOCART is that aerosols are externally mixed, which means that aerosols do not chemically react or otherwise combine with one another. This is not always the case as internal mixing often occurs and can take the form of sulfate coated dust aerosols (Levin et al., 1996) and/or black carbon (Seland et al., 2008). Under these circumstances, the GOCART aerosol species computations may not be accurate; however, Chin et al. (2002) assumed that this uncertainty should be small.
mass-loadings simulated by individual models were found for DU and especially SS aerosol types. In particular, the SS mass loadings vary at least±50 % when all models are con-sidered. These variations were deemed to be primarily due to differences in the particle size distributions and source fluxes assumed by each model. Furthermore, DU and SS concen-trations are also highly dependent on assumed atmospheric conditions, especially wind speed. The sources for the atmo-spheric parameters assimilated into individual models vary from observations to numerical model analysis to long term climate averages. These variations combined with resolution differences can produce very different SS and DU produc-tion and transport characteristics. Since this study focuses on ocean regions only, the uncertainty in SS concentrations is a primary concern as we are using a threshold-based ap-proach to determine aerosol type regions as done in JC07. When considering OC, BC, and SU aerosols, much greater agreement exists between modeled mass-loadings as similar datasets are employed to estimate their spatial and tempo-ral emission characteristics (Textor et al., 2006). However, model-to-model differences in fine mode aerosol character-istics do remain present.
3 Methodology
The methodology used here closely follows that of JC07 where the swath-level aerosol (CERES-SSF and MODIS L2) and OMI-AI data are aggregated to the 2.0◦×2.5◦
resolu-tion corresponding to GOCART simulated products. For all satellite data, pixels with solar and/or viewing zenith angles greater than±60◦are removed due to increasing
uncertain-ties and pixel sizes at these extreme angles. Using this thresh-old has the impact of reducing sampling in high latitude re-gions during certain seasons. Areas corresponding to a sin-gle aerosol type for a given day are defined as areas where at least 80 % of the total GOCART simulated AOT for a par-ticular grid cell is accounted for by that aerosol type. The daily mean MODIS AOT and FMF values within that grid cell are compared with GOCART simulations. This is differ-ent than the method employed by Yu et al. (2009) where spe-cific geographical regions based on those defined by Kauf-man et al. (2005a) were chosen and assumed to be represen-tative of a single aerosol type (Fig. 1). An additional require-ment that MODIS AOT be less than 0.1 for SS aerosols is also included to remove possible cloud contamination noted in the southern hemisphere (Zhang and Reid, 2006). This analysis is performed globally for each day; thus, regions of a specific aerosol type are allowed to move and change in size as a function of space and time. AOT and FMF statis-tics for individual aerosol types are computed from all the daily pixels classified as belonging to an aerosol component region. Grid-cells with no dominant aerosol type are not in-cluded when computing the statistics. Corresponding proba-bility distributions are also shown to estimate the uncertainty
in these statistics as well as to compare the GOCART values to the satellite retrievals.
As in JC07, we compare regions of anthropogenic vs. nat-urally occurring SU aerosols, although we note that some uncertainty exists in this distinction. When comparing statis-tics with other research where only an anthropogenic AOT is reported, we combine GOCART anthropogenic SU, OC, and BC components to provide comparison FMF and OMI-AI statistics. We make the assumption that the naturally occur-ring components of OC and BC are relatively small as they only contribute∼10 % and 0 % to the GOCART OC and BC AOT, respectively. (GOCART assumes the natural compo-nent of BC is always 0 % even though small amounts are produced when naturally occurring OC is present). The same methods are applied for CERES-SSF and MODIS L2 data from Aqua and Terra to compare the differences in sampling assumptions and observation time on the AOT and FMF av-erages for each individual aerosol type region.
The threshold level (80 %) used to determine these re-gions was defined based on the work done by JC07 who showed that the variability in aerosol size properties for re-gions defined using 80 % or higher thresholds was very low at only a few percent. Both higher and lower thresholds were tested. Higher thresholds reduced sample size to an unacceptable level while reporting almost identical statistics whereas lower thresholds resulted in regions that contained significant contributions from more than one aerosol type. It is important to note that these thresholds were only tested using GOCART simulations and may require adjustment if other aerosol model simulations are considered. Over the oceans, the greatest uncertainty lies in the concentration and particle size properties of SS aerosols (Textor et al., 2006). If the simulated SS AOT were to be too high, this would re-quire the use of lower thresholds to determine regions where other aerosol types such as DU, SU, and BC exist. While the thresholds may differ, the resulting size and shape of the re-gions considered have good agreement given the greater cer-tainty in the properties of the remaining aerosol size regions. If the regions are similar, then the corresponding satellite-derived statistics will also be similar to those presented by this study.
For comparison with previous research by Kaufman et al. (2005a, b) and Yu et al. (2009), we calculate the same FMF statistics using oceanic regions defined by these stud-ies as being primarily associated with a single aerosol type. Their SS region lies in the southern hemisphere away from most DU or AN sources (20◦–30◦S; 50◦–120◦E) for the
entire year (Fig. 1). Dust FMF values are obtained west of the North African coast (15◦W–20◦W; 15◦N–20◦N)
be-tween June and October, while AN values are obtained from the Western Atlantic (65◦W–85◦W (±5◦); 40◦N–50◦N) for
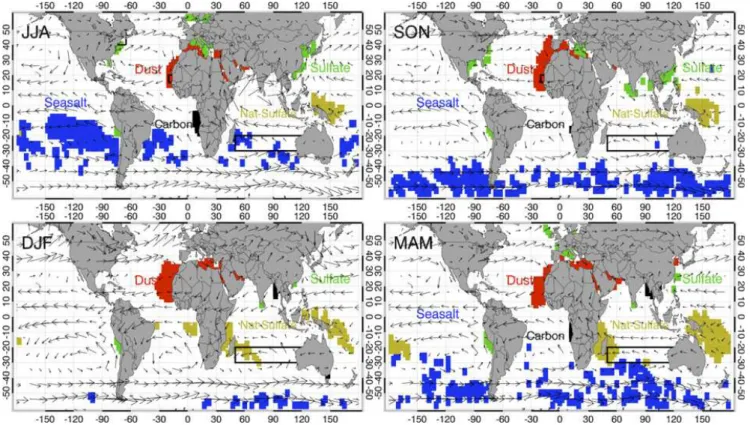
Fig. 1. Global aerosol distributions where at least 80 % of the total GOCART AOT is represented by a single aerosol type (sea-salt, dust, natural sulfate, anthropogenic sulfate, or organic + black carbon) over the ocean between June 2006 and May 2007 for June, July, and August (JJA); September, October, and November (SON); December, January, and February (DJF); and March, April, and May (MAM). Black boxes show the regions defined by Kaufman et al. (2005a) corresponding to individual aerosol types (SS: west of Australia, DU: west of Africa, and AN: northeast of the United States). Vectors indicate the seasonally averaged 850-hPa wind speed and direction.
et al. (2005a, b) and Yu et al. (2009) used MODIS data from only the Terra satellite when computing their statistics. These data are listed in Table 1a.
4 Results
4.1 AOT & FMF statistics
The seasonal distributions of various aerosol types in GO-CART between June 2006 and May 2007 are evident in Fig. 1. Each color in this figure represents the location where one or more daily 2.0◦×2.5◦grid cells are classified as SS,
DU, CC, naturally and/or anthropogenic SU for each sea-son using the 80 % GOCART AOT threshold discussed in Sect. 3. (Organic and black carbon components are com-bined into a single carbon or CC type aerosol). The seasonal distributions shown here represent three-month averages of the daily data analyzed by this study. Actual spatial distri-butions vary from day to day. The fraction of total AOT from dust aerosols is greatest in the North Atlantic for all seasons due to mineral dust transported westward from the Sahara Desert. Anthropogenic SU regions occur off the east-ern coasts of North America and China as well as
surround-ing Europe near where significant amounts of pollution are present. Naturally occurring SU, primarily from volcanic ac-tivity (Indonesia), are dominant in several locations in the Southern Hemisphere. CC associated with biomass burning contributes the greatest fraction to the total AOT west of cen-tral Africa, while SS concentrations are mostly evident in the Southern Ocean south of 40◦S where average wind speeds
are greater than over more tropical oceanic regions. The spatial extent and locations of these regions change signifi-cantly as a function of time due to changes in atmospheric transport, stability, and aerosol production (JC07) (Fig. 1). Standard deviations of GOCART FMF for all aerosol com-ponents in this research are less than±0.05 indicating that the 80 % threshold being used to define component specific regions is adequate for estimating individual aerosol type characteristics.
Table 2. Yearly averaged GOCART AOT and FMF (GAOT, GFMF); sample size, AOT and FMF (AOT, FMF), and OMI-AI for sea-salt, dust, sulfates, and organic + black carbon between June 2006 and May 2007 for the Aqua CERES-SSF dataset.
Aerosol GAOT GFMF NUM AOT FMF OMI-AI
Sea Salt 0.088 0.449 487 0.08±0.03 0.31±0.09 0.14±0.3
Dust 0.657 0.267 1280 0.33±0.21 0.49±0.13 0.95±0.5
A-Sulfate 0.279 0.967 296 0.17±0.08 0.77±0.16 −0.08±0.3
N-Sulfate 0.306 0.986 627 0.08±0.05 0.69±0.20 0.07±0.2
Carbon 0.490 0.991 335 0.36±0.29 0.80±0.16 0.79±0.6
concentrations are much higher in DU and CC regions com-pared to SS and SU regions. This is important since the lower the total aerosol concentration, the more uncertainty in aerosol component classification. The mean FMF values for this dataset are SS: 0.31±0.09 (fss), DU: 0.49±0.13
(fdu), CC: 0.80±0.16 (fcc), natural SU: 0.69±0.20 (fnsu),
and anthropogenic SU: 0.77±0.16 (fasu) between June
2006 and 2007 (Table 2). Corresponding values from the MYD04 dataset are SS: 0.34±0.11, DU; 0.46±0.14, CC: 0.77±0.17, natural SU 0.68±0.20, and anthropogenic SU: 0.74±0.15, which are similar to the CERES-SSF values (Ta-ble 1b). Statistics computed using MOD04 L2 data from the Terra satellite showed some differences compared to the Aqua estimates, withfssbeing small andfccandfasubeing
higher (Table 1b). The standard deviation represents the vari-ability of all daily data with a region classified as belonging to an individual aerosol type. These values should not be in-terpreted as uncertainties (e.g. Yu et al., 2009), but rather a measure of the variability in aerosol properties for individual aerosol types. Given that sampling changes as a function of both space and time, the variability is likely to be large. As a result, these standard deviations are not necessarily com-parable with uncertainty estimates reported by some other studies.
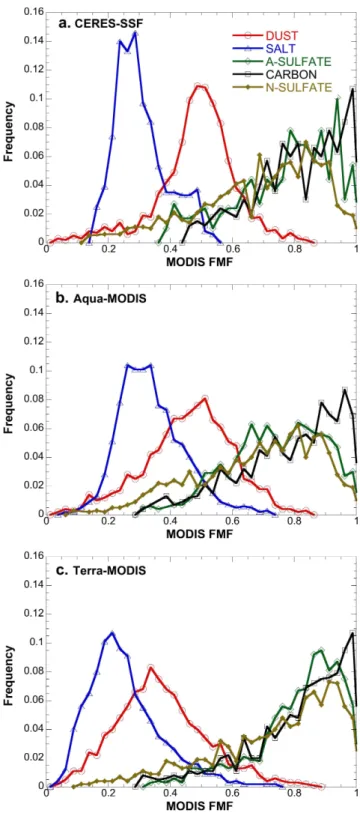
Overall variability is somewhat larger than reported by JC07 primarily due to the use of daily data in place of monthly averaged data (Table 1a, b). The distribution of MODIS FMF from the CERES-SSF product can be visual-ized in Fig. 2a, which shows the frequency distributions of FMF for the five aerosol types analyzed. Bothfssandfdu
have relatively normal distributions about the mean with the peak probability corresponding almost exactly with the mean value reported. As a result, regions being defined by GO-CART as corresponding to either DU or SS appear to have relatively uniform aerosol characteristics, and the FMF val-ues agree well with those reported independently by Kauf-man et al. (2005a, b) and JC07. Similar distributions were derived from MODIS L2 Aqua and Terra data over the same regions (Fig. 2b, c). In the case of Terra data, the maxi-mum probabilities of SS and DU occur at lower FMF values (larger coarse mode component) while the maxima for other aerosol types occur at higher FMF values (larger fine-mode component). This is consistent with mean values shown in
Table 1b. For all satellite datasets, our estimates of FMF as-sociated with anthropogenic aerosols (e.g. CC and SU) are consistently lower than some previous estimates. GOCART defines all SU and CC as fine mode; thus,fsuandfcc=1.0.
Kaufman et al. (2005a, b) and others have estimated FMF for these aerosol types to be approximately 0.9. Our estimates are approximately 0.1 lower, indicating a somewhat larger component of coarse mode aerosols in our regions compared to others. Further differences are also apparent when com-paring the CERES-SSF CC and SU distributions to those from the MODIS L2 data from Aqua and Terra. Details of these differences and their potential causes are examined in further detail below for each aerosol type.
4.1.1 Sea salt
The satellite estimates forfss using the regions defined by
the GOCART model are all less than 0.35, with the MODIS L2 Terra estimate being less than 0.3 (Table 1b). Good agree-ment exists between these estimates offssand those reported
by Kaufman et al. (2005a,b) for all datasets analyzed here (Table 1a, c). However, if we restrict “our data” to only those areas defined Kaufman et al. (2005a, b), then significant dif-ferences arise withfssincreasing to near 0.5 both Terra and
Aqua data sets (Table 1c). Yu et al. (2009) estimatesfssto be
Fig. 2. (a)Frequency distribution of FMF values from the CERES-SSF dataset for 0.025 bins where at least 80 % of the total GO-CART AOT is produced by an individual aerosol type. Both SS and DU have relatively uniform distributions around their mean values (0.31, 0.49). MODIS L2 Aqua and Terra data from the same time
period are shown in panels(b)and(c)respectively.
In the region between 40◦S and 60◦S, MODIS AOT was
lower and FMF was higher during SON and DJF than com-pared to the remainder of the season (Yu et al., 2009). How-ever, the SS region derived in this study is small, south of
−40◦S for DJF and also for JJA (Fig. 1). In JJA, the
satellite-viewing geometry thresholds reduce sampling below 40◦S;
thus, our SS statistics do not take into account aerosols fur-ther south during this season. For DJF, cloud clearing thresh-olds eliminate data over much of the same region. As a re-sult, it stands to reason that our yearly averaged values cor-respond best with the values noted by Remer et al. (2008) and Yu et al. (2009) for the seasons for which the largest SS samples exist south of−40◦S. Furthermore, changes in
atmospheric humidity over space and time can also lead to changes in sea-salt particle size. However, no significant dif-ferences in average total column RH were found between the GOCART and Kaufman et al. (2005a) SS regions during this one year period, and no significant correlation in monthlyfss
and RH was found for either sample. This is not to say that RH does not have an important effect on aerosol size. Rather, our analysis indicates other factors are more dominant when it comes to the variation infssobserved here. Also, note that
the cloud-clearing thresholds used likely remove the high-est humidity regions, reducing hygroscopic effects from our sample. Our results show that estimates offssfrom satellite
observations are highly dependent on the spatial and tempo-ral extent assumed when making these estimates. As sug-gested by Yu et al. (2009), it is clear that no single fss is
representative of all sea-salt aerosols around the globe. 4.1.2 Dust
Using the Aqua CERES-SSF dataset and the DU region de-fined using GOCART, our estimate forfdu is 0.49 with the
corresponding Aqua MYD04 estimate being 0.46 (Table 1b). Comparing our results forfdu against those reported by Yu
et al. (2009), GOCART simulations, and satellite data within regions specified by Kaufman et al. (2005), we find values generally between 0.3 and 0.45 (Table 1c). Yu et al. (2009) reported a FMF of 0.37 with the corresponding GOCART value being 0.30. The location of the Kaufman et al. (2005a) dust region lies within the GOCART region; thus, similar estimates between both methods would be expected. How-ever, previous research such as Kaufman et al. (2005a, b) and JC07 reportfdu closer to 0.5. Both Yu et al. (2009) and
GOCART indicate the presence of a greater proportion of coarse mode aerosols than compared to these previous esti-mates. It should be noted that Kaufman et al. (2005a, b) used Collection 4 MODIS data and, for later research, used Col-lection 5 MODIS data (e.g. Yu et al., 2009). Improvements in aerosol property characterizations between collection 4 and 5 reduced FMF values over the ocean between 20 and 50 % depending on aerosol type (Remer et al., 2008).
averaging between 0.4 and 0.45 for a larger area in the North Atlantic, which is not very different than the values reported here, especially when considering that non-dust re-gions were not excluded from their regional average. How-ever, when we compare the FMF values between MODIS L2 Terra and Aqua data, a significant difference infdu
be-comes apparent (Table 1b). The fdu estimate from Terra
data is much lower than the corresponding Aqua estimates (0.37 vs. 0.46 and 0.49) for the GOCART defined DU re-gion. This difference is also hinted at using the Kaufman et al. (2005a) DU region where the fdu is 0.36 for Terra
data, but greater than 0.4 for both Aqua datasets (Table 1c). Since the spatial and (daily) temporal sampling characteris-tics for the Terra and Aqua samples are quite similar, some-thing else is likely causing these differences. One possibil-ity is calibration differences between the two satellites, but previous studies have noted that if any difference does ex-ist, it is relatively small and within expected uncertainties (Remer et al., 2008). Another possibility lies in diurnal vari-ability of aerosol size distributions associated with individ-ual aerosol types. Smirnov et al. (2002) noted that the di-urnal variability of aerosol concentrations from AERONET data was generally less than 10 % for dust aerosols, though it was not reported whether or not changes in aerosol size characteristics occurred. This variability may also be a func-tion of changes in the vertical distribufunc-tion of aerosols dur-ing the day even though the total aerosol concentration re-mains unchanged. Atmospheric moisture content is unlikely to be the cause since dust aerosols are primarily hydropho-bic in nature. Finally, Redemann et al. (2006) observed that MODIS-Aqua overestimated angstrom exponent compared to MODIS-Terra for DU aerosols using Collection 4 data, which is consistent with the higher FMF values for DU from Terra observed by this study. The difference was attributed to problems in the 1.6 µm channel on MODIS-Aqua and the later overpass time. It would appear from the results pre-sented here that the update from Collection 4 to Collection 5 may not account for this possible issue.
4.1.3 Sulfates and carbonates
Additional differences between methods and datasets are ap-parent when comparing our FMF estimates of SU and CC against those from previous studies (Table 1a). We estimate mean FMF values for anthropogenic (fasu)and naturally
oc-curring sulfate (fnsu) to be 0.77 and 0.69 with the
corre-sponding total carbonate value (fcc)of 0.80 using the Aqua
CERES-SSF dataset and GOCART defined regions (Ta-ble 1b). Results from the Aqua and Terra MODIS L2 datasets are similar, with Terra the combined anthropogenic (SU+CC) FMF values being somewhat higher (0.81 vs. 0.76). Model-ing and observational studies have indicated that carbonates from African savanna burning are somewhat smaller in size than sulfates; thus, these aerosols should have slightly higher FMF estimates (e.g. Dubovik et al., 2002). The frequency
distributions of both are much broader than for either SS or DU aerosols for all three datasets indicating a presence of multiple aerosol types in regions GOCART classifies as pre-dominately fine mode (Fig. 2). Recall that GOCART defines all SU and CC as fine mode aerosols and does not consider internal mixing (Chin et al., 2002, 2004). Thus, there exists an apparent difference in FMF estimates between GOCART and satellite observations within the same regions. Part of this difference may also be due to coarse mode aerosols (ei-ther DU or SS) being present in small concentrations, but not being simulated by GOCART. Compared to DU and CC regions, AOT retrievals associated with anthropogenic and especially naturally occurring SU regions are much smaller (Table 2), leading to increased uncertainty in aerosol size es-timates (Kleidman et al., 2005). Even small uncertainties in the coarse or fine mode components of AOT can have sig-nificant effects to observed FMF. Given the variability in SS aerosol properties from various aerosol models, the combi-nation of a slight underestimate of SS AOT coupled with rel-atively low fine mode aerosol concentrations could produce regions that contain a greater component of SS aerosols than would otherwise be the case. In this instance, FMF estimates for SU and CC regions would be lower, which is consistent with our observations.
Table 3.Anthropogenic AOT (τan)derived using the FMF statistics from Kaufman et al. (2005a), Yu et al. (2009), and our Aqua and
Terra estimates. Assumptions include an observed unit AOT (τ=
1.0), an observed FMF of 0.7 and a constant sea salt AOT of 0.06.
τan
Previous research
Kaufman et al. (2005a) 0.53
Yu et al. (2009) 0.61
Present study using GOCART regions
MOD04 C5 (Terra) 0.69
MYD04 C5 (Aqua) 0.82
CERES-SSF C5 (Aqua) 0.76
4.2 Uncertainty in anthropogenic AOT
The importance of differences in aerosol component FMF values between methods and satellites to estimate anthro-pogenic aerosol radiative effects can be illustrated by plug-ging in the various estimates and uncertainties listed above into the equation for the anthropogenic component of AOT (τan)given by Eq. (1) (Kaufman et al., 2005a):
τan= [(f−fdu)τ−(fss−fdu)τss]/(fan−fdu) (1)
To compute differences inτanas a function of various FMF
statistics, we assume a unit value for total AOT (τ=1) and constant values for sea salt AOT (τss=0.06) and an observed
FMF (f=0.7). Using the original Kaufman et al. (2005a) thresholds, the anthropogenic component of AOT is 0.53 (Ta-ble 3). However, this value increases to 0.61 when substitut-ing the values from Yu et al. (2009) and increases even fur-ther to between 0.7 and 0.8 using the FMF values produced from this research. It should be noted that when using a tem-porally varyingfss, Yu et al. (2009) actually show a reduction
of 20 % in the anthropogenic component of AOT compared to Kaufman et al. (2005a). Overall, a variation infanby 0.1
results in a change inτanof approximately 0.2 when the
to-tal AOT is 1.0. This uncertainty increases further if aerosol size properties change as a function of space and time, which does occur (JC07; Yu et al., 2009). We must caution that the relationship between uncertainty in anthropogenic AOT and anthropogenic radiative effects are not necessary linear; however, that assumption is made here in order to give a first-order estimate of this relationship. To further reduce uncer-tainties in aerosol type classifications, further information is needed beyond that available only from the MODIS.
4.3 OMI-AI
We use the Aerosol Index (AI) derived from the OMI to as-sess UV-absorbing aerosols such as DU and CC. OMI-AI for these aerosols are clearly positive (mean values being 0.95
Fig. 3. Frequency distribution of OMI-AI for each aerosol type. Note that the AI frequency distribution of dust and carbon is dis-placed to the right (more positive) of the other aerosol types.
and 0.79) and have a frequency distribution whose values are greater than those for SS and both natural and anthro-pogenic SU where mean AI values are only 0.07 and−0.08, respectively (Table 2, Fig. 3). OMI-AI is somewhat smaller for CC than for DU, since the CC types includes a compo-nent of non-absorbing OC aerosols. By combining MODIS FMF and OMI-AI, we can gain a better sense of aerosol speciation from a remote sensing perspective than from ei-ther sensor alone. Plotting OMI-AI against FMF from the Aqua CERES-SSF dataset reveals a good separation in the satellite-derived properties of the various aerosol types stud-ied. An OMI-AI value of 0.5 separates the majority of SS and SU from DU and CC. Similar values were used by Bellouin et al. (2005, 2008) to separate absorbing from non-absorbing aerosols when estimating anthropogenic aerosol radiative ef-fects. DU and the BC component of CC are UV absorbing and are often located higher in the atmosphere; thus, they produce greater AI values. In Fig. 4, the relationship between AI and MODIS AOT is also apparent with higher values of AI clearly corresponding to higher values of AOT, denoted by increasing symbol sizes. Comparing AI against FMF, it is evident that a combination of FMF and AI denote regions associated with either DU or CC aerosols. Similarly, for AI<0.5, SS and SU can be separated with most SS aerosols occurring when FMF<0.4. Symbol sizes for both SS and SU are smaller corresponding to lower overall aerosol con-centrations compared to either DU or CC (Table 2). A signif-icant portion of SU classified data points with MODIS FMF values lie between 0.4 and 0.6, indicating the presence of ad-ditional coarse mode aerosols beyond just fine mode SU.
Table 4.Aqua CERES-SSF sample size (NUM) and mean FMF values for OMI-AI<0.5 and OMI-AI>0.5 samples showing the influence of UV-absorbing aerosols on the resultant statistics. Note that large differences appear when comparing SU and CC samples where the FMF for absorbing CC is much greater than the non-absorbing samples and the non-absorbing FMF for SU is greater than the absorbing sample.
AI<0.5 AI>0.5 ALL
Aerosol NUM FMF NUM FMF NUM FMF
Sea Salt 453 0.29±0.09 34 0.28±0.06 487 0.31±0.09
Dust 230 0.54±0.14 1050 0.49+0.12 1280 0.49±0.13
A-Sulfate 291 0.77±0.20 5 0.70±0.17 296 0.77±0.16
N-Sulfate 608 0.69±0.20 19 0.55±0.20 627 0.69±0.20
Carbon 120 0.74±0.18 215 0.84±0.14 335 0.80±0.16
non-absorbing (AI<0.5) and absorbing (AI>0.5) samples (Table 4). As expected, most of the DU and CC samples are absorbing while over 95 % of the SS and SU data fall within the non-absorbing sample. FMF estimates for non-absorbing SS and SU and absorbing DU are similar to those calculated from the combined sample with similar standard deviations. If we examine the few points where natural or anthropogenic SU have AI>0.5, we find a much reduced FMF estimate (fasu=0.70 vs. 0.77 and fnsu=0.55 vs. 0.69), indicating
the AI threshold removes non-sulfate, coarse mode aerosols from the remaining SU sample (Table 4). While the overall estimate forfsu still did not change significantly, the
over-all distribution is more biased toward high FMF values than previously. Using the AI threshold also makes a significant difference when considering the CC sample. For absorbing CC,fccis 0.87 compared to an estimate of 0.74 for CC points
where AI<0.5. Since CC aerosols include some component of absorbing BC, the FMF estimate of 0.87 should be a better estimate of overall CC aerosol characteristics.
5 Conclusions
The combination of MODIS and OMI satellite-based re-trievals of aerosol properties coupled with GOCART simu-lated aerosol speciation provides a framework whereby satel-lite observations can be used to estimate the concentrations of individual aerosol types in the atmosphere. MODIS FMF values for aerosol types reported herein are similar to those presented by JC07. Computations across three different datasets (two from Aqua and one from Terra) show that SS contained the most coarse mode aerosols followed by DU, natural and anthropogenic SU, and finally CC, which is pre-dominately fine mode. However, FMF estimates from Terra, especially for DU, are somewhat different than those from Aqua implying different sensor calibration, a diurnal varia-tion in aerosol size characteristics, and/or sampling differ-ences due to cloud cover changes between the Terra and Aqua overpass times. We recommend that future research using MODIS FMF data to estimate component radiative
ef-Fig. 4. OMI-AI as a function of MODIS FMF color-coded by aerosol type, with increasing symbol sizes representing larger
MODIS AOT in bins of (0.0<0.3; 0.3<0.6; 0.6<0.9; and
AOT>0.9).
fects use the FMF values corresponding to a specific satellite until the differences observed between the various datasets are better understood.
higher FMF value than the remaining points where AI<0.5 (0.84 vs. 0.74). This shows that OMI-AI is quite useful in improving the discrimination between CC and other types of aerosols that may be present. Future research will apply these improved aerosol classification techniques to better quantify the aerosol radiative effects of individual aerosol types.
The frequency distributions of FMF and AI for SS and DU aerosols are relatively uniform around the mean providing high confidence in these sample values for all three datasets examined here. However, much broader distributions were observed for CC and, especially, SU indicating greater vari-ability in observed statistics for these aerosol types. Regions defined as primarily SU likely have a somewhat larger com-ponent of coarse mode aerosols than the model indicates, which reduces both natural and anthropogenicfsu estimates
over that expected from other studies such as Kaufman et al. (2005a, b) and Yu et al. (2009). This may be due to uncertainties in the SS component of AOT within the GO-CART model causing the SU and CC regions to incorporate too much background SS into their FMF estimates. Uncer-tainties in MODIS fine vs. coarse mode AOT retrievals for low aerosol concentrations may also play a role. The addi-tion of AI thresholds increased the FMF estimate for both CC and SU aerosols by removing pixels where observations indicate a non-trivial component of AOT is a result of ab-sorbing aerosols. Despite the large variations associated with both natural and anthropogenicfsu, the difference between
it and fcc is large enough (>0.1) to be considered
signifi-cant. Thus, combining both these aerosols types into a sgle “anthropogenic” classification may actually further in-crease downstream uncertainties in derived aerosol radiative effects. Given the magnitude of what small changes in FMF estimates can do to the “anthropogenic” component of AOT (and radiative forcing estimates), great care must be taken when assessing aerosol radiative forcing from a satellite re-mote sensing perspective.
Acknowledgements. This research is supported by NASA’s radia-tion sciences, interdisciplinary sciences, and ACMAP programs. CERES-SSF data were obtained through the NASA Langley Distributed Active Archive Center and MODIS L2 aerosol data were obtained though the Level 1 and Atmosphere Archive and Distribution System. Special thanks to Mian Chin for providing access to the GOCART model output used in this research and for the valuable comments provided during the compilation of this manuscript.
Edited by: M. Schulz
References
Bellouin, N., Boucher, O., Haywood, J., and Reddy, M. S.: Global estimate of aerosol direct radiative forcing from satellite mea-surements, Nature, 438, 1138–1141, doi:10.1038/nature04348, 2005.
Bellouin, N., Jones, A., Haywood, J., and Christopher, S.
A.: Updated estimate of aerosol direct radiative forcing
from satellite observations and comparison against the Hadley Centre climate model, J. Geophys. Res., 113, D10205, doi:10.1029/2007JD009385, 2008.
Chin, M., Ginoux, P., Kinne, S., Torres, O., Holben, B., Duncan, B., Martin, R., Logan, J., Higurashi, A., and Nakajima, T.: Aerosol distributions and radiative properties simulated in the GOCART model and comparisons with observations, J. Atmos. Sci., 59, 461–483, 2002.
Chin, M., Ginoux, P., Lucchesi, R., Huebert B., Weber, R., Anderson, T., Masonis, S., Blomquist, B., Bandy, A., and Thornton, D.: A global aerosol model forecast for the ACE-Asia field experiment, J. Geophys. Res., 108(D23), 8654, doi:10.1029/2003JD003642, 2003.
Chin, M., Chu, D., Levy, R., Remer, L., Kaufman, Y., Hoblen, B., Eck, T., and Ginoux, P.: Aerosol distribution in the Northern Hemisphere during ACE-Asia: Results from global model, satel-lite observations, and Sun photometer measurements, J. Geo-phys. Res., 109, D23S90, doi:10.1029/2004JD004829, 2004. Chin, Mian, Diehl, T., Ginoux, P., and Malm, W.: Intercontinental
transport of pollution and dust aerosols: implications for regional air quality, Atmos. Chem. Phys., 7, 5501–5517, doi:10.5194/acp-7-5501-2007, 2007.
Chin, M., Diehl, T., Dubovik, O., Eck, T. F., Holben, B. N., Sinyuk, A., and Streets, D. G.: Light absorption by pollution, dust, and biomass burning aerosols: a global model study and evaluation with AERONET measurements, Ann. Geophys., 27, 3439–3464, doi:10.5194/angeo-27-3439-2009, 2009.
Christopher, S. A. and Jones, T. A.: Satellite-based
assess-ment of cloud-free net radiative effect of dust aerosols over the Atlantic Ocean, Geophys. Res. Lett., 34, L02810, doi:10.1029/2006GL027783, 2007.
Christopher, S. A. and Jones, T. A.: Short-wave aerosol radiative ef-ficiency over the global oceans derived from satellite data, Tellus, 60B, 636–640, 080529042315537, 2008a.
Christopher, S. A. and Jones, T. A.: Sample Bias Estimation for Cloud-Free Aerosol Effects Over Global Oceans, IEEE T. Geosci. Remote, 46(6), 1728–1732, 2008b.
Christopher, S. A., Zhang, J., Kaufman, Y. J., and Remer, L. A.: Satellite-based assessment of top of atmosphere anthropogenic aerosol radiative forcing over cloud-free oceans, Geophys. Res. Lett., 33, L15816, doi:10.1029/2005GL025535, 2006.
Dubovik, O., Holben, B. N., Eck, T. F., Smirnov, A., Kaufman, Y. J., King, M. D,. Tanre, D., and Slutsker, I.: Variability of ab-sorption and optical properties of key aerosol types observed in worldwide locations, J. Atmos. Sci., 59, 590–608, 2002. Ginoux, P. and Torres, O.: Empirical TOMS index for dust aerosol:
Applications to model validation and source characterization, J. Geophys. Res., 108(D17), 4534, doi:10.1029/2003JD003470, 2003.
2008.
Hsu, N. C., Herman, J. R., Gleason, J. F., Torres, O.,
and Seftor, C. J.: Comparisons of the TOMS aerosol
in-dex with Sun-photometer aerosol optical thickness: Results and applications, J. Geophys. Res., 104(D6), 6269–6280, doi:10.1029/1998JD200086, 1999.
Jones, T. A. and Christopher, S. A.: MODIS derived fine mode frac-tion characteristics of marine, dust, and anthropogenic aerosols over the ocean, constrained by GOCART, MOPITT, and TOMS, J. Geophys. Res., 112, D22204, doi:10.1029/2007JD00897, 2007a.
Jones, T. A. and Christopher, S. A.: Statistical variability of top of atmosphere cloud-free shortwave aerosol radiative effect, At-mos. Chem. Phys., 7, 2937–2948, doi:10.5194/acp-7-2937-2007, 2007b.
Jones, T. A., Christopher, S. A., and Quaas, J.: A six year satellite-based assessment of the regional variations in aerosol indirect effects, Atmos. Chem. Phys., 9, 4091–4114, doi:10.5194/acp-9-4091-2009, 2009.
Kaufman, Y. J., Boucher, O., Tanre’, D., Chin, M., Remer, L. A., and Takemura, T.: Aerosol anthropogenic component es-timated from satellite data, Geophys. Res. Lett., 32, L17804, doi:10.1029/2005GL023125, 2005a.
Kaufman, Y. J., Koren, I., Remer, L. A., Tanre’, D., Gi-noux, P., and Fan, S.: Dust transport and deposition observed from the Terra-Moderate Resolution Imaging Spectroradiometer (MODIS) spacecraft over the Atlantic Ocean, J. Geophys. Res., D10S12, doi:10.1029/2003JD004436, 2005b.
Kleidman, R., O’Neill, N., Remer, L., Kaufman, Y., Eck, T., Tanr´e, D., Dubovik, O., and Holben, B.: Comparison of Moderate Resolution Imaging Spectroradiometer (MODIS) and Aerosol Robotic Network (AERONET) remote-sensing retrievals of aerosol fine mode fraction over ocean, J. Geophys. Res., 110, D22205, doi:10.1029.2005JD005760, 2005.
Levin, Z., Ganor, E., and Gladstein, V.: The effects of desert parti-cles coated with sulfate on rain formation in the eastern Mediter-ranean, J. Appl. Meteor., 35, 1511–1523, 1996.
Loeb, N. G. and Manalo-Smith, N.: Top-of-atmosphere direct radia-tive effect of aerosols over global oceans from merged CERES and MODIS observations, J. Climate, 18, 3506–3526, 2005. Redemann, J., Zhang, Q., Schmid, B., Russell, P. B., Livingston,
J. M., Jonsson, H., and Remer, L. A.: Assessment of MODIS-derived visible and near-IR aerosol optical properties and their spatial variability in the presence of mineral dust, Geophys. Res. Lett., 33, L18814, doi:10.1029/2006GL026626, 2006.
Remer, L. A., Kaufman, Y. J., Tanr´e, D., Mattoo, S., Chu, D. A., Martins, J. V., Li, R.-R., Ichoku, C., Levy, R. C., Kleidman, R. G., Eck, T. F., and Vermote, E.: The MODIS Aerosol Algorithm, Products and Validation. J. Atmos. Sci., 62, 947–973, 2005. Remer, L. A., Kleidman, R. G., Levy, R. C., Kaufman, Y.,
Tanre’, D., Mattoo, S., Martins, J., Ichoku, C., Koren, I., Yu, H., and Holben, B.: Global aerosol climatology from the MODIS satellite sensors, J. Geophys. Res. 113, D14S07, doi:10.1029/2007JD009661, 2008.
Seland, O., Iversen, T., Kirkevag, A., and Storelvmo, T.: On basic shortcomings of aerosol-climate interactions in atmo-spheric GCMs, Tellus, 60A, 459–491, doi:10.1111/j.1600-0870.2008.00318.x, 2008.
Smirnov, A., Holben, B. N., Eck, T. F., Slutsker, I., Chatenet, B., and Pinker, R. T.: Diurnal variability of aerosol optical depth ob-served at AERONET (Aerosol Robotic Network) sites, Geophys. Res. Lett., 29, 2115, doi:10.1029/2002GL016305, 2002. Textor, C., Schulz, M., Guibert, S., Kinne, S., Balkanski, Y., Bauer,
S., Berntsen, T., Berglen, T., Boucher, O., Chin, M., Dentener, F., Diehl, T., Easter, R., Feichter, H., Fillmore, D., Ghan, S., Gi-noux, P., Gong, S., Grini, A., Hendricks, J., Horowitz, L., Huang, P., Isaksen, I., Iversen, I., Kloster, S., Koch, D., Kirkev˚ag, A., Kristjansson, J. E., Krol, M., Lauer, A., Lamarque, J. F., Liu, X., Montanaro, V., Myhre, G., Penner, J., Pitari, G., Reddy, S., Seland, Ø., Stier, P., Takemura, T., and Tie, X.: Analysis and quantification of the diversities of aerosol life cycles within Ae-roCom, Atmos. Chem. Phys., 6, 1777–1813, doi:10.5194/acp-6-1777-2006, 2006.
Torres, O., Bhartia, P. K., Herman, J. R., Ahmad, Z., and Gleason, K.: Derivation of aerosol properties from satellite measurements of backscattered ultraviolet radiation: Theoretical Basis, J. Geo-phys. Res., 103, 17099–17110, 1998.
Torres, O., Bhartia, P. K., Herman, J. R., Sinyuk, A., Ginoux, P., and Holben, B. N.: A long-term record of aerosol optical depth from TOMS observations and comparison to AERONET mea-surements, J. Atmos. Sci., 59(3), 398–413, 2002.
Torres, O., Tansksnen, A., Veihelmann, B., Ahn, C., Braak, R., Bhartia, P. K., Veefkind, P., and Levelt, P.: Aerosols and surface UV products from Ozone Monitoring Instrument
ob-servations: An overview, J. Geophys. Res., 112, D24S47,
doi:10.1029/2007JD008809, 2007.
Wang, J., Xia, X., Wang, P., and Christopher, S. A.: Diurnal vari-ability of dust aerosol optical thickness and Angstrom expo-nent over dust source regions in China, Geophys. Res. Lett., 31, L08107, doi:10.1029/2004GL019580, 2004.
Yu, H., Kaufman, Y. J., Chin, M., Feingold, G., Remer, L. A., Anderson, T. L., Balkanski, Y., Bellouin,N., Boucher, O., Christopher, S., DeCola, P., Kahn, R., Koch, D., Loeb, N., Reddy, M. S., Schulz, M., Takemura, T., and Zhou, M.: A review of measurement-based assessments of theaerosol direct radiative effect and forcing, Atmos. Chem. Phys., 6, 613–666, doi:10.5194/acp-6-613-2006, 2006.
Yu, H., Chin, M., Remer, L. A., Kleidman, R., Bellouin, N., Blan, H., and Diehl, T.: Variability of marine aerosol fine-mode fraction estimates of anthropogenic aerosol component over cloud-free oceans from the Moderate Resolution Imag-ing Spectroradiometer (MODIS), J. Geopys. Res, 114, D10206, doi:10.1029/2008JD010648, 2009.
Zhang, J. and Reid, J. S.: MODIS aerosol product analysis for data assimilation: Assessment of over-ocean level 2 aerosol optical thickness retrievals, J. Geophys. Res., 111, D22207, doi:10.1029/2005JD006898, 2006.