BGD
12, 675–706, 2015Inter- and intra-specific responses of coccolithophores
D. S. Wang et al.
Title Page
Abstract Introduction
Conclusions References
Tables Figures
◭ ◮
◭ ◮
Back Close
Full Screen / Esc
Printer-friendly Version Interactive Discussion
Discussion
P
a
per
|
Discussion
P
a
per
|
Discussion
P
a
per
|
Discussion
P
a
per
|
Biogeosciences Discuss., 12, 675–706, 2015 www.biogeosciences-discuss.net/12/675/2015/ doi:10.5194/bgd-12-675-2015
© Author(s) 2015. CC Attribution 3.0 License.
This discussion paper is/has been under review for the journal Biogeosciences (BG). Please refer to the corresponding final paper in BG if available.
Inter- and intra-specific responses of
coccolithophores to CO
2
-induced ocean
acidification
D. S. Wang1,2,*, D. Xu1,*, X. Fan1, N. H. Ye1, W. Q. Wang2, X. W. Zhang1, Y. Miao1,
Z. Guan3, and S. Wang3
1
Yellow Sea Fisheries Research Institute, Chinese Academy of Fishery Sciences, Qingdao, China
2
Marine Science and Engineering College, Qingdao Agricultural University, Qingdao, China
3
College of Fisheries and Life Science, Shanghai Ocean University, Shanghai, China
*
These authors contributed equally to this manuscript.
Received: 5 November 2014 – Accepted: 1 December 2014 – Published: 13 January 2015
Correspondence to: N. H. Ye ([email protected]) and W. Q. Wang ([email protected])
BGD
12, 675–706, 2015Inter- and intra-specific responses of coccolithophores
D. S. Wang et al.
Title Page
Abstract Introduction
Conclusions References
Tables Figures
◭ ◮
◭ ◮
Back Close
Full Screen / Esc
Printer-friendly Version Interactive Discussion
Discussion
P
a
per
|
Discussion
P
a
per
|
Discussion
P
a
per
|
Discussion
P
a
per
|
Abstract
Oceanic uptake of anthropogenic carbon dioxide (CO2) is altering the seawater
chem-istry of the world’s oceans with consequences for marine bioregions, especially cal-careous organisms such as corals, foraminifera and coccolithophores. The coccolitho-phores, one of the most abundant and widespread groups of calcifying plankton, are 5
responsible for a large proportion of modern oceanic carbonate production. However, culture experiments examining the response of coccolithophores to elevated CO2 par-tial pressure (pCO2) have mostly been based on investigations of a single strain and
have yielded contradictory results from different experiments between and even within species. Here, four strains of the coccolithophoresEmiliania huxleyi (E. huxleyi) and 10
Gephyrocapsa oceanica(G. oceanica), which contained separately naked and calcify-ing strains, were investigated simultaneously for the first time in a bubblcalcify-ing batch culture at four CO2 grades ranging from approximately 380 to 2000 µatm. We synchronously determined multiple physiological parameters of four coccolithophore strains involving growth, photosynthesis, nitrogen uptake, elemental compositions and calcification effi -15
ciency in the process of cultivation. The results did not show a uniform response from different strains to elevatedpCO2up to 2000 µatm, and the naked strainE. huxleyi
(N-E) was seriously suppressed, in sharp contrast to the positive response of the different levels of the other three algae. In addition, we fitted nitrogen uptake rate response curves relative to changing pCO2 for the four strains and applied kinetic constants
20
from the response curves to further analyze the hypostatic difference among different strains, which reflected the same variational trend of the four stains above vs. increas-ing CO2. We determined that the responses of coccolithophores to ocean acidification
are inter- and intra-specific, and this variation may cause changes to biodiversity and other ecosystem processes in the future ocean.
BGD
12, 675–706, 2015Inter- and intra-specific responses of coccolithophores
D. S. Wang et al.
Title Page
Abstract Introduction
Conclusions References
Tables Figures
◭ ◮
◭ ◮
Back Close
Full Screen / Esc
Printer-friendly Version Interactive Discussion
Discussion
P
a
per
|
Discussion
P
a
per
|
Discussion
P
a
per
|
Discussion
P
a
per
|
1 Introduction
Phytoplankton plays a crucial role in the ocean’s food webs and biogeochemical cycles (Falkowski, 2012). Coccolithophores, unicellular haptophyte algae whose cell surface is covered with small intracellularly produced calcite platelets, are currently one of the most abundant and widespread groups of calcifying plankton in the ocean (Langer 5
et al., 2009; Langer, 2013; Lohbeck et al., 2014; Young et al., 2014). Additionally, they are known to participate in the carbonate pump and play a crucial role in the carbon bio-geochemical cycle; coccolithophores are capable of forming great blooms, which are thought to have a feedback effect on global climate change (Hutchins, 2011; Riebesell and Tortell, 2011; Jin et al., 2013; Beaufort et al., 2014). However, ocean acidification 10
generated by the increase in atmosphericpCO2is inducing a decrease in the surface
ocean pH (estimated to decrease by 0.5 and 0.7 units by 2100 and 2300, respectively) (Caldeira and Wickett, 2003; IPCC, 2007; Ross et al., 2011), while simultaneously al-tering the variety of dissolved carbonate (Beaufort et al., 2011). These changes in the surface ocean have massive impacts on coccolithophores and the other calcifying 15
species, which is presumed to affect communities and the overall ecosystem and to damage the marine environment (Turley et al., 2010; Hoppe et al., 2011; Sinutok et al., 2011; Lohbeck et al., 2012; Meier et al., 2014).
Many studies with laboratory cultures and large-scale semi-enclosed field cultures (mesocosms) have intensively studied the response of individual coccolithophores 20
to ocean acidification over the last decade, which has resulted in conflicting reports (Young et al., 2014). As the first widely adopted concept, Riebesell et al. (2000) dicated that there was a clear reduction in calcification of coccolithophores with in-creasingpCO2, simultaneously accompanied by increasing particulate organic carbon
(POC). Subsequent experiments conducted on a single culture strain ofE. huxleyialso 25
BGD
12, 675–706, 2015Inter- and intra-specific responses of coccolithophores
D. S. Wang et al.
Title Page
Abstract Introduction
Conclusions References
Tables Figures
◭ ◮
◭ ◮
Back Close
Full Screen / Esc
Printer-friendly Version Interactive Discussion
Discussion
P
a
per
|
Discussion
P
a
per
|
Discussion
P
a
per
|
Discussion
P
a
per
|
Hoppe et al., 2011). However, many other studies with strains ofE. huxleyicontinued to reveal conflicting results, which showed an increasing (Iglesias-Rodriguez et al., 2008; Shi et al., 2009; Jones et al., 2013) or insensitive calcification rate (Langer et al., 2009; De Bodt et al., 2010; Fiorini et al., 2011a).
In addition, one culture strain of each of the calcifying coccolithophores (G.
ocean-5
ica,Calcidiscus leptoporusandCoccolithus braarudii) studied by previous researchers also expressed a different response pattern. For example, the strainG. oceanicaPC7/1 displayed a comparatively larger decrease in the rate (44.7 %) of calcification (Riebe-sell et al., 2000), while the strainCoccolithus braarudii4762 showed slightly increasing calcification rates (Rickaby et al., 2010), and the strainCalcidiscus leptoporusAC370 10
displayed an insensitive response to elevated pCO2 (Fiorini et al., 2011a). Consid-ering this contradictory result, different strains or species of coccolithophores have been simultaneously tested (Langer et al., 2006, 2009; Fiorini et al., 2011a). Langer et al. (2009) noted that the sensitivity of differentE. huxleyistrains used in every previ-ous study of ocean acidification differed constitutionally, likely because of the existence 15
of a genetic basis to intra-specific responses. However, different calcification or naked strains from different species (as in our research) have not been investigated in previ-ous studies.
With the inconformity in the observed ocean acidification effects on calcification, the accurate prediction of the fate of coccolithophores in an increasingly acidified ocean 20
remains problematic. Additionally, the response of the cosmopolitan dominant species
E. huxleyi to ocean acidification, based on short-term experiments, has been inten-sively studied, and the literature is rapidly expanding. Langer et al. (2006) indicated that a bias may be created for species and clones best adapted to modernpCO2and
that questions on the universal validity of the observed responses may also be raised. 25
simulta-BGD
12, 675–706, 2015Inter- and intra-specific responses of coccolithophores
D. S. Wang et al.
Title Page
Abstract Introduction
Conclusions References
Tables Figures
◭ ◮
◭ ◮
Back Close
Full Screen / Esc
Printer-friendly Version Interactive Discussion
Discussion
P
a
per
|
Discussion
P
a
per
|
Discussion
P
a
per
|
Discussion
P
a
per
|
neously testing a wider range of species, including different strains, and examining the long-term effects of increasingpCO2levels is needed.
In this study, we performed a series of laboratory experiments that represent pro-jections of the future ocean acidification and simultaneously used two cosmopolitan species of coccolithophore,E. huxleyiandG. oceanica, which are naked and calcifying 5
strains, respectively, to examine elevatedpCO2 from 380 to 2000 µatm. Physiological
parameters, such as algal growth, algal photosynthesis parameters, nitrogen assimila-tion, particulate inorganic carbon (PIC) producassimila-tion, particulate organic carbon (POC) production, particulate organic nitrogen (PON) production and the rates between par-ticulate matter, were examined to assess the potential change of each strain of coccol-10
ithophore vs. different CO2 concentrations. In addition, we fitted nitrogen uptake rate response curves relative to changing pCO2 for four strains and applied kinetic
con-stants from the response curves to further analyze the hypostatic difference among the different strains. These results were intended to provide insight into the different effects of ocean acidification on different coccolithophores under similar conditions and were 15
beneficial for assessing future changes in biodiversity and other ecological processes.
2 Materials and methods
2.1 Algal materials and growth conditions
Naked and calcifying cells ofE. huxleyi (strain E. huxleyi, abbreviated N-E; strain E. huxleyi, CS369, abbreviated C-E) and G. oceanica (strain G. oceanica, NIES-1318, 20
abbreviated N-G; strainG. oceanica, abbreviated C-G) were obtained from the Yellow Sea Fisheries Research Institute Microalgae Culture Center. Taxonomic relationships of the four coccolithophore strains are depicted in Fig. S1. The cells were cultured in filtered (0.2 µm) natural seawater enriched with nitrate and phosphate to concentra-tions of 882 and 36.2 µmol L−1
, respectively, and with metals and vitamins according to 25
BGD
12, 675–706, 2015Inter- and intra-specific responses of coccolithophores
D. S. Wang et al.
Title Page
Abstract Introduction
Conclusions References
Tables Figures
◭ ◮
◭ ◮
Back Close
Full Screen / Esc
Printer-friendly Version Interactive Discussion
Discussion
P
a
per
|
Discussion
P
a
per
|
Discussion
P
a
per
|
Discussion
P
a
per
|
a light : dark cycle (16 : 08 h) and saturating light (300 µmol photons m−2s−1) provided by white fluorescent lighting in an incubator. The culturing was conducted in sterilized 2 L Erlenmeyer flasks containing 1 L of medium, and algae in the exponential growth phase were used for inoculation in the experiments.
2.2 Experimental set up
5
We conducted replicate experiments by bubbling cultures of four species of coccolitho-phores using air with different CO2 partial pressures and adopting a flask and tubing system manipulated in plant growth chambers (GXZ, Ruihua, Wuhan, China) simi-lar to Xu et al. (2014). The experiments were prepared with monospecific cultures of the four species of coccolithophore and reached the exponential growth phase under 10
the above-mentioned conditions. Three replicate cultures of 1000 mL of each coccol-ithophore were incubated with aeration of different CO2 partial pressures in a CO2
chamber. All the experiments were generally similar in design. Differences are shown in Table S1, and treatments were bubbled continuously with air containing different par-tial pressures of CO2to provide 380, 750, 1000 and 2000 µatm CO2in the medium. The
15
culture medium typically became stable after 48 h of bubbling and before the start of the experimental inoculation. In each experiment, triplicate flasks for each air-CO2mixture
were maintained without added cells as a blank. The cell density and pH were mon-itored, respectively. Triplicate sampling for culture medium, chlorophyll (Chl) content, PIC, POC, DIC and alkalinity measurements were conducted at the sampling point. 20
2.3 Carbonate chemistry analyses
The corresponding pH of the culture medium was monitored with a pH meter (Orion ROSS, Thermo Electron Corp., Beverly, MA, USA). The samples for total alkalinity (TA) measurements were immediately filtered using a Whatman GF/F and stored in sealed 100 mL borosilicate bottles at−20◦C until measured. The TA value was obtained using 25
BGD
12, 675–706, 2015Inter- and intra-specific responses of coccolithophores
D. S. Wang et al.
Title Page
Abstract Introduction
Conclusions References
Tables Figures
◭ ◮
◭ ◮
Back Close
Full Screen / Esc
Printer-friendly Version Interactive Discussion
Discussion
P
a
per
|
Discussion
P
a
per
|
Discussion
P
a
per
|
Discussion
P
a
per
|
the seawater carbonate system within experiments were calculated using the CO2SYS Package based on the pH, temperature, salinity, and TA according to the method of Pelletier et al. (2007).
2.4 Growth determination
An accurate cell count was obtained to estimate microalgal growth by manual counting 5
with a hemocytometer under an optical microscope (Nikon, Tokyo, Japan). The specific growth rate (µ) was determined as follows:µ=(lnC1−lnC)/(t1−t), whereC andC1
are the cell concentrations at initial timet and subsequent timet1, respectively.
2.5 Chlorophyll fluorescence parameter and pigment analysis
The photosynthetic characteristics of tested coccolithophores were simultaneously de-10
termined using the pulse–amplitude modulated method with a Dual-PAM-100 (Walz, Effeltrich, Germany) connected to a PC running WinControl software. Before mea-surement, the samples were kept in the dark for 15 min, and the original fluorescence (F) was determined under low light. A saturation light pulse was applied to obtain maximum fluorescence (Fm) in the dark-adapted samples. The Fm yield in the illu-15
minated samples was denoted as Fm′, and Ft′ was the real-time fluorescence yield. The maximal PSII quantum yield (Fv/Fm) was calculated according to the following equation: fv/Fm=(Fm−F)/Fm. The effective PSII quantum yield was calculated as follows: Y(II)=(Fm′−Ft′)/Fm′.
To determine the pigment content, the cells were collected onto Whatman GF/F fil-20
BGD
12, 675–706, 2015Inter- and intra-specific responses of coccolithophores
D. S. Wang et al.
Title Page
Abstract Introduction
Conclusions References
Tables Figures
◭ ◮
◭ ◮
Back Close
Full Screen / Esc
Printer-friendly Version Interactive Discussion
Discussion
P
a
per
|
Discussion
P
a
per
|
Discussion
P
a
per
|
Discussion
P
a
per
|
2.6 Determination of nitrogen uptake
Water samples (5 mL) from the experiment were collected and filtered quickly using acetate cellulose filters and then frozen at −80◦C in polyethylene flasks for storage until analysis. Before analysis, stored culture media samples were thawed to room temperature, and nitrate concentrations were analyzed photometrically using an Auto-5
Analyzer (BRAN and LUEBBE AA3, Germany). Nitrogen uptake rates were calculated as follows: NUR=(C−Ct)V/N/t, where NUR is the nitrogen uptake rate (pmol of
ni-trate cell−1day−1);CandCtare the nitrate concentrations (pmol L−1) at the beginning
and on the 7th day of the experiment, respectively;V is the volume of the water (in L);N is the cell number (ind); andt is the time interval (in days). Moreover, we used 10
Michaelis–Menten (Michaelis and Menten, 1913; Hutchins et al., 2013) rectangular hy-perbolic saturation equation curves to fit CO2response curves for the nitrogen uptake
rates in each of the triplicate cultures and for each strain in each pCO2 treatment. The work was completed using OriginPro software, including the calculation of kinetic constants and curve correlation coefficients.
15
2.7 Element analysis of tissue carbon and nitrogen content
The samples for element analysis were taken from each replicate, filtered onto pre-combusted (500◦C for 5 h) Whatman GF/F filters (25 mm) and stored at −20◦C until analysis. Prior to analysis, the POC filters were fumed over HCl for 24 h to remove all inorganic carbon and then dried again. The filters were then packed in solvent-rinsed tin 20
sample boats for analysis. The POC, PON and TPC (total particulate carbon) concen-trations were determined sequentially with a Vario EL III automatic elemental analyzer (Elementar Analysensysteme Co., Germany). The PIC concentration was calculated by the differences between TPC and POC, and the POC, PIC or PON production was calculated as follows:
25
P =specific growth rateµ(d−1
BGD
12, 675–706, 2015Inter- and intra-specific responses of coccolithophores
D. S. Wang et al.
Title Page
Abstract Introduction
Conclusions References
Tables Figures
◭ ◮
◭ ◮
Back Close
Full Screen / Esc
Printer-friendly Version Interactive Discussion
Discussion
P
a
per
|
Discussion
P
a
per
|
Discussion
P
a
per
|
Discussion
P
a
per
|
2.8 Data analysis
All statistical analyses were performed using the SPSS (Statistical Package for the Social Sciences) 17.0 data processing system software, and the mean±SD was cal-culated for each experiment. A one-way ANOVA was used to analyze the significance of variance among treatments. The significance level was set at 0.05 for all tests unless 5
otherwise stated.
3 Results
3.1 Variation of the carbonate system in the experiment
This experiment adopted a gas bubbling method to mimic seawater acidification and monitored the shift in parameters of the seawater-carbonate system, including pH, DIC, 10
HCO−3, CO23−, and CO2, under different treatments. Figure S2 and Table S1 in the
Supplement present the changes of seawater pH when culturing different isolates vs. different CO2 concentrations. The initial pH values corresponding to elevated pCO2
values of 380, 750, 1000 and 2000 µatm were 8.06±0.02, 7.79±0.01, 7.65±0.02 and 7.48±0.02, respectively. The experimental conditions set in this study were not exactly 15
the same as those expected in ocean acidification because seawater contains buffers to induce changes in alkalinity. Some measurements required a large biomass; there-fore, cell density was also very high, leading to a variation in the carbonate system. Moreover, although these shifts existed, a clear difference in pH among the four gra-dient cultures was maintained throughout the experiment. Therefore, the results are 20
strongly supported and have significant implications.
3.2 Effect of seawater acidification on the growth of coccolithophores
The effect of different pCO2 on the growth of four coccolithophores in plant growth
BGD
12, 675–706, 2015Inter- and intra-specific responses of coccolithophores
D. S. Wang et al.
Title Page
Abstract Introduction
Conclusions References
Tables Figures
◭ ◮
◭ ◮
Back Close
Full Screen / Esc
Printer-friendly Version Interactive Discussion
Discussion
P
a
per
|
Discussion
P
a
per
|
Discussion
P
a
per
|
Discussion
P
a
per
|
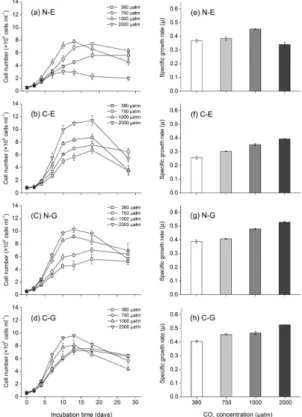
gradually over time to a maximum, with a subsequent decline at the end of the experi-ment, and there was significant effect ofpCO2on cell concentration for every species.
The C-E, N-E and N-G showed a positive response to gradually increased CO2
con-centration, while the cell concentration of the N-E was suppressed aspCO2 reached 2000 µatm. Algal cells grew exponentially in all treatments during the first 7 days, and 5
the specific growth rate is presented in Fig. 1e–h. Increasing thepCO2 by 2000 µatm
increases the specific growth rate by approximately 53 % (the C-E), 36 % (the N-G) and 30 % (the C-G), respectively. However, when the bubbling CO2concentration reached
1000 µatm, the specific growth rate increased by approximately 26 % for the N-E; with a continuous rise to 2000 µatm, the ocean acidification decreased the specific growth 10
rate of the N-E by 14 % compared to the control. Moreover, when a comparison was conducted between or within species, the variability ofE. huxleyi(naked strain to cal-cifying strain: reducing by 14 % to increasing by 53 %) exceeded that of the species
G. oceanica(naked strain to calcifying strain: increasing by 36 and 30 %, respectively) under different CO2concentrations.
15
3.3 Effect of ocean acidification on the photosynthetic activity of
coccolithophores
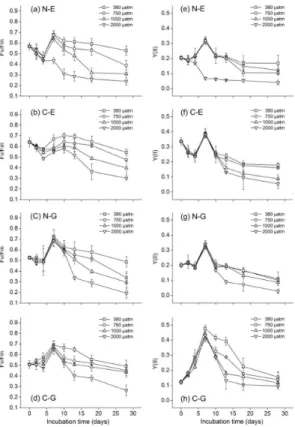
Figure 2 shows the effects of ocean acidification by increasingpCO2 on the changes in the photosystem activity parameters, including Fv/Fm and Y(II), during the culture of coccolithophores. Both Fv/Fm and Y(II) in all treatments showed a negative in-20
fluence from increasing pCO2 by 2000 µatm, but the magnitude was different among the four species. With incubation time, every photosystem activity parameter of the four coccolithophores simultaneously reached a maximum value on the 7th day, before a subsequent decline till the end of experiment, except for the parameter Fv/Fm of C-E (on the 10th day) and the N-C-E (continuous decline) for the 2000 µatm sample point. 25
AspCO2increased by 2000 µatm in plant growth chambers, significant suppression of
BGD
12, 675–706, 2015Inter- and intra-specific responses of coccolithophores
D. S. Wang et al.
Title Page
Abstract Introduction
Conclusions References
Tables Figures
◭ ◮
◭ ◮
Back Close
Full Screen / Esc
Printer-friendly Version Interactive Discussion
Discussion
P
a
per
|
Discussion
P
a
per
|
Discussion
P
a
per
|
Discussion
P
a
per
|
10th day, respectively. At the end of experiment, the Fv/Fm was repressed by elevated
pCO2 (2000 µatm) and decreased by 60, 45, 55, and 46 % and Y(II) also declined by
75, 69, 76, and 39 %, respectively, compared to the control. In addition, by comparison to the maximal Y(II) of N-E and N-G (under 380 µatm; 0.32±1.9 % and 0.34±2.6 %, respectively), the maximal Y(II) of the C-E and C-G (under 380 µatm; 0.39±3.1 % and 5
0.48±2.3 %, respectively) were significantly higher, while differences in Fv/Fm were not obvious among them.
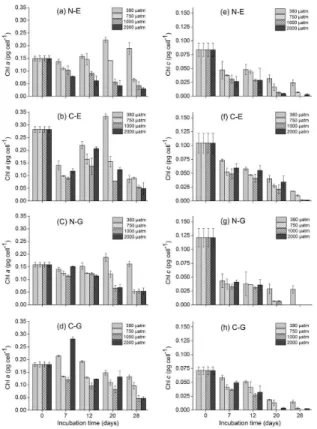
Figure 3 presents the effects of elevated CO2 conditions from 380 to 2000 µatm on
the intracellular chlorophyll content of different strains. After an initial value showing slight variation, the chlorophyll a content of cells increased to maximum values on 10
the 20th (N-E, C-E, N-G) and 7th day (C-G), with a subsequent declining tendency until the final experiment (Fig. 3a–d). However, chlorophyllcdisplayedasteady overall decline over time (Fig. 3e–f). However, as the CO2 concentration increased from 380 to 1000 µatm, the chlorophyll content of every coccolithophore decreased in an orderly pattern (except for individual points in time that were presented differently) compared to 15
380 µatm at each sampling time. Nevertheless, the results determined under 2000 µatm conditions did not exhibit the same responses. During the 2000 µatm CO2enrichment,
the chlorophyll a and c content of the N-E with respect to cultivation time presented lower values than the 1000 µatm CO2 concentration at each sampling point. However, for the C-E, N-G and C-G strains, as the CO2 concentration in the culture increased
20
above 1000 µatm, the chlorophyll content tended to increase at each sampling point.
3.4 Effect of ocean acidification on the nitrogen uptake rate of
coccolithophores
The effect of ocean acidification on the nitrogen uptake rate of the four coccolithophores is displayed in Fig. 5. With increasing CO2concentration from 380 to 2000 µatm, the
ni-25
More-BGD
12, 675–706, 2015Inter- and intra-specific responses of coccolithophores
D. S. Wang et al.
Title Page
Abstract Introduction
Conclusions References
Tables Figures
◭ ◮
◭ ◮
Back Close
Full Screen / Esc
Printer-friendly Version Interactive Discussion
Discussion
P
a
per
|
Discussion
P
a
per
|
Discussion
P
a
per
|
Discussion
P
a
per
|
over, the response of nitrogen uptake rates to increasingpCO2in all the strains were closely described by a Michaelis–Menten curve fitting approach, and both half satu-ration constants (Km, µatm CO2) and maximum CO2-saturated rates (Vmax, pmol N
cell−1 day−1) were obtained from the response curves. The maximum Km and Vmax value were 307.2 µatm and 24.1 pmol N cell−1 day−1 from strain N-E, respectively,
5
which were approximately 1.7-fold and 1.3-fold larger than the minimum values pre-sented by strain C-E, respectively.
3.5 Effect of ocean acidification on element composition and the calcification
rate of coccolithophores
Figure 5 shows the production of POC and PON of the four species of coccolithophore 10
on the 7th day in elevated pCO2 conditions. Acidification by CO2 enrichment up to
2000 µatm distinctly stimulated the production of POC and PON of coccolithophores except for N-E , whose increasing POC production under 1000 µatmpCO2 conditions
exhibited a significant decline at the 2000 µatm sample point, and the variations were enormous. For the C-E, N-G and C-G species, the POC production increased by ap-15
proximately 101, 35 and 49 %, respectively, compared with the control, and the varia-tion of the former reached 2.9 and 2.1-fold of the N-G and C-G, respectively. Moreover, over this range, PON production had a comparatively larger increase of 233 % (N-E), 289 % (C-E), 148 % (N-G) and 129 % (C-G) than controls. However, the changes of particle carbon and nitrogen production led to a decrease in the POC : PON for the four 20
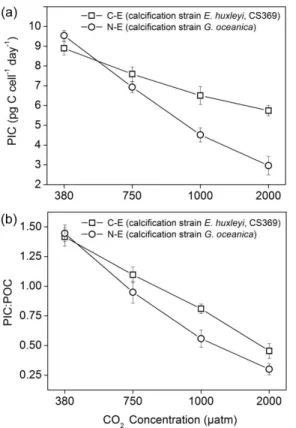
species by 76.6 % (N-E), 48.3 % (C-E), 45.7 % (N-G) and 34.9 % (C-G), with thepCO2 variation between 380 and 2000 µatm. In addition, the seawater acidification under 2000 µatm also had a negative effect on PIC production, which decreased by 35.4 and 68.9 % for two calcification species, C-E and C-G, respectively, in comparison with the production value at 380 µatm (Fig. 6). The C-G species presented a higher reduction 25
ratio (approximately 1.9-fold) of PIC than the C-E when CO2 concentrations increased
BGD
12, 675–706, 2015Inter- and intra-specific responses of coccolithophores
D. S. Wang et al.
Title Page
Abstract Introduction
Conclusions References
Tables Figures
◭ ◮
◭ ◮
Back Close
Full Screen / Esc
Printer-friendly Version Interactive Discussion
Discussion
P
a
per
|
Discussion
P
a
per
|
Discussion
P
a
per
|
Discussion
P
a
per
|
4 Discussion
In this study, two species of the coccolithophores were used in the first experiment involving naked and calcifying strains, and their responses to elevated CO2
concentra-tion were investigated. Simultaneously, kinetic constants from the fitted CO2response curves regarding the nitrogen uptake rate were also applied to analyze and display the 5
inherited variation of different coccolithophores. The N-E was seriously suppressed in comparison with the different levels of the positive response the other three strains when thepCO2 was elevated to 2000 µatm. We concluded that the sensitivity of
coc-colithophores to ocean acidification was strain- and species-specific, which may po-tentially affect future species distributions and abundances. We also speculated that 10
ocean acidification may result in changes to biodiversity, trophic interactions, and other ecosystem processes in the future ocean.
4.1 Effect of the ocean acidification on the growth and photosynthetic
perfor-mance of different strains of coccolithophores
This study showed that a high CO2concentration (increasing to 2000 µatm) led to an
in-15
crease in growth, except for N-E, whose growth declined at the 2000 µatm sample point and whose specific growth rates were significantly reduced by approximately 7.61 % on the 7th day in comparison to the control (Fig. 1). However, beforepCO2was elevated to
1000 µatm, the growth of N-E maintained an increasing state (Fig. 1a and e). Recently, Fiorini et al. (2011a) displayed similar results and showed an increasing growth trend 20
of coccolithophores in CO2-rich water up to approximately 750 µatm.
Previous studies suggested that coccolithophores were carbon limited because of a comparatively less-efficient CO2concentrating mechanism (CCM) caused by low ac-tivity for extracellular carbonic anhydrase in the present ocean (Herfort et al., 2002; Trimborn et al., 2007; Rokitta and Rost, 2012; Jin et al., 2013). Therefore, an increase 25
coccol-BGD
12, 675–706, 2015Inter- and intra-specific responses of coccolithophores
D. S. Wang et al.
Title Page
Abstract Introduction
Conclusions References
Tables Figures
◭ ◮
◭ ◮
Back Close
Full Screen / Esc
Printer-friendly Version Interactive Discussion
Discussion
P
a
per
|
Discussion
P
a
per
|
Discussion
P
a
per
|
Discussion
P
a
per
|
ithophore carboxylation and growth (along with an increase in POC) (Barcelose Ramos et al., 2010; Reinfelder, 2011; Jin et al., 2013; Kottmeier et al., 2014). In this study, we observed the increased growth of four strains including N-E (1000 µatm; 23 %), C-E (2000 µatm; 53 %), N-G (2000 µatm; 36 %) and C-G (2000 µatm; 30 %) (Fig. 1). How-ever, every strain revealed different response capacities and strategies to the increas-5
ingpCO2. In addition, N-E was also significantly and negatively affected, which tended
to lead to bleaching as thepCO2value reached 2000 µatm (Fig. 1).
Recent studies reported that changes in extracellular pH could affect the activity of sensitive algal cells by upsetting the constant membrane potential balance and physio-logical parameters (Langer et al., 2006; Taylor et al., 2011; Rokitta et al., 2012). Hence, 10
the more sensitive alga N-E, relative to the other three stains, showed a negative re-sponse because of the overstepping of its tolerance ability and declined pH (7.48, 2000 µatm, Table S1). Because coccolithophores are an abundant formal species, which have been characterized with a unique physiology and morphology (Westbroek et al., 1993; Winter and Siesser, 1994; Raven and Crawfurd, 2012), we propose that 15
the observed differences in the response of coccolithophores to increasingpCO2have
a genetic basis. Recently, Read et al. (2013) reported the first haptophyte reference genome (fromE. huxleyiCCMP1516) and assumed that genome variability within this species complex seems to underpin its capacity to thrive in different habitats. The in-herent difference in adaptive capacity from coccolithophores would contribute to an 20
inherent discrepancy reaction in response to ocean acidification, similar to the specific response results in this study.
However, algal photosynthesis (which is closely related to growth) that is evaluated by the activities of the photosystems and pigment content exerted a variable negative response with elevatedpCO2, especially for N-E, which tended to bleach early in the
25
experiment (Figs. 2 and 3). These results involving the activities of the photosystems revealed that cells remained “photosynthetically unhealthy” due to the effect on cell ion balance from declining pH (elevatedpCO2) (Langer et al., 2006), which induced a
com-BGD
12, 675–706, 2015Inter- and intra-specific responses of coccolithophores
D. S. Wang et al.
Title Page
Abstract Introduction
Conclusions References
Tables Figures
◭ ◮
◭ ◮
Back Close
Full Screen / Esc
Printer-friendly Version Interactive Discussion
Discussion
P
a
per
|
Discussion
P
a
per
|
Discussion
P
a
per
|
Discussion
P
a
per
|
parison to the other coccolithophores when ocean acidification reached the 2000 µatm sample point, which showed exceeding maladjustment (Figs. 2a and 3a). Similar to the different responses in growth results with elevatedpCO2, algal photosynthesis also
reflected an inherent difference in its reaction. For the whole ecosystem, for which a slight change in one part may affect the whole situation, the specific reaction of coc-5
colithophores to ocean acidification would likely affect biodiversity and other ecological process (Orr et al., 2005; Hendriks et al., 2010).
4.2 Effect of ocean acidification on the nitrogen uptake rate of different strains
of coccolithophores
Considering the effect of ocean acidification on nutrient uptake, we tested the nitro-10
gen uptake efficiency of each strain under different pCO2 levels and fitted nitrogen uptake rate response curves to changingpCO2for further analysis at the 7th day
sam-pling point. The results showed that the nitrogen uptake rate of all strains increased at the 2000 µatm CO2concentration (Fig. 4). The naked strains N-E and N-G exhibited a greater increase of 48.2 and 41.6 % (Fig. 4a and c), respectively, while the nitrogen 15
uptake rate increased by 33.9 and 34.3 % in the calcifying strain C-E and C-G, re-spectively (Fig. 4b and d). Jin et al. (2013) reported that inorganic nitrogen uptake was enhanced in coccolithophores and that the gene for nitrate reductase in a diatom was upregulated under elevated CO2 levels. In addition, disparities between strains also
existed. 20
Previous studies suggested that coccolithophore cells exerted a process of energy redistribution under ocean acidification conditions (Raven, 2011; Beaufort et al., 2011), resulting in the release of extra ATP to preferentially support additional N uptake for the synthesis of more proteins (Jin et al., 2013). However, calcifying cells, which need more energy input for H+ from calcification, because there is an outward transport to acidic 25
ele-BGD
12, 675–706, 2015Inter- and intra-specific responses of coccolithophores
D. S. Wang et al.
Title Page
Abstract Introduction
Conclusions References
Tables Figures
◭ ◮
◭ ◮
Back Close
Full Screen / Esc
Printer-friendly Version Interactive Discussion
Discussion
P
a
per
|
Discussion
P
a
per
|
Discussion
P
a
per
|
Discussion
P
a
per
|
vatedpCO2determined in this study also indirectly confirmed the energy redistribution preference for nitrogen uptake (Fig. 5b).
The response curves of nitrogen uptake efficiency to changingpCO2confirmed the
influencing behavior of CO2for each of these coccolithophores. Kinetic rate constants (Km value), which were derived from curves, represented the enzyme affinity to the 5
substrate, and when the Km value increased, the affinity became smaller (Michaelis and Menten, 1913). Recently, Hutchins et al. (2013) documented strain-specific dif-ferences in the relationship between nitrogen fixation and CO2concentration through
different kinetic constant analysis. In this study, N-E showed the maximum Km value, namely, the minimum affinity, compared with other three strains (differences also ex-10
isted among them) (Fig. 4). This result reflected the same trend with the other paramet-ric measurements, such as growth rate, photosynthetic activity, etc., which indicated that N-E was seriously affected by elevated CO2 concentrations, and inter- and
intra-specific responses were also displayed. In addition, the principal coordinate analysis (PCoA) and hierarchical clustering multi-variate statistical analyses for the replicates 15
of each of the four coccolithophore strains displayed obvious differences in CO2
re-sponses (Fig. S3). Replicates of each of the four strains formed well-defined clusters through PCoA (Fig. S3a). Moreover, independent hierarchical clustering of each repli-cate also showed the same serious groups, and this analysis revealed that the two calcifying strains were more similar to one another than they were to the two naked 20
strains (Fig. S3b). These data analyses further highlighted the inter- and intra-specific variability in coccolithophore response to CO2-induced acidification.
4.3 Effect of ocean acidification on the elemental composition of different
strains of coccolithophores
Variations in the elemental stoichiometry of phytoplankton are known to have an effect 25
BGD
12, 675–706, 2015Inter- and intra-specific responses of coccolithophores
D. S. Wang et al.
Title Page
Abstract Introduction
Conclusions References
Tables Figures
◭ ◮
◭ ◮
Back Close
Full Screen / Esc
Printer-friendly Version Interactive Discussion
Discussion
P
a
per
|
Discussion
P
a
per
|
Discussion
P
a
per
|
Discussion
P
a
per
|
we measured the ratios of C : N to assess whether the elemental composition of the or-ganic material was additionally affected by changingpCO2, and we also explored the
extent of the impact. According to the results, changes in the elemental composition of coccolithophores grown at 2000 µatmpCO2 have been found (N-E, C-E, N-G and C-G), revealing a reduced C : N ratio (by approximately 76, 48, 45 and 35 %, respec-5
tively) (Fig. 5c). The ratio of N-E was affected greatly with respect to the other three isolates, and C-G was the least affected. In previous studies, similar variable ratios for coccolithophores based on an enhanced CO2concentration were reported by
Fior-ini et al. (2011a, b) and Rickaby et al. (2010). These changes occurred with increasing POC (except for N-E at 2000 µatm of CO2) and PON production and under risingpCO2 10
concentration between 380 and 2000 µatm (Fig. 5).
It was also discovered that the incremental ratios of PON were higher than those of POC compared to the control groups with the ultimate proportion. We have dis-cussed in the above section that the redistribution of energy resulted in more nitrogen absorption and increasing PON production with elevatedpCO2. This preference
advan-15
tage made the PON production exceed the POC production, even though differences existed in different strains, leading to different decreasing C : N ratios (Fig. 4c). Simi-lar to previous research by Riebesell and Tortell (2011), the changes with which high
pCO2 levels were associated with C : N ratios were highly species specific.
Addition-ally, a variable proportion was also the embodiment of the inherited differences among 20
different strains. In contrast, differences from current findings also exist, which show increased cellular C : N ratios with elevated pCO2 (Feng et al., 2008; De Bodt et al.,
2010; Kottmeier et al., 2014).
The reasons for the opposite result may be a difference between the experimen-tal settings, such as temperature, illumination intensity, and/or choice of algae strains. 25
BGD
12, 675–706, 2015Inter- and intra-specific responses of coccolithophores
D. S. Wang et al.
Title Page
Abstract Introduction
Conclusions References
Tables Figures
◭ ◮
◭ ◮
Back Close
Full Screen / Esc
Printer-friendly Version Interactive Discussion
Discussion
P
a
per
|
Discussion
P
a
per
|
Discussion
P
a
per
|
Discussion
P
a
per
|
indicated that the increasedpCO2affected algal C : N ratios and produced a diversity of effects on different coccolithophores. In addition, it will further influence grazing-selection pressure on phytoplankton and has many biogeochemical consequences (in particular implications for the export flux of carbon) (Iglesias-Rodriguez et al., 2008).
4.4 Effect of the ocean acidification on the calcification efficiency of different
5
strains of coccolithophores
In the past few years, PIC production (calcification efficiency) has been widely investi-gated in coccolithophores to predict the impact of ocean acidification, and results show that the predominant response was a decreased rate of calcification when cells were grown at CO2levels higher than those found today (380 µatm) or at least a decrease in
10
PIC : POC (e.g., Zon-dervan et al., 2001; Langer et al., 2006; Muller et al., 2010; Hoppe et al., 2011). In this research, the response regarding PIC was in agreement with the response already described in the above-mentioned tendency. Namely, calcification species E. huxleyi and G. oceanica experienced a comparatively larger decrease in the rate of calcification of 35.4 and 68.9 %, respectively, between 380 and 2000 µatm 15
at the 7th day sampling point (Fig. 6). In comparison,G. oceanicawas more vulnerable thanE. huxleyiunder ocean acidification, leading to an unbalanced ecological factor. However, regarding lost calcification species in the experiment, the PIC production was nearly negligible because of the lost calcification ability to cover shells (not show).
Recent studies with various organisms showed calcification to be largely controlled 20
byΩ-cal rather than by pH alone (Langer et al., 2006; Trimborn, 2007), andΩ-cal was controlled by both [DIC] and pH (Iglesias-Rodriguez et al., 2008). When supersaturated surface seawater (i.e., Ω>1) of calcium carbonate minerals (which was considered generally less than current ocean conditions, Feely et al., 2009) declined in saturation (Ω =1) because of ocean acidification or other natural processes, carbonate biominer-25
BGD
12, 675–706, 2015Inter- and intra-specific responses of coccolithophores
D. S. Wang et al.
Title Page
Abstract Introduction
Conclusions References
Tables Figures
◭ ◮
◭ ◮
Back Close
Full Screen / Esc
Printer-friendly Version Interactive Discussion
Discussion
P
a
per
|
Discussion
P
a
per
|
Discussion
P
a
per
|
Discussion
P
a
per
|
which dissolution occurs. Nevertheless, the results clearly revealed that PIC produc-tion (calcificaproduc-tion efficiency) finally had declined in comparison with the control group (Fig. 6).
From the results reported by Langer et al. (2009), the same phenomenon was also observed whenΩ-cal was above 1, and dissolution still occurred. To explain this phe-5
nomenon, we found that the pH values of the cultures incubated at 380 and 2000 µatm of CO2ranged between 8.81 and 7.62 on the 7th day (Table S1 and Fig. S2), and a shift in pH was caused by comparing blanks with cell physiology. These changes affected the photosynthetic health of cells, as discussed above, which implies that our pH con-ditions were not completely within the tolerance levels of cells. Bach et al. (2011) sug-10
gested that calcification is specifically responsive to the associated decrease in pH. Un-der elevatedpCO2circumstances, coccolithophore calcification, which is a stringently
controlled biological process (Mackinder et al., 2010), would be affected by a decreas-ing pH level.
Recently, substantial physiological and molecular evidence has indicated that when 15
HCO−3 is used for calcification (which produces H+ and also maintains a cytosolic pH homeostasis near neutrality), the H+ must be removed across the plasmalemma H+ channel (Suffrian et al., 2011; Taylor et al., 2011) or neutralized in coccolithophores cells (Fabry et al., 2008; Rokitta and Rost, 2012; Stojkovic et al., 2013). To maintain the appropriate transplasmalemma electrical potential difference and the H+efflux, energy 20
input is needed in the process of H+ transport (Raven, 2011). When elevatedpCO2 resulted in a low pH and/or [CO23−] level in waters, this input was likely greater per unit calcification and led to decreased calcification rates (Raven et al., 2011; Beaufort et al., 2011). Based on research of the adverse impact caused by increasing pCO2 on coccolithophore calcification, which was associated closely with biogeochemical 25
BGD
12, 675–706, 2015Inter- and intra-specific responses of coccolithophores
D. S. Wang et al.
Title Page
Abstract Introduction
Conclusions References
Tables Figures
◭ ◮
◭ ◮
Back Close
Full Screen / Esc
Printer-friendly Version Interactive Discussion
Discussion
P
a
per
|
Discussion
P
a
per
|
Discussion
P
a
per
|
Discussion
P
a
per
|
Through our research, different coccolithophores revealed synthetically inter- and intra-specific variability to cope with the threat from ocean acidification and showed a significantly different response derived from inherent heredity. With the CO2
concen-tration gradual increasing, the original state maintained steadily by different coccoli-thophores would be changed on different levels. Thereby, potential changes in species 5
distributions and abundances could propagate through multiple trophic levels of marine food webs. Although research into the long-term ecosystem impacts of ocean acidifica-tion is in its infancy, these results may indicate possible changes in biodiversity, trophic interactions, biogeochemical cycles, and other ecosystem processes.
The Supplement related to this article is available online at
10
doi:10.5194/bgd-12-675-2015-supplement.
Acknowledgements. This work was supported by National Natural Science Foundation of China (41306179), Special Scientific Research Funds for Central Nonprofit Institutes, Yellow Sea Fisheries Research Institutes (20603022012004), a project from Science and Technology Commission of Qingdao Shinan District (2012-5-008-SW), Shandong Key Laboratory of
Ma-15
rine Ecological Restoration, Shandong Marine Fisheries Research Institute Grant (201213), Shandong Science and Technology plan project (2011GHY11528), the Hi-Tech Research and Development Program (863) of China (2012AA052103), National Natural Science Foundation of China (41176153,31200187), and Qingdao Municipal Science and Technology plan project (12-6-1-3-hy).
20
References
BGD
12, 675–706, 2015Inter- and intra-specific responses of coccolithophores
D. S. Wang et al.
Title Page
Abstract Introduction
Conclusions References
Tables Figures
◭ ◮
◭ ◮
Back Close
Full Screen / Esc
Printer-friendly Version Interactive Discussion
Discussion
P
a
per
|
Discussion
P
a
per
|
Discussion
P
a
per
|
Discussion
P
a
per
|
Bach, L. T., Riebesell, U., and Schulz, K. G.: Distinguishing between the effects of ocean acidi-fication and ocean carbonation in the coccolithophoreEmiliania huxleiy, Limnol. Oceanogr., 56, 2040–2050, 2011.
Barcelos e Ramos, J., Müller, M. N., and Riebesell, U.: Short-term response of the coccol-ithophoreEmiliania huxleyito an abrupt change in seawater carbon dioxide concentrations,
5
Biogeosciences, 7, 177–186, doi:10.5194/bg-7-177-2010, 2010.
Beaufort, L., Probert, I., de Garidel-Thoron, T., Bendif, E. M., Ruiz-Pino, D., Metzl, N., Goyet, C., Buchet, N., Coupel, P., Grelaud, M., Rost, B., Rickaby, R. E. M., and de Vargas, C.: Sensitivity of coccolithophores to carbonate chemistry and ocean acidification, Nature, 476, 80–83, 2011.
10
Beaufort, L., Barbarin, N., and Gally, Y.: Optical measurements to determine the thickness of calcite crystals and the mass of thin carbonate particles such as coccoliths, Nat. Protoc., 9, 633–642, 2014.
Caldeira, K. and Wickett, M. E.: Oceanography: anthropogenic carbon and ocean pH, Nature, 425, 365–365, 2003.
15
De Bodt, C., Van Oostende, N., Harlay, J., Sabbe, K., and Chou, L.: Individual and interacting effects ofpCO2and temperature onEmiliania huxleyicalcification: study of the calcite pro-duction, the coccolith morphology and the coccosphere size, Biogeosciences, 7, 1401–1412, doi:10.5194/bg-7-1401-2010, 2010.
Delille, B., Harlay, J., Zondervan, I., Jacquet, S., Chou, L., Wollast, R., and Gattuso, J. P.:
20
Response of primary production and calcification to changes of pCO2 during experimen-tal blooms of the coccolithophoridEmiliania huxleiy, Global Biogeochem. Cy., 19, GB2023, doi:10.1029/2004GB002318, 2005.
Fabry, V. J., Seibel, B. A., Feely, R. A., and Orr, J. C.: Impacts of ocean acidification on marine fauna and ecosystem processes, J. Conseil, 65, 414–432, 2008.
25
Falkowski, P.: Ocean science: the power of plankton, Nature, 483, 17–20, 2012.
Feely, R. A., Doney, S. C., and Cooley, S. R.: Ocean acidification: present conditions and future changes in a high-CO2world, Oceanography, 22, 36–47, 2009.
Feely, R. A., Alin, S. R., Newton, J., Sabine, C. L., Warner, M., Devol, A., Krembs, C., and Maloy, C.: The combined effects of ocean acidification, mixing, and respiration on pH and carbonate
30
BGD
12, 675–706, 2015Inter- and intra-specific responses of coccolithophores
D. S. Wang et al.
Title Page
Abstract Introduction
Conclusions References
Tables Figures
◭ ◮
◭ ◮
Back Close
Full Screen / Esc
Printer-friendly Version Interactive Discussion
Discussion
P
a
per
|
Discussion
P
a
per
|
Discussion
P
a
per
|
Discussion
P
a
per
|
Feng, Y., Warner, M. E., Zhang, Y., Sun, J., Fu, F.-X., Rose, J. M., and Hutchins, D. A. Inter-active effects of increasedpCO2, temperature and irradiance on the marine coccolithophore Emiliania huxleiy(Prymnesiophyceae), Eur. J. Phycol., 43, 87–98, 2008.
Fiorini, S., Middelburg, J. J., and Gattuso, J. P.: Testing the effects of elevated pCO2 on coc-colithophores (prymnesiophyceae): comparison between haploid and diploid life stages, J.
5
Phycol., 47, 1281–1291, 2011a.
Fiorini, S., Middelburg, J. J., and Gattuso, J. P.: Effects of elevated CO2 partial pressure and temperature on the coccolithophoreSyracosphaera pulchra, Aquat. Microb. Ecol., 64, 221– 232, 2011b.
Hendriks, I. E., Duarte, C. M., and Álvarez, M.: Vulnerability of marine biodiversity to ocean
10
acidification: a meta-analysis, Estuar. Coast Shelf S., 86, 157–164, 2010.
Herfort, L., Thake, B., and Roberts, J.: Acquisition and use of bicarbonate byEmiliania huxleiy, New Phytol., 156, 427–436, 2002.
Hoppe, C. J. M., Langer, G., and Rost, B.:Emiliania huxleiyshows identical responses to ele-vatedpCO2in TA and DIC manipulation, J. Exp. Mar. Biol. Ecol., 406, 54–62, 2011.
15
Hutchins, D. A.: Oceanography: forecasting the rain ratio, Nature, 476, 41–42, 2011.
Hutchins, D. A., Mulholland, M. R., and Fu, F.: Nutrient cycles and marine microbes in a CO2 -enriched ocean, Oceanography, 22, 128–145, 2009.
Hutchins, D. A., Fu, F. X., Webb, E. A., Walworth, N., and Tagliabue, A.: Taxon-specific response of marine nitrogen fixers to elevated carbon dioxide concentrations, Nat. Geosci., 6, 790–795,
20
2013.
Iglesias-Rodriguez, M. D., Halloran, P. R., Rickaby, R. E. M., Hall, I. R., Colmenero-Hidalgo, E., Gittins, J. R., Green, D. R. H., Tyrrell, T., Gibbs, S. J., Dassow, P. V., Rehm, E., Armbrust, E. V., and Boessenkool, K. P.: : Phytoplankton calcification in a high-CO2world, Science, 320, 336–340, 2008.
25
Intergovernmental Panel on Climate Change (IPCC): Summary for policy makers, in: Climate Change 2007, the Physical Sciences Basis, Working Group I Contribution to the Fourth As-sessment Report of the IPCC, edited by: Solomon, S. et al., Cambridge University Press, Cambridge, 1–996, 2007.
Jeffrey, S. W. and Humphrey, G. F.: New spectrophotometric equations for determining
chloro-30
BGD
12, 675–706, 2015Inter- and intra-specific responses of coccolithophores
D. S. Wang et al.
Title Page
Abstract Introduction
Conclusions References
Tables Figures
◭ ◮
◭ ◮
Back Close
Full Screen / Esc
Printer-friendly Version Interactive Discussion
Discussion
P
a
per
|
Discussion
P
a
per
|
Discussion
P
a
per
|
Discussion
P
a
per
|
Jin, P., Gao, K., and Beardall, J.: Evolutionary responses of a coccolithophoridGephyrocapsa oceanicato ocean acidification, Evolution, 67, 1869–1878, 2013.
Jones, B. M., Iglesias-Rodríguez, M. D., Skipp, P. J., Edwards, R. J., Greaves, M. J., Young, J. R., Elderfield, H., and O’Connor, C. D.: : Responses of theEmiliania huxleiyproteome to ocean acidification, PLoS One, 8, 1–13, 2013.
5
Kottmeier, D. M., Rokitta, S. D., Tortell, P. D., and Rost, B.: Strong shift from HCO−
3 to CO2
up-take inEmiliania huxleiywith acidification: new approach unravels acclimation versus short-term pH effects, Photosynth Res., 121, 1–11, 2014.
Langer, G.: Palaeontology: plankton in a greenhouse world, Nat. Geosci., 6, 164–165, 2013. Langer, G., Geisen, M., Baumann, K. H., Klas, J., Riebesell, U., Thoms, S., Young, J. R.:
10
Species-specific responses of calcifying algae to changing seawater carbonate chemistry, Geochem. Geophy. Geosy., 7, Q09006, doi:10.1029/2005GC001227, 2006.
Langer, G., Nehrke, G., Probert, I., Ly, J., and Ziveri, P.: Strain-specific responses of Emil-iania huxleyi to changing seawater carbonate chemistry, Biogeosciences, 6, 2637–2646, doi:10.5194/bg-6-2637-2009, 2009.
15
Lohbeck, K. T., Riebesell, U., and Reusch, T. B. H.: Adaptive evolution of a key phytoplankton species to ocean acidification, Nat. Geosci., 5, 346–351, 2012.
Lohbeck, K. T., Riebesell, U., and Reusch, T. B. H.: Gene expression changes in the coccol-ithophoreEmiliania huxleiyafter 500 generations of selection to ocean acidification, P. Roy. Soc. Lond B. Bio., 281, 20140003, doi:10.1098/rspb.2014.0003, 2014.
20
Mackinder, L., Wheeler, G., Schroeder, D., Riebesell, U., and Brownlee, C.: Molecular mecha-nisms underlying calcification in coccolithophores, Geomicrobiol. J., 27, 585–595, 2010. Meier, K. J. S., Beaufort, L., Heussner, S., and Ziveri, P.: The role of ocean acidification in
Emiliania huxleyicoccolith thinning in the Mediterranean Sea, Biogeosciences, 11, 2857– 2869, doi:10.5194/bg-11-2857-2014, 2014.
25
Michaelis, L. and Menten, M. L.: Die Kinetik der Invertinwirkung, Biochem. Z., 49, 333–369, 1913.
Müller, M. N., Schulz, K. G., and Riebesell, U.: Effects of long-term high CO2exposure on two species of coccolithophores, Biogeosciences, 7, 1109–1116, doi:10.5194/bg-7-1109-2010, 2010.
30
BGD
12, 675–706, 2015Inter- and intra-specific responses of coccolithophores
D. S. Wang et al.
Title Page
Abstract Introduction
Conclusions References
Tables Figures
◭ ◮
◭ ◮
Back Close
Full Screen / Esc
Printer-friendly Version Interactive Discussion
Discussion
P
a
per
|
Discussion
P
a
per
|
Discussion
P
a
per
|
Discussion
P
a
per
|
L., Schlitzer, R., Slater, R. D., Totterdell, I. J., Weirig, M. F., Yamanaka, Y., and Yool, A. : Anthropogenic ocean acidification over the twenty-first century and its impact on calcifying organisms, Nature, 437, 681–686, 2005.
Pelletier, G., Lewis, E., Wallace, D.: CO2Sys.xls: A Calculator for the CO2System in Seawater for Microsoft Excel/VB A, Washington State Department of Ecology/Brookhaven National
5
Laboratory, Olympia, WA/Upton, NY, USA, 2007.
Raven, J. A.: Effects on marine algae of changed seawater chemistry with increasing atmo-spheric CO2, Biol. Environ., 11, 1–17, 2011.
Raven, J. A. and Crawfurd, K., Environmental controls on coccolithophore calcification, Mar. Ecol-Prog. Ser., 470, 137–166, 2012.
10
Read, B. A., Kegel, J., Klute, M. J., Kuo, A., Lefebvre, S. C., Maumus, F., Mayer, C., Miller, J., Monier, A., Salamov, A., Young, J., Aguilar, M., Claverie, J. M., Frickenhaus, S., Gonzalez, K., Herman, E. K., Lin, Y. C., Napier, J., Ogata, H., Sarno, A. F., Shmutz, J., Schroeder, D., de Vargas, C., Verret, F., von Dassow, P., Valentin, K., de Peer, Y. V., Wheeler, G., Emiliania huxleyi Annotation Consortium, Dacks, J. B., Delwiche, C. F., Dyhrman, S. T., Glöckner, G.,
15
John, U., Richards, T., Worden, A. Z., Zhang, X. Y., and Grigoriev, I. V: Pan genome of the phytoplanktonEmilianiaunderpins its global distribution, Nature, 499, 209–213, 2013. Reinfelder, J. R.: Carbon concentrating mechanisms in eukaryotic marine phytoplankton, Mar.
Sci., 3, 291–315, 2011.
Rickaby, R. E. M., Henderiks, J., and Young, J. N.: Perturbing phytoplankton: response and
iso-20
topic fractionation with changing carbonate chemistry in two coccolithophore species, Clim. Past., 6, 771–785, 2010.
Riebesell, U. and Tortell, P. D.: Effects of ocean acidification on pelagic organisms and ecosys-tems, in: Ocean Acidification, edited by: Gattuso, J. P. and Hanson, L., Oxford University Press, Oxford, 99–121, 2011
25
Riebesell, U., Zondervan, I., Rost, B., Tortell, P. D., Zeebe, R. E., and Morel, F. M.: Reduced calcification of marine plankton in response to increased atmospheric CO2, Nature, 407, 364–367, 2000.
Rokitta, S. D. and Rost, B.: Effects of CO2and their modulation by light in the life-cycle stages of the coccolithophoreEmiliania huxleiy, Limnol. Oceanogr., 57, 607–618, 2012.
30
BGD
12, 675–706, 2015Inter- and intra-specific responses of coccolithophores
D. S. Wang et al.
Title Page
Abstract Introduction
Conclusions References
Tables Figures
◭ ◮
◭ ◮
Back Close
Full Screen / Esc
Printer-friendly Version Interactive Discussion
Discussion
P
a
per
|
Discussion
P
a
per
|
Discussion
P
a
per
|
Discussion
P
a
per
|
Ross, P. M., Parker, L., O’Connor, W. A., and Bailey, E. A.: The impact of ocean acidification on reproduction, early development and settlement of marine organisms, Water, 3, 1005–1030, 2011.
Sciandra, A., Harlay, J., Lefevre, D., Lemee, R., Rimmelin, P., Denis, M., and Gattuso, J. P.: Response of coccolithophorid Emiliania huxleiyto elevated partial pressure of CO2 under
5
nitrogen limitation, Mar. Ecol-Prog. Ser., 261, 111–122, 2003.
Shi, D., Xu, Y., and Morel, F. M. M.: Effects of the pH/pCO2control method on medium chemistry and phytoplankton growth, Biogeosciences, 6, 1199–1207, doi:10.5194/bg-6-1199-2009, 2009.
Sinutok, S., Hill, R., Doblin, M. A., Wuhrer, R., and Ralph, P. J.: Warmer more acidic conditions
10
cause decreased productivity and calcification in subtropical coral reef sediment-dwelling calcifiers, Limnol. Oceanogr., 56, 1200–1212, 2011.
Stojkovic, S., Beardall, J., and Matear, R.: CO2-concentrating mechanisms in three Southern Hemisphere strains ofEmiliania huxleiy, J. Phycol., 49, 670–679, 2013.
Suffrian, K., Schulz, K. G., Gutowska, M. A., Riebesell, U., and Bleich, M.: Cellular pH
measure-15
ments inEmiliania huxleiyreveal pronounced membrane proton permeability, New Phytol., 190, 595–608, 2011.
Taylor, A. R., Chrachi, A., Wheeler, G., Goddard, H., and Brownlee, C.: A voltage-gated H+ channel underlying pH homeostasis in calcifying coccolithophores, PloS Biol., 9, 14–16, 2011.
20
Trimborn, S., Langer, G., and Rost, B.: Effect of varying calcium concentrations and light in-tensities on calcification and photosynthesis in Emiliania huxleiy, Limnol. Oceanogr., 52, 2285–2293, 2007.
Turley, C., Eby, M., Ridgwell, A. J., Schmidt, D. N., Findlay, H. S., Brownlee, C., Riebesell, U., Fabry, V. J., Feely, R. A., and Gattuso, J. P.: : The societal challenge of ocean acidification,
25
Mar. Pollut. Bull., 60, 787–792, 2010.
Winter, A. and Siesser, W. G.: Coccolithophores, in: Coccolithophores, edited by: Winter, A., William, G., and Siesser, W. G., Cambridge University Press, Cambridge, UK, 252 pp., 1994. Winter, A., Henderiks, J., Beaufort, L., Rickaby, R. E., and Brown, C. W.: Poleward expansion
of the coccolithophoreEmiliania huxleiy, J. Plankton Res., 36, 316–325, 2014.
30
BGD
12, 675–706, 2015Inter- and intra-specific responses of coccolithophores
D. S. Wang et al.
Title Page
Abstract Introduction
Conclusions References
Tables Figures
◭ ◮
◭ ◮
Back Close
Full Screen / Esc
Printer-friendly Version Interactive Discussion
Discussion
P
a
per
|
Discussion
P
a
per
|
Discussion
P
a
per
|
Discussion
P
a
per
|
photoperiod in Antarctic sea ice algaeChlamydomonassp. ICE- L, Environ. Sci. Technol., 48, 7738–7746, 2014.
Young, J. R., Poulton, A. J., and Tyrrell, T.: Morphology of Emiliania huxleyi coccoliths on the northwestern European shelf – is there an influence of carbonate chemistry?, Biogeo-sciences, 11, 4771–4782, doi:10.5194/bg-11-4771-2014, 2014.
5
BGD
12, 675–706, 2015Inter- and intra-specific responses of coccolithophores
D. S. Wang et al.
Title Page
Abstract Introduction
Conclusions References
Tables Figures
◭ ◮
◭ ◮
Back Close
Full Screen / Esc
Printer-friendly Version Interactive Discussion
Discussion
P
a
per
|
Discussion
P
a
per
|
Discussion
P
a
per
|
Discussion
P
a
per
|
Figure 1.The growth curves(a–d)and specific growth rates(e–h)of the four speciesE. huxleyi
(a, e),E. huxleyiCS369(b, f),G. oceanicaNIES-1318(c, g), andG. oceanica(d, h)for different CO2concentrations (380, 750, 1000, and 2000 µatm). The vertical bars represent the SD (n=
BGD
12, 675–706, 2015Inter- and intra-specific responses of coccolithophores
D. S. Wang et al.
Title Page
Abstract Introduction
Conclusions References
Tables Figures
◭ ◮
◭ ◮
Back Close
Full Screen / Esc
Printer-friendly Version Interactive Discussion
Discussion
P
a
per
|
Discussion
P
a
per
|
Discussion
P
a
per
|
Discussion
P
a
per
|
Figure 4.Nitrogen uptake rate response curves relative to changing pCO2for fourE. huxleyi andG. oceanicastrains. The best-fit hyperbolic saturation curves (solid lines) with 95 % con-fidence limits (dashed lines) forE. huxleyi(N-E;(a),E. CS369(C-E;(b),G. NIES-1318(N-G;
BGD
12, 675–706, 2015Inter- and intra-specific responses of coccolithophores
D. S. Wang et al.
Title Page
Abstract Introduction
Conclusions References
Tables Figures
◭ ◮
◭ ◮
Back Close
Full Screen / Esc
Printer-friendly Version Interactive Discussion
Discussion
P
a
per
|
Discussion
P
a
per
|
Discussion
P
a
per
|
Discussion
P
a
per
|