Arq Neuropsiquiatr 2005;63(2-B):430-436
Universidade Federal de São Paulo, Escola Paulista de Medicina (UNIFESP-EPM) e Faculdade de Ciências Medicas da Santa Casa de São Paulo. (FCM-SCSP), São Paulo SP, Brasil:1Graduanda do 3oano do Curso de Fonoaudiologia da UNIFESP-EPM;2P rofessor Adjunto do
D e p a rtamento de Morfologia da UNIFESP-EPM;3P rofessora Adjunta do Departamento de Patologia da FCM-SCSP. Apoio: CNPq/PIBIC.
Received 23 July 2004, received in final form 19 December 2004. Accepted 14 February 2005. Dra. Paula J. Ribeiro - Rua Max Planck 419 - 03693-030 São Paulo SP - Brasil
ENCEPHALOMETRY ON THE MEDIAL FACE
OF THE HUMAN BRAIN HEMISPHERE
A necropsy study
Paula J. Ribeiro
1, Serafim V. Cricenti V.
2Carmen L.P. Lancellotti
3ABSTRACT - This study aims to evaluate the dimensions of the human brain, specifically in the frontal cor-tex, helping the analysis of neuroimaging. A form was made to register and describe encephalic measure-ments and 81 cerebral hemispheres (CH) were analyzed. Male individuals showed larger CH length; wider superior frontal gyrus in the right CH; bigger encephalic weight and corpus callosum (CC) width. The pro p o r-tion of measurement from the frontal pole to the most anterior part of the CC genu, related to the CH len-gth gets smaller with aging, whereas the average distance from the most posterior part of the splenum of the CC to the occipital pole was bigger in both male CHs and there was a tendency of decrease in this dif-ference with aging.
KEY WORDS: neuroanatomy, brain, encephalic weight.
Encefalometria na face medial do hemisfério cerebral humano: estudo em necropsias
RESUMO - Este estudo visa avaliar as dimensões do cére b ro humano, part i c u l a rmente do córtex frontal, po-dendo colaborar para as análises de neuroimagem. Foi elaborado um formulário para registro e descrição das medidas encefálicas. A amostra foi constituída por 81 hemisférios cerebrais (HC) adultos. Os homens a p re-sentaram maior comprimento do HC; giro frontal superior mais largo no HC direito; maior peso encefálico e largura do corpo caloso (CC). A proporção da medida do pólo frontal à parte mais anterior do joelho do CC, em relação ao comprimento do HC diminui com o avanço da idade. Já a da média da distância da parte mais posterior do esplênio do CC ao pólo occipital foi maior em ambos HC dos homens e houve tendência à diminuição desta proporção com o avanço da idade.
PALAVRAS-CHAVE: neuroanatomia, cérebro, peso encefálico.
The frontal cortex represents about one third of the whole brain. It is essential for the motor behavior, not only for mechanical action regula-tion, as muscle strength, but also in the decision of the proper movements to be executed in the path of a certain goal. On the lateral surface, the major part of the frontal lobe is important in the emotions and cognitive functions. The cingulate gyrus, important in the emotional functions and the corpus callosum integrates the functions of the two hemispheres1.
The brain may suffer diverse changes, many of them related to aging, as cortical atrophy, brain weight loss and decrease of blood perfusion due to traumatic disorders or other diseases, etc2. The
motivation of this study comes from the import a n c e
of the frontal cortex to human life. Besides that, the reports on measurements of the brain surface in the literature are rare and they can collaborate to the determination of specific neurological dis-eases and help in the diagnosis by imaging.
Fig 1. Encephalometry on the medial face of the human brain hemisphere. Ref. 1: Line formed by the union of the point in the most anterior part of the frontal pole to the one sit -uated in the most posterior region of the occipital pole; Ref. 2: Perpendicular line to the line touching the point of meeting of the Central sulcus to the superior board of the cortex to the corpus callosum, Fsuperior frontal gyrus, CCingulate gyrus; Ref. 3: Line passing by the center of the mamillary body , center of the anterior commissure and reaches the superior b o a rdof the frontal córtex, Fsuperior frontal gyrus, CCingulate gyrus; Ref. 4: Line form e d by the union of the point situated in the most anterior part of the genu of the corpus cal -losum to the most anterior part of the frontal pole, Fsuperior frontal gyrus, CC i n g u l a t e g y rus; Ref. 5: Line touching the genu of the corpus callosum and crossing the Ref. 1. Fsupe -rior frontal gyrus, C Cingulate gyrus; Ref. 6: Line crossing the most ventral part of the cor -pus callosum, perpendicular to Ref. 1. Fsuperior frontal gyrus, CCingulate gyrus; Ref. 7: Line that unites the point situated in the most posterior part of the splenium of the corpus cal -losum to the one most posterior in the occipital pole.
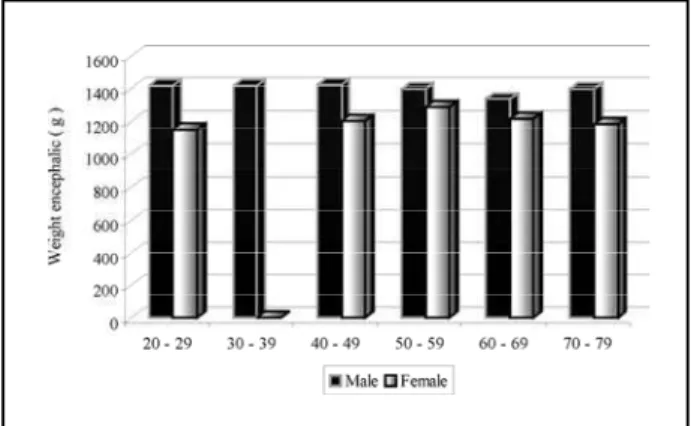
Graphic 1. Distribution of the population according to genre, a g e and average encephalic weight (g).
the cerebral hemisphere and to compare the weight of the analyzed brains to the genre and age of patients.
METHOD
This was a descriptive study, developed in the Ana-tomy laboratory from the Discipline of Descriptive and Topographic Anatomy of the Morphology Department of the Federal University of São Paulo (UNIFESP) - Paulista School of Medicine, with the participation of the Santa Casa Hospital Department of Pathology. The material c o n-sisted of 81 brain hemispheres, 51 male and 30 female, with an age varying from 20 to 79 years. These brain h e m i-spheres were obtained in necropsies performed in the UNIFESP and in the Santa Casa de São Paulo, conserved in a solution of 10 % formol. Clinical data from the p a t i e n t s as genre, age and encephalic weight were taken from t h e registration book of the involved Institutions.
The method used was the one part of a protocol na-med “Registration of Encephalometry on the Medial face of the human brain hemisphere”, which the main measu-rements are referred in Figure 1.
432 Arq Neuropsiquiatr 2005;63(2-B)
the total length of the brain hemisphere.Ref. 2:P e r p e n-dicular line to the line touching the point of meeting of the Central sulcus to the superior board of the cortex to the corpus callosum. Through this re f e rence, one can see the width of the superior frontal gyrus (F) and of the cingulate gyrus (C), on this level.Ref. 3:Line pass-ing by the center of the mamillary body, center of the anterior commissure and reaching the superior board o f the frontal cortex. Through this reference, one can see the width of the superior frontal gyrus (F) and of the c i n-gulate gyrus (C), on this level.Ref. 4:Line formed by the union of the point situated in the most anterior part of the genu of the corpus callosum to the most anterior p a rt of the frontal pole. Through this reference, one can see the width of the superior frontal gyrus (F) and of the c i n-gulate gyrus (C), on this level. Ref. 5:Line touching the genu of the corpus callosum and crossing theRef. 1.T h ro-ugh this reference, one can see the width of the supe-rior frontal gyrus (F) and of the cingulate gyrus (C), on this level. Ref. 6: Line crossing the most ventral part of the corpus callosum, perpendicular toRef. 1. Through this re f e rence, one can see the width of the superior fro n-tal gyrus (F) and of the cingulate gyrus (C), on this lev-el.Ref. 7:Line that unites the point situated in the most posterior part of the splenium of the corpus callosum to the one most posterior in the occipital pole.
The statistical analysis was perf o rmed in the Depart-ment of Preventive Medicine of UNIFESP and the techni-que employed was the deviation analysis2.
The Committee for Medical Ethics has analyzed and accepted the project under the number 324/99.
RESULTS
The analysis of results was done according to t h e following topics: characterization of the popula-tion, measurement analysis of the left and right brain hemispheres and statistical study.
Characterization of the population –26 male and
16 female right brain hemispheres were analyzed, 25 male left and 14 female left. The population of this study was distributed under the following age g roups: 20 to 29, 30 to 39, 40 to 49, 50 to 59, 60 to 69 and 70 to 79. The majority of male individuals w e-re in the 50 to 59 group and the female individuals were mostly in the 70 to 79 group.
The smallest encephalic weigh was found in t h e female group - 1086, 6 g - and the biggest - 1703,3 in the male group. In Graphic 1, one can see the w e i-ght diff e rences, according to age and genre of t h e studied population.
Analysis of the measurements on the right and
left brain hemispheres –On the right brain
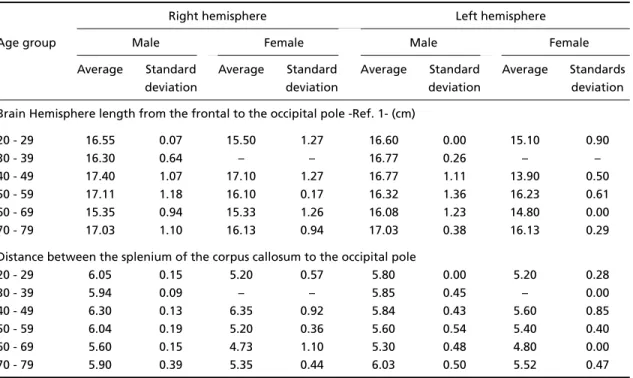
hemi-sphere, as well as on the left, one could see that the average length of the brain hemisphere was b i g-ger in men, as notified in Table 1. In this table, one can also see that the distance between the splenum of the corpus callosum to the occipital pole was big-ger in men, not mattering which hemisphere was
Table 1. Distribution of population according to genre, age group, brain hemisphere, average, standard deviation, when related to the brain hemisphere length from the frontal to the occipital pole, and to the distance between the splenium of the corpus callosum to the occipital pole.
Right hemisphere Left hemisphere
Age group Male Female Male Female
Average Standard Average Standard Average Standard Average Standards
deviation deviation deviation deviation
Brain Hemisphere length from the frontal to the occipital pole -Ref. 1- (cm)
20 - 29 16.55 0.07 15.50 1.27 16.60 0.00 15.10 0.90
30 - 39 16.30 0.64 – – 16.77 0.26 – –
40 - 49 17.40 1.07 17.10 1.27 16.77 1.11 13.90 0.50
50 - 59 17.11 1.18 16.10 0.17 16.32 1.36 16.23 0.61
60 - 69 15.35 0.94 15.33 1.26 16.08 1.23 14.80 0.00
70 - 79 17.03 1.10 16.13 0.94 17.03 0.38 16.13 0.29
Distance between the splenium of the corpus callosum to the occipital pole
20 - 29 6.05 0.15 5.20 0.57 5.80 0.00 5.20 0.28
30 - 39 5.94 0.09 – – 5.85 0.45 – 0.00
40 - 49 6.30 0.13 6.35 0.92 5.84 0.43 5.60 0.85
50 - 59 6.04 0.19 5.20 0.36 5.60 0.54 5.40 0.40
60 - 69 5.60 0.15 4.73 1.10 5.30 0.48 4.80 0.00
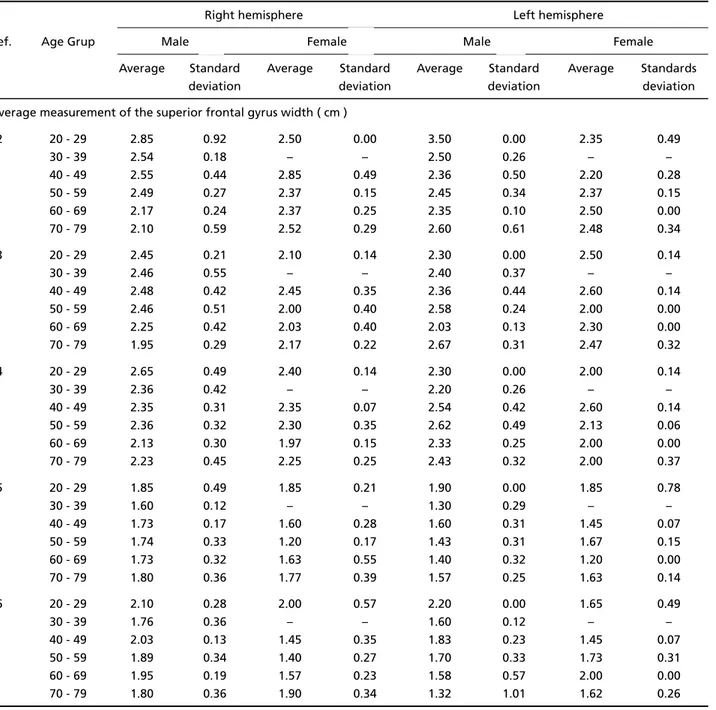
Table 2. Distribution of population according to genre, age group, brain hemisphere, average, standard deviation, when related to the width of the superior frontal gyrus, according to the adopted reference.
Right hemisphere Left hemisphere
Ref. Age Grup Male Female Male Female
Average Standard Average Standard Average Standard Average Standards
deviation deviation deviation deviation
Average measurement of the superior frontal gyrus width ( cm )
2 20 - 29 2.85 0.92 2.50 0.00 3.50 0.00 2.35 0.49
30 - 39 2.54 0.18 – – 2.50 0.26 – –
40 - 49 2.55 0.44 2.85 0.49 2.36 0.50 2.20 0.28
50 - 59 2.49 0.27 2.37 0.15 2.45 0.34 2.37 0.15
60 - 69 2.17 0.24 2.37 0.25 2.35 0.10 2.50 0.00
70 - 79 2.10 0.59 2.52 0.29 2.60 0.61 2.48 0.34
3 20 - 29 2.45 0.21 2.10 0.14 2.30 0.00 2.50 0.14
30 - 39 2.46 0.55 – – 2.40 0.37 – –
40 - 49 2.48 0.42 2.45 0.35 2.36 0.44 2.60 0.14
50 - 59 2.46 0.51 2.00 0.40 2.58 0.24 2.00 0.00
60 - 69 2.25 0.42 2.03 0.40 2.03 0.13 2.30 0.00
70 - 79 1.95 0.29 2.17 0.22 2.67 0.31 2.47 0.32
4 20 - 29 2.65 0.49 2.40 0.14 2.30 0.00 2.00 0.14
30 - 39 2.36 0.42 – – 2.20 0.26 – –
40 - 49 2.35 0.31 2.35 0.07 2.54 0.42 2.60 0.14
50 - 59 2.36 0.32 2.30 0.35 2.62 0.49 2.13 0.06
60 - 69 2.13 0.30 1.97 0.15 2.33 0.25 2.00 0.00
70 - 79 2.23 0.45 2.25 0.25 2.43 0.32 2.00 0.37
5 20 - 29 1.85 0.49 1.85 0.21 1.90 0.00 1.85 0.78
30 - 39 1.60 0.12 – – 1.30 0.29 – –
40 - 49 1.73 0.17 1.60 0.28 1.60 0.31 1.45 0.07
50 - 59 1.74 0.33 1.20 0.17 1.43 0.31 1.67 0.15
60 - 69 1.73 0.32 1.63 0.55 1.40 0.32 1.20 0.00
70 - 79 1.80 0.36 1.77 0.39 1.57 0.25 1.63 0.14
6 20 - 29 2.10 0.28 2.00 0.57 2.20 0.00 1.65 0.49
30 - 39 1.76 0.36 – – 1.60 0.12 – –
40 - 49 2.03 0.13 1.45 0.35 1.83 0.23 1.45 0.07
50 - 59 1.89 0.34 1.40 0.27 1.70 0.33 1.73 0.31
60 - 69 1.95 0.19 1.57 0.23 1.58 0.57 2.00 0.00
70 - 79 1.80 0.36 1.90 0.34 1.32 1.01 1.62 0.26
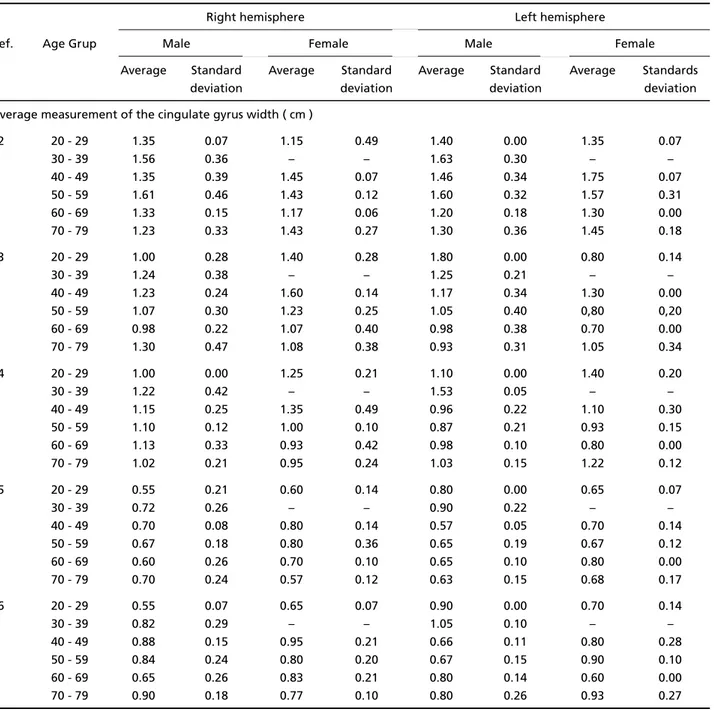
analyzed. The width of the superior frontal gyrus and the cingulated gyrus showed some diff e re n c e a c c o rding to genre and age, according to the studi-ed reference, as seen in Tables 2 and 3.
As to the proportional distance between the most anterior part of the genu of the corpus callo-sum to the most anterior part of the frontal pole, (Ref. 4), with the BH length, we observed bigger values in the left hemisphere in both male and fe-male and a decrease of this diff e rence with aging, in both genres and sides. (Table 4). The pro p o rt i o n-al distance between the most posterior part of the
splenium of the corpus callosum to the most pos-terior part of the occipital pole (Ref 7), with the BH length, we observed bigger values in the right h e m i s p h e reof men and left of women, and a ten-dency of decrease of this proportion with aging, not mattering the genre or brain hemisphere.
434 Arq Neuropsiquiatr 2005;63(2-B)
DISCUSSION
In the literature there are other reports on en-cephalic weight4 - 6. Our study revealed that avera g e
of the encephalic weight was 1395.5g in the male and 1199.2g in the female patients, with a stan-dard deviation of 34.66g for men and 30.05g for women. This result agrees with another study in Ve-nezuela in 1997 where it was established that the average weight of the normal adult males in Ve-nezuela are bigger (1215 g) than the adult females ( 1 1 2 2 g )7. The authors have also noticed that there
is a decrease of the weight in aging, in both
gen-res, this decrease obeying the intrinsic process of b r a i n degeneration6. In our case, the statistical analysis
did not reveal significative correlation between the brain weight and the age of individuals, probably due to the fact that the study was not equally dis-tributed in different ages.
Another study in 1988 verified that the brain of schizophrenic individuals and mentally challen-ged are smaller than those with another psychia t r i c illnesses, neurologic diseases or trauma. It was yet considered that there was no grand alteration of the brain weight in the maniac depressive
psycho-Table 3. Distribution of population according to genre, age group, brain hemisphere, average, standard deviation, when related to the width of cingulate gyrus, according to the adopted reference.
Right hemisphere Left hemisphere
Ref. Age Grup Male Female Male Female
Average Standard Average Standard Average Standard Average Standards
deviation deviation deviation deviation
Average measurement of the cingulate gyrus width ( cm )
2 20 - 29 1.35 0.07 1.15 0.49 1.40 0.00 1.35 0.07
30 - 39 1.56 0.36 – – 1.63 0.30 – –
40 - 49 1.35 0.39 1.45 0.07 1.46 0.34 1.75 0.07
50 - 59 1.61 0.46 1.43 0.12 1.60 0.32 1.57 0.31
60 - 69 1.33 0.15 1.17 0.06 1.20 0.18 1.30 0.00
70 - 79 1.23 0.33 1.43 0.27 1.30 0.36 1.45 0.18
3 20 - 29 1.00 0.28 1.40 0.28 1.80 0.00 0.80 0.14
30 - 39 1.24 0.38 – – 1.25 0.21 – –
40 - 49 1.23 0.24 1.60 0.14 1.17 0.34 1.30 0.00
50 - 59 1.07 0.30 1.23 0.25 1.05 0.40 0,80 0,20
60 - 69 0.98 0.22 1.07 0.40 0.98 0.38 0.70 0.00
70 - 79 1.30 0.47 1.08 0.38 0.93 0.31 1.05 0.34
4 20 - 29 1.00 0.00 1.25 0.21 1.10 0.00 1.40 0.20
30 - 39 1.22 0.42 – – 1.53 0.05 – –
40 - 49 1.15 0.25 1.35 0.49 0.96 0.22 1.10 0.30
50 - 59 1.10 0.12 1.00 0.10 0.87 0.21 0.93 0.15
60 - 69 1.13 0.33 0.93 0.42 0.98 0.10 0.80 0.00
70 - 79 1.02 0.21 0.95 0.24 1.03 0.15 1.22 0.12
5 20 - 29 0.55 0.21 0.60 0.14 0.80 0.00 0.65 0.07
30 - 39 0.72 0.26 – – 0.90 0.22 – –
40 - 49 0.70 0.08 0.80 0.14 0.57 0.05 0.70 0.14
50 - 59 0.67 0.18 0.80 0.36 0.65 0.19 0.67 0.12
60 - 69 0.60 0.26 0.70 0.10 0.65 0.10 0.80 0.00
70 - 79 0.70 0.24 0.57 0.12 0.63 0.15 0.68 0.17
6 20 - 29 0.55 0.07 0.65 0.07 0.90 0.00 0.70 0.14
30 - 39 0.82 0.29 – – 1.05 0.10 – –
40 - 49 0.88 0.15 0.95 0.21 0.66 0.11 0.80 0.28
50 - 59 0.84 0.24 0.80 0.20 0.67 0.15 0.90 0.10
60 - 69 0.65 0.26 0.83 0.21 0.80 0.14 0.60 0.00
Table 4. Distribution of the population according to genre, age group, brain hemisphere, average and standard deviation of the measurements from the frontal pole to the genu of the corpus callosum and from the splenium of the corpus callosum to the occipital pole, related to the brain hemisphere length.
Right hemisphere Left hemisphere
Age group Male Female Male Female
Average Standard Average Standard Average Standard Average Standards
deviation deviation deviation deviation
% of the measurement from the frontal pole to the genu of the corpus callosum (Ref. 4) related to the brain hemisphere length (Ref. 1)
20 - 29 22.05 3.09 23.55 0.35 20.48 0.00 22.51 0.92
30 - 39 21.96 1.15 – – 22.24 1.42 – –
40 - 49 20.11 1.95 21.64 0.87 20.87 2.77 26.62 3.39
50 - 59 20.22 2.10 20.49 1.51 21.38 3.50 18.85 0.32
60 - 69 21.23 2.35 18.91 0.74 20.58 1.22 18.92 0.00
70 - 79 19.08 1.72 19.83 2.06 20.31 2.23 19.96 1.96
% of the measurement from the splenium of the corpus callosum to the occipital pole (Ref.7) related to the brain hemisphere Length (Ref. 1)
20 - 29 36.56 1.44 33.54 0.90 34.93 0.00 34.43 1.03
30 - 39 36.52 2.61 – – 34.88 2.58 – –
40 - 49 36.27 1.94 37.13 2.62 34.82 2.57 40.28 8.16
50 - 59 35.35 2.39 32.29 2.56 34.31 2.36 33.27 0.32
60 - 69 36.55 2.29 30.85 7.28 32.96 3.59 32.43 0.00
70 - 79 34.64 3.83 33.16 3.02 35.40 2.22 34.22 2.50
Table 5. Statistical results related to genre and age group, when correlated to the brain hemisphere.
Reference Genre Hemisphere Age Interaction
genre hemisphere
1 0.001 Ns Ns Ns
2 F C F C F C F C
Ns Ns Ns Ns Ns Ns Ns Ns
3 F C F C F C F C
Ns Ns 0.095 Ns Ns 0.068 Ns Ns
4 F C F C F C F C
0.011 Ns Ns Ns Ns 0.032 Ns Ns
5 F C F C F C F C
Ns Ns 0.029 Ns Ns Ns Ns Ns
6 F C F C F C F C
Ns Ns 0.050 Ns Ns Ns Ns Ns
7 <0.001 Ns Ns Ns
4/1 Ns Ns 0.001 Ns
7/1 Ns Ns 0.070 0.031
Weight <0.001 – Ns
436 Arq Neuropsiquiatr 2005;63(2-B)
sis. According to the authors, the average weight d e c reased with aging but there was no diff e re n c e s regarding genre8.
When according to encephalometry, the cases related in literature are very rare9. Andrade10,
re-f e rred that the width ore-f the cortical layer has been measured in different age groups and that in the first 50 years of living there was a progressive de-c rease of this layer, with a bigger atrophy in the e l d-erly due to the White matter. Our study revealed d i ff e rences in genres, superior frontal gyrus and c i n-gulated gyrus widths, brain hemisphere length a n d in the pro p o rtion of the re f e rences 4 and 7 to 1. We o b s e rved the presence of two cases which the pro-p o rtion showed a variable value range when com-p a red to the other cases. We believe this corres com-p o n-ds to extreme or maybe sporadic cases, for they are not above the average. The correlation to other c l i-nical pathological data may explain these diff e re n-ces. Besides that, the age is another issue to be con-s i d e red,but we have already re f e rred the diff i c u l-ty when working with very distant ages.
We hope to have contributed to the corre l a t i o n of our measurements to the ones obtained by ima-ging. Other studies are vital for human brain meas-urements. In future studies, we may correlate the measurements to the different neurological enti-ties, and perhaps even correlate them to level of education and professional activity.
In conclusion, the male individuals showed big-ger brain hemisphere length, in both sides; a wider superior frontal gyrus in the right hemisphere; a n d bigger encephalic weight. The proportion of the
m e a s u rement of the distance between the fro n t a l pole to the most anterior part of the genu of the corpus callosum, when related to the brain hemi-s p h e re length, wahemi-s bigger on the left hemi-side of the m a l e and female individuals and had a decrease with aging, not mattering the genre or brain hemisphe-re. The average value of the distance between the most posterior part of the splenium of the corpus callosum to the occipital pole when related to the h e m i s p h e relength showed to be bigger in the m a l e right hemisphere and female left, with a decreas-ing tendency with agdecreas-ing.We then verified that a-ging has interf e red in some of the re f e rences studi-ed, but due to the fact the age groups were not p ro p o rtional, a strict analysis of this specific factor could not be properly studied.
REFERENCES
1. Young PA, Young, PH. Bases de neuroanatomia clínica. Rio de Janeiro: Guanabara Koogan, 1998:152-155.
2. Fonseca JS, Martins GA. Curso de estatística, 6.Ed. São Paulo: Atlas, 1996. 3. Dani US, Hori A, Walter FG. Principles of neural aging. Amsterdam:
Elservier, 1997.
4. Rodrigues CAC, A rus M.A. Contribuição ao estudo do peso do encéfa-lo normal no brasileiro adulto. Vittalle (Rio Grande, RS), 1986:2:45-52. 5. Ho K, Roessmann U, Straumfjord J, Monroe G. Newborn brain weight
in relation to maturity, sex and race. Ann Neurol 1981;10:243-246. 6. Dekaban AS. Changes in brain weights during the span of human life:
relation of brain weights to body heights and body weights. A n n Neurol 1978;4:345-56.
7. Sánchez R, Morales M, Cardozo J. Peso del encéfalo normal del venezola-no adulto según sexo y edad. Invest Clin 1997;38:2:83-293.
8. Va l e ron A F, Gómez PEI, García JME., Gómez PMV, Díaz GRF. Va r i a c i o n e s del peso encefálico en enfemedades mentales de larga duración. Rev Hosp Psiquiatr La Habana 1988;29:405-412.
9 . Giedd JN, Snell JW, Lange, N, et al. Quantitative magnetic resonance ima-ging of human brain development: ages. Cerebral Cortex 1996;6:551-560. 10. Andrade LAF. Alguns aspectos neurobiológicos do envelhecimento