BGD
3, 123–154, 2006CO23−concentration and pCO2 thresholds
K. K. Yates and R. B. Halley
Title Page
Abstract Introduction
Conclusions References
Tables Figures
◭ ◮
◭ ◮
Back Close
Full Screen / Esc
Print Version
Interactive Discussion
EGU Biogeosciences Discussions, 3, 123–154, 2006
www.biogeosciences.net/bgd/3/123/ SRef-ID: 1810-6285/bgd/2006-3-123 European Geosciences Union
Biogeosciences Discussions
Biogeosciences Discussionsis the access reviewed discussion forum ofBiogeosciences
CO
2
3
−
concentration and pCO
2
thresholds
for calcification and dissolution on the
Molokai reef flat, Hawaii
K. K. Yates and R. B. Halley
U.S. Geological Survey, Center for Coastal and Watershed Studies, St. Petersburg, FL 33701, USA
Received: 5 December 2005 – Accepted: 22 December 2005 – Published: 31 January 2006 Correspondence to: K. K. Yates ([email protected])
BGD
3, 123–154, 2006CO23−concentration and pCO2 thresholds
K. K. Yates and R. B. Halley
Title Page
Abstract Introduction
Conclusions References
Tables Figures
◭ ◮
◭ ◮
Back Close
Full Screen / Esc
Print Version
Interactive Discussion
EGU
Abstract
The severity of the impact of elevated atmospheric pCO2 to coral reef ecosystems
depends, in part, on how seawater pCO2 affects the balance between calcification
and dissolution of carbonate sediments. Presently, there are insufficient published data that relate concentrations of pCO2 and CO
2−
3 to in situ rates of reef calcification 5
in natural settings to accurately predict the impact of elevated atmospheric pCO2 on
calcification and dissolution processes. Rates of net calcification and dissolution, CO23− concentrations, and pCO2were measured, in situ, on patch reefs, bare sand, and coral rubble on the Molokai reef flat in Hawaii. Rates of calcification ranged from 0.003 to 0.23 g CaCO3m−
2
h−1and dissolution ranged from−0.005 to−0.33 g CaCO3m− 2
h−1. 10
Calcification and dissolution varied diurnally with net calcification primarily occurring during the day and net dissolution occurring at night. These data were used to calculate threshold values for pCO2and CO
2−
3 at which rates of calcification and dissolution are
equivalent. Results indicate that calcification and dissolution are linearly correlated with both CO23− and pCO2. Threshold pCO2and CO
2−
3 values for individual substrate types 15
showed considerable variation. The average pCO2 threshold value for all substrate
types was 654±195µatm and ranged from 467 to 1003µatm. The average CO23−
threshold value was 152±24µmol kg−1, ranging from 113 to 184µmol kg−1. Ambient
seawater measurements of pCO2 and CO
2−
3 indicate that CO 2−
3 and pCO2 threshold
values for all substrate types were both exceeded, simultaneously, 13% of the time at 20
present day atmospheric pCO2 concentrations. It is predicted that atmospheric pCO2 will exceed the average pCO2 threshold value for calcification and dissolution on the
Molokai reef flat by the year 2100.
1. Introduction
Experimental results and models suggest that rising atmospheric CO2 and resulting 25
BGD
3, 123–154, 2006CO23−concentration and pCO2 thresholds
K. K. Yates and R. B. Halley
Title Page
Abstract Introduction
Conclusions References
Tables Figures
◭ ◮
◭ ◮
Back Close
Full Screen / Esc
Print Version
Interactive Discussion
EGU waters will cause a decrease in rates of calcification on coral reefs by the middle of the
21st century (Gattuso et al., 1999; Kleypas et al., 1999; Mackenzie et al., 2000; Lang-don et al., 2000; Leclercq et al., 2000, 2002; Anderson et al., 2003) and an increase in rates of dissolution of carbonate sediments (Barnes and Cuff, 2000; Halley and Yates, 2000; Andersson et al., 2003). Reduced calcification and loss of carbonate sediment 5
may inhibit the ability of coral reefs to keep up with rising sea level (Smith and Kinsey, 1976), cause premature “erosion” of coral reef structure (Kleypas et al., 2001), and inhibit the ability of corals and other calcifying reef builders to compete with more op-portunistic benthic species including algae and sponges. The severity of the impact of elevated CO2on coral reef systems depends, in part, upon the balance between coral 10
reef calcification and dissolution of reef sediments. Development of predictive capabil-ities that describe this balance requires in situ characterization of seawater carbonate chemistry and calcification rates in natural reef communities of varying composition in order to place constraints on the range of pCO2and CO2−
3 at which rates of sediment
dissolution exceed rates of calcification. Rates of calcification on coral reefs have been 15
well characterized through in situ measurements made in numerous coral reef systems over the past four decades (e.g. Kinsey, 1972, 1978, 1979, 1985; Smith, 1973, 1981; Atkinson and Grigg, 1984; Barnes and Devereux, 1984; Smith et al., 1985; Conand et al., 1997; Gattuso et al., 1997; Boucher et al., 1998; Yates and Halley, 2003). How-ever, there is insufficient published data for quantifying the relation among in situ pCO2, 20
CO2−
3 concentrations, and the balance between calcification and dissolution in natural
reef settings to accurately predict the impact of elevated atmospheric CO2.
Many studies have demonstrated a close correlation between the rate of calcifica-tion by marine organisms and aragonite saturacalcifica-tion state (Borowitzka, 1981; Gao et al., 1993; Langdon et al., 1998, 2000; Gattuso et al., 1998; Marubini and Thake, 1999; 25
prod-BGD
3, 123–154, 2006CO23−concentration and pCO2 thresholds
K. K. Yates and R. B. Halley
Title Page
Abstract Introduction
Conclusions References
Tables Figures
◭ ◮
◭ ◮
Back Close
Full Screen / Esc
Print Version
Interactive Discussion
EGU uct (Ksp*) (Andersson et al., 2003), and is, thus, dependant upon the distribution of
inorganic carbon species in seawater (H2CO3, HCO−
3, and CO 2−
3 ). The distribution
of inorganic carbon species is regulated, in part, by changes in seawater pH (Stumm and Morgan, 1981). As atmospheric pCO2 increases and equilibrates with seawater,
carbonic acid is generated via: 5
CO2+H2O→H2CO3, (R1)
causing a reduction in pH and a shift in carbonate speciation that reduces the concen-tration of CO23−and increases the concentration of HCO−3 via:
H2CO3→H++HCO−3, and CO23−+H+ →HCO−3. (R2)
Thus, an increase in pCO2and a reduction in CO 2−
3 concentration result in a reduction 10
of saturation state. Inorganic dissolution of carbonate sediments occurs when saturate state is less than one.
Diurnal variation in calcification and dissolution with net calcification occurring during the day and net dissolution occurring at night in surface waters that remain supersat-urated with respect to calcite and aragonite has long been recognized (Kinsey, 1978; 15
Barnes and Devereux, 1984; Gattuso et al., 1993, 1997; Conand et al., 1997; Boucher et al., 1998; Yates and Halley, 2003, 2006). Earlier studies (Kinsey et al., 1978; Barnes and Devereux, 1984; Gattuso et al., 1993) indicate that calcification during the day typically exceeded dissolution during the night resulting in net carbonate sediment pro-duction during 24 h time periods, or that calcification occurred during both day and night 20
(Smith, 1973). More recent studies provide many examples of reef areas in which dis-solution is now exceeding calcification resulting in a net loss of carbonate sediment from the system over 24 h time periods (Conand et al., 1997 – back reef zone during summer only; Gattuso et al., 1997; Boucher et al., 1998; Yates and Halley, 2003, 2006). Saturation state in the tropics has decreased, on average, from 4.6 to 4.0 over the past 25
century (Kleypas et al., 1999) and atmospheric pCO2 has increased from 338 to 375
BGD
3, 123–154, 2006CO23−concentration and pCO2 thresholds
K. K. Yates and R. B. Halley
Title Page
Abstract Introduction
Conclusions References
Tables Figures
◭ ◮
◭ ◮
Back Close
Full Screen / Esc
Print Version
Interactive Discussion
EGU 2004). However, detailed studies on corals from the Great Barrier Reef show no
indica-tion of decreasing calcificaindica-tion rates since the industrial revoluindica-tion (McNeil et al., 2004; Pelejero et al., 2005). Whether or not rates of coral reef calcification or dissolution of carbonate sediments in shallow reef environments has already increased over the past half century remains to be determined.
5
Dissolution in shallow, saturated surface waters has been attributed to numerous processes (Peyre’-Venec, 1987; Lazar, 1991; Peyrot-Clausade, 1995; Sabine and Mackenzie, 1995; Charpy-Roubaud et al., 1996; Yates and Halley, 2006). Gattuso et al. (1996) suggested that sediments could have a significant contribution to reef chem-istry as sinks of carbon due to the fact that dissolution of calcium carbonate consumes 10
CO2through the reaction CaCO3+CO2+H2O→Ca2+ 2HCO−3. However, Andersson et al. (2003) provide model evidence indicating that dissolution of carbonate sediments will not buffer the global shallow-water marine environment against changes in pCO2
because of the rapid mixing rate and large reservoir size of the coastal ocean. Whether or not calcium carbonate dissolution will buffer coral reef organisms against the impact 15
of rising CO2and decreasing saturation states in localized areas with longer water
res-idence times, or whether dissolution will simply promote the demise of reef building by removal of carbonate sediment from the reef system remains controversial.
We present calcification and dissolution rates measured in situ, relative to pCO2and
CO2−
3 concentrations for representative substrate types of the Molokai, Hawaii reef flat, 20
and have determined threshold values for pCO2 and CO 2−
3 at which rates of
calcifi-cation and dissolution are equivalent. These threshold values (which we denote as CO23−
,C/D=1and pCO2,C/D=1) indicate the CO 2−
3 and pCO2concentrations that must be
surpassed to cause a transition from net calcification to net dissolution for each sub-strate type. Understanding diurnal, seasonal, inter-annual, species composition, and 25
geographic effects on threshold values of seawater parameters that affect the balance between calcification and dissolution is critical for development of numerical predictive capabilities that will describe the impact of elevated CO2 on reef systems. The range
BGD
3, 123–154, 2006CO23−concentration and pCO2 thresholds
K. K. Yates and R. B. Halley
Title Page
Abstract Introduction
Conclusions References
Tables Figures
◭ ◮
◭ ◮
Back Close
Full Screen / Esc
Print Version
Interactive Discussion
EGU approximation of the natural range of values that might be encountered only on the
Molokai reef flat and do not reflect spatial or temporal variation. Our range of thresh-old values represents only a small contribution to a much larger database of similar measurements that must be acquired to adequately characterize calcification and dis-solution processes in natural reef systems.
5
2. Methods
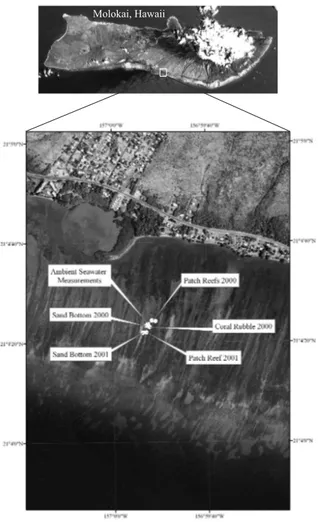
Rates of calcification and dissolution were measured on representative substrate types of the Molokai reef flat from 9–17 February 2000, from 23–24 July 2001, and from 28– 29 July 2001 using a large incubation chamber and the alkalinity anomaly technique (Smith and Key, 1975). The reef flat is approximately 1 km wide and shallow, with water 10
depths ranging from 1 to 2 m. Substrate types measured in this study were located approximately 0.8 km off-shore, and included sand bottom, coral rubble, and patch reefs with 10% or 20% live coral cover located on sand (Fig. 1). Sand bottom consisted of medium to coarse grain carbonate sand of approximately 40% magnesian calcite containing 20 to 24% MgCO3. The mineralogy of the sand was determined by XRD 15
analysis using a Bruker Endeavor D-4 x-ray diffractometer. Coral rubble was colonized by coralline algae including Porolithon sp. and Hydrolithon sp., and by a thin veneer of algal turf. Patch reefs were dominated by scleractinian corals (including Porites
lobata,Porites compressa,Montipora capitata, andPocilloporasp.), several species of
coralline algae, and calcareous algaeHalimeda discoidea. Percentage of coral cover 20
was determined by measurement of the circumference of all live coral colonies within the incubation chamber. Carbonate system parameters, salinity, and temperature were measured in ambient seawater every 4 h throughout the duration of 24-h time periods from 13–14 October 2000, from 20–29 July 2001, and from 16–19 June 2003. Ambient seawater measurements were performed in the same general location as incubation 25
chamber measurements (Fig. 1).
alu-BGD
3, 123–154, 2006CO23−concentration and pCO2 thresholds
K. K. Yates and R. B. Halley
Title Page
Abstract Introduction
Conclusions References
Tables Figures
◭ ◮
◭ ◮
Back Close
Full Screen / Esc
Print Version
Interactive Discussion
EGU minum frame and a clear, 10-mil vinyl tent fitted over the frame, was placed over each
substrate type to isolate the water mass over the seafloor from ambient water. Detailed methodology on use of this incubation chamber, known as the Submersible Habitat for Analyzing Reef Quality (or SHARQ, U.S. patent #6,467,424 B1), can be found in Yates and Halley (2003). The vinyl tent was sealed to the seafloor by laying sand bags on a 5
seal-flap around the perimeter of the incubation chamber to prevent leakage of water into or out of the tent. A submersible pump (246 LPM) was mounted to the aluminum frame and connected to a circulation system to maintain turbulent flow inside of the chamber. Oscillatory motion inside of the incubation chamber was achieved by trans-lation of wave motion through the flexible tent structure. Water was diverted from the 10
chamber’s circulation system, using a secondary booster pump (44 LPM), to a flow-through analytical system located on a fixed platform at the water’s surface. The water was then pumped back into the chamber after analysis in a closed-loop system. Salin-ity, temperature, and pH were measured continuously in the incubation chamber by the flow-through analytical system using an Orion Ross pH electrode (±0.005 pH unit), and
15
Orion conductivity (±0.1 psu) and temperature (±0.1◦C) probes. All probes were fitted into a PVC manifold attached to the flow-through analytical system, and data were logged every one-minute throughout the duration of 24-h incubation periods on each substrate type. pH electrodes were calibrated using Tris seawater buffers prepared at an ionic strength of 0.7 and scaled to the free-hydrogen-ion concentration scale (pHf) 20
(Millero, 1996). Conductivity probes were calibrated using standards acquired from the USGS Ocala National Water Quality and Research Laboratory. Fluorescein dye was injected into the incubation chamber during each deployment to determine incubation chamber volume, mixing rate, and leakage as described previously by Yates and Hal-ley (2003). Water samples (500 mL) for total alkalinity analyses were removed from 25
BGD
3, 123–154, 2006CO23−concentration and pCO2 thresholds
K. K. Yates and R. B. Halley
Title Page
Abstract Introduction
Conclusions References
Tables Figures
◭ ◮
◭ ◮
Back Close
Full Screen / Esc
Print Version
Interactive Discussion
EGU Throughout the duration of 24 h time periods, ambient seawater was measured, in
situ, for salinity, temperature, and pH every 4 h using Orion conductivity (±0.1 psu) and temperature (±0.1◦C) probes, and an Orion Ross pH electrode (±0.005 pH unit). Water samples for total alkalinity analyses were collected concurrently with salinity, tempera-ture, and pH measurements using a peristaltic pump connected to a 145 mm filtration 5
apparatus. Five hundred milliliter water samples were pressure filtered (0.45µm cel-lulose nitrate filters), prepared, and stored using the same technique as described for incubation chamber water samples. Analytical measurements and water samples were collected within the upper 0.5 m of the water column.
Total alkalinity was measured on water samples collected in 2000 and 2001 by Gran 10
titration using the automated titration system, methods, and equations described in de-tail in Millero et al. (1993) and Yates and Halley (2006). Standardized (∼0.25 M) HCl used for titrations and standardized reference materials (SRM’s) used to determine the reliability of alkalinity measurements were provided by Dr. Frank Millero (University of Miami, Rosenstiel School of Marine and Atmospheric Science). SRM’s and replicate 15
measurements were performed approximately once every ten samples. Measurement of 12 sets of replicate seawater samples yielded average precision of 0.9µmol kg−1. While precision of repeated measurements was good, a large discrepancy was ob-served between our measured SRM values (Batch #4, 2354.0µmol kg−1; Batch #5, 2355.0µmol kg−1; and Batch #6, 2401.0µmol kg−1) and reported values for SRMs 20
(Batch #4, 2359.0µmol kg−1; Batch #5, 2347.0µmol kg−1; and Batch #6, 2357.0µmol kg−1) resulting in differences between measured and reported values of 5µmol kg−1for Batch #4 (n=6), 8µmol kg−1for Batch #5 (n=4), and 44µmol kg−1for Batch #6 (n=3). Correction factors were determined from the measured and reported SRM values and used to correct TA measurements.
25
BGD
3, 123–154, 2006CO23−concentration and pCO2 thresholds
K. K. Yates and R. B. Halley
Title Page
Abstract Introduction
Conclusions References
Tables Figures
◭ ◮
◭ ◮
Back Close
Full Screen / Esc
Print Version
Interactive Discussion
EGU (CRM) from the laboratory of Dr. Andrew Dickson (Scripps Institution of
Oceanogra-phy), see Dickson et al. (2003). Measurement of 4 sets of replicate seawater samples yielded average precision of 0.4µmol kg−1. Measurement of CRMs from Batch #59 (n=6) yielded a value of 2220.0µmol kg−1 which was only 1.0µmol kg−1 lower than the reported value for Batch #59 of 2221.0µmol kg−1.
5
The method of measuring carbonate sediment production and dissolution used in this study, known as the alkalinity anomaly technique (Smith and Key, 1975), provides a measure of net carbonate sediment production defined as gross carbonate production minus dissolution of carbonate sediments. Rates of net calcification and dissolution (G) in the incubation chamber were calculated for each 4-h interval between total alkalinity 10
measurements during chamber incubation periods using the equation from Yates and Halley (2003):
G (g CaCO3m−24 h−1)
=1
2∆TA (mol m
−24 h−1)
×SHARQ volume (m3)/SHARQ surface area (m2)
×molecular weight of CaCO3(g mol− 1
). (1)
15
Carbonate system parameters, including TCO2, CO23− concentration, pCO2, and satu-ration state of calcite (ΩC) and aragonite (ΩA), were calculated using CO2SYS (Lewis and Wallace, 1998) for both incubation chamber and ambient seawater data sets. Dis-sociation constants K1 and K2 were from Merbach et al. (1973) refit by Dickson and Millero (1987), and KSO4 was from Dickson (1990). Total alkalinity values and corre-20
sponding in situ pH, salinity, and temperature measurements were used to derive the remaining carbonate system parameters.
3. Results
BGD
3, 123–154, 2006CO23−concentration and pCO2 thresholds
K. K. Yates and R. B. Halley
Title Page
Abstract Introduction
Conclusions References
Tables Figures
◭ ◮
◭ ◮
Back Close
Full Screen / Esc
Print Version
Interactive Discussion
EGU denoted by negative numbers. Carbonate system and physical parameters for both
incubation chamber and ambient seawater measurements are listed in Tables 1 and 2. Note that ambient seawater measurements were only collected concurrently with incubation chamber measurements for the 2001 data sets. Rates of net calcification for 4 h measurement periods ranged from 0.010 to 0.930 g CaCO23− m−2 4 h−1, and 5
rates of dissolution ranged from−0.020 to−1.330 g CaCO23−m
−2
4 h−1. Rates of net calcification and dissolution calculated over the duration of daylight and night hours are available in Yates and Halley (2003) for data sets collected during 2000. Net dissolution was observed for all substrate types primarily during the night in both 2000 and 2001 data sets. Highest rates of calcification were observed during the day for a patch reef 10
with 20% live coral cover measured during February of 2000. While the highest rate of dissolution for a single 4 h period of time was observed for sand bottom substrate measured in July of 2001, the patch reef with 20% live coral cover showed highest rates of dissolution, in general, during the night.
Incubation chamber pH ranged from 7.72 to 8.22, and ambient seawater pH ranged 15
from 7.82 to 8.42 for all measurements. Incubation chamber pCO2ranged from 303 to
1229µatm, and CO23− concentrations ranged from 92 to 226µmol kg−1(Table 1). Am-bient seawater pCO2ranged from 170 to 935µatm, and CO2−
3 concentrations ranged
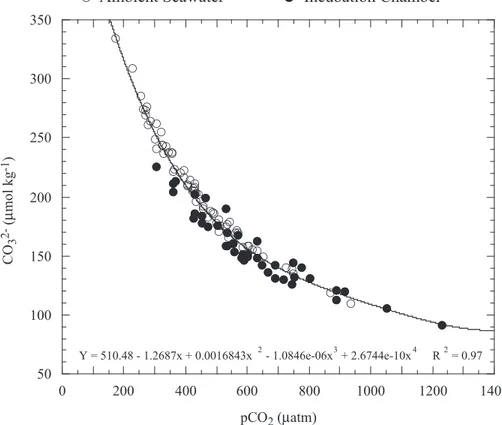
from 110 to 335µmol kg−1 (Table 2). Carbonate ion concentrations and pCO2 for 41
out of 43 four-hour incubation chamber measurements were within the range of CO23− 20
concentrations and pCO2observed for ambient seawater (Fig. 2). Two data points col-lected during 28 through 29 July 2001 on the patch reef with 10% live coral cover had pCO2measurements higher than (and CO
2−
3 measurements lower than) the observed
range of values for ambient seawater (Fig. 2). These same two data points also had slightly lower pH than that observed in ambient seawater.
25
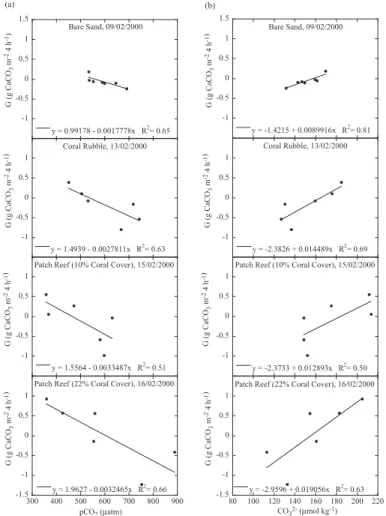
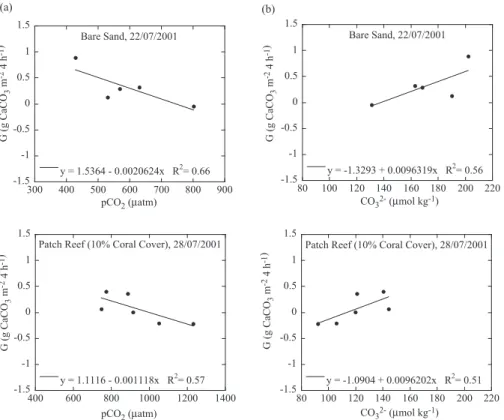
Linear correlations were calculated between calcification rate and pCO2, and
calci-BGD
3, 123–154, 2006CO23−concentration and pCO2 thresholds
K. K. Yates and R. B. Halley
Title Page
Abstract Introduction
Conclusions References
Tables Figures
◭ ◮
◭ ◮
Back Close
Full Screen / Esc
Print Version
Interactive Discussion
EGU fication to net dissolution and the pCO2and CO
2−
3 values at which rates of calcification
and dissolution are equivalent such that the ratio of calcification to dissolution equals one (C/D=1). We refer to the pCO2and CO2−
3 concentrations at the point where C/D=1
as threshold values denoted as pCO2,C/D=1and CO 2−
3,C/D=1. Net dissolution occurred
when pCO2 exceeded pCO2,C/D=1, or when CO2−
3 fell below CO 2−
3,C/D=1. Threshold 5
pCO2,C/D=1 and CO23−
,C/D=1 values for each substrate type are listed in Table 3. All
CO23−
,C/D=1 and pCO2,C/D=1 values were within the range of CO 2−
3 and pCO2 values
measured in ambient seawater with the exception of the patch reef measured in 2001. CO2−
3,C/D=1and pCO2,C/D=1varied considerably among substrate types and between
years of data collection (Table 3). The average CO23−
,C/D=1 for all substrate types 10
was 152±24µmol kg−1, and the range was from 113 to 184µmol kg−1. The aver-age pCO2,C/D=1 was 654±195µatm, ranging from 467 to 1003µatm. The highest CO23−
,C/D=1 and lowest pCO2,C/D=1 values corresponded to a patch reef with 10% live
coral cover that was measured in February of 2000. However, a similar patch reef with 10% live coral cover measured in July of 2001 exhibited the lowest CO23−,C/D
=1
15
and highest pCO2,C/D=1suggesting that considerable seasonal variability in
calcifica-tion and dissolucalcifica-tion thresholds may exist. Insufficient data is available at this time to quantify seasonal or interannual variation in CO23−,C/D
=1and pCO2,C/D=1.
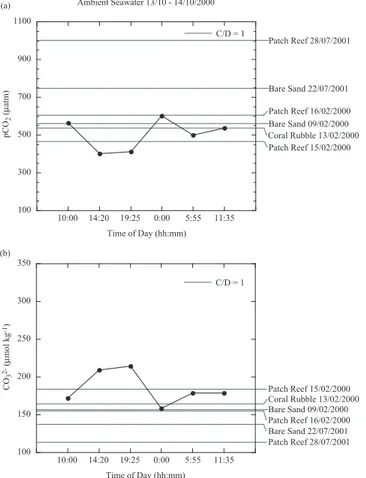
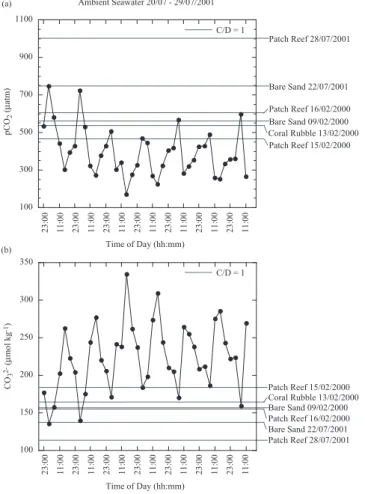
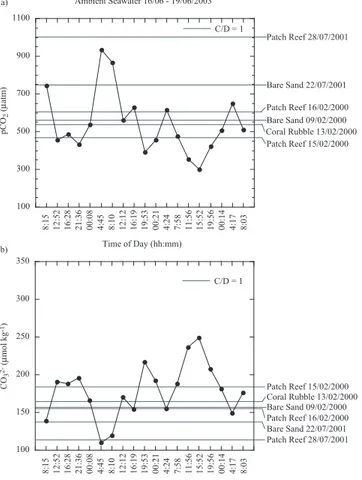
Figures 5, 6, and 7 show the diurnal variation in ambient seawater pCO2 and CO2−
3
concentrations measured during October of 2000, July of 2001, and June of 2003, re-20
spectively, and the threshold values for pCO2,C/D=1 and CO 2−
3,C/D=1 for each substrate
type. In general, ambient seawater pCO2decreased during the day and increased dur-ing the night, while CO2−
3 increased during the day, and decreased during the night. We
have estimated the percentage of time that pCO2 and CO 2−
3 concentrations in
ambi-ent seawater data sets naturally surpassed the pCO2,C/D=1and CO 2−
BGD
3, 123–154, 2006CO23−concentration and pCO2 thresholds
K. K. Yates and R. B. Halley
Title Page
Abstract Introduction
Conclusions References
Tables Figures
◭ ◮
◭ ◮
Back Close
Full Screen / Esc
Print Version
Interactive Discussion
EGU for calcification and dissolution calculated from incubation chamber measurements
for each substrate type (Figs. 5, 6, and 7, and Table 3). The percent of time dur-ing which pCO2,C/D=1 and CO
2−
3,C/D=1 were simultaneously surpassed during ambient
seawater measurements in October 2000, July 2001, and June 2003 ranged from 0 to 59% with an average of 13.2±18%. Note, however, that these estimates have a
5
high degree of error that is difficult to quantify because ambient seawater and incuba-tion chamber measurements were not collected concurrently for two of the three data sets, pCO2,C/D=1and CO2−
3,C/D=1 varies considerably among substrate types, and it is
likely that pCO2,C/D=1and CO 2−
3,C/D=1varies at each location on, at least, seasonal time
scales. These estimates are a first approximation to indicate the potential amount of 10
time that dissolution may be occurring in the ambient reef flat environment at present day atmospheric pCO2 conditions. The accuracy of such estimates will improve as
additional in situ measurements of threshold conditions for calcification and dissolution are acquired, and seasonal variation is characterized.
4. Discussion
15
Orr et al. (2005) report that tropical and subtropical seawater will become under-saturated with respect to carbonate minerals when pCO2reaches 1700 and 2800µatm,
respectively. However, we observed net dissolution rates of carbonate sediments dur-ing the night that exceeded net calcification durdur-ing the day on representative substrate types of the Molokai reef flat at pCO2 and CO
2−
3 values that were within the range of 20
those measured in ambient seawater at present day atmospheric pCO2 conditions of
380 ppmv (Houghton, 2001). Our results and results of other researchers (Conand et al., 1997; Gattuso et al., 1997; Boucher et al., 1998) indicate that a considerable amount of dissolution is already naturally occurring in shallow waters of reef envi-ronments. Our night-time dissolution rates (calculated per hour, −0.005 to −0.33 g
25
CaCO2−
3 m
−2
h−1
BGD
3, 123–154, 2006CO23−concentration and pCO2 thresholds
K. K. Yates and R. B. Halley
Title Page
Abstract Introduction
Conclusions References
Tables Figures
◭ ◮
◭ ◮
Back Close
Full Screen / Esc
Print Version
Interactive Discussion
EGU Gattuso et al. (1997) measured community metabolism on a fringing reef at Moorea
(French Polynesia) over 24 h time periods. Community net calcification showed a strong diurnal pattern with net calcification occurring during the day (1.24 g CaCO3
m−2) and net dissolution occurring during the night (
−1.33 g CaCO3 m− 2
, or approxi-mately−0.11 g CaCO3m−
2
h−1) resulting in dissolution of−0.09 g CaCO3m− 2
24 h−1. 5
The saturation state of surface water ranged from 2.84 to 4.38 and dissolution was attributed to lower saturation state in pore waters of the sediment due to release of respiratory CO2, and possibly due to boring sponges. Boucher et al. (1998) measured
the contribution of soft bottoms to productivity and calcification on the Tiahura barrier reef of Moorea, French Polynesia. They observed dissolution at night that exceeded 10
calcification during the day resulting in slight net dissolution of −0.24 g CaCO3 m− 2
d−1and mean night dissolution rates of−0.06 to−0.07 g CaCO3m− 2
h−1. Conand et al. (1997) reported night-time dissolution rates during the summer on the back reef of Reunion Island in the Indian Ocean of up to−2.5 g CaCO3m−
2
h−1that resulted in net dissolution of−9 g CaCO3 m−
2
d−1. Earlier studies (Kinsey, 1978; Barnes and Dev-15
ereux, 1984) observed higher night-time dissolution rates of−0.1 to−0.4 g CaCO3m− 2
h−1on One Tree Island Reef (Kinsey, 1978), and approximately−0.8 g CaCO3m− 2
h−1 on the Rib Reef (Barnes and Devereux, 1984) of the Great Barrier Reef in Australia, however day-time calcification exceeded night-time dissolution in these studies.
Moderate correlation of our calcification and dissolution rates with surface water 20
pCO2and CO2−
3 (r
2
from 0.50 to 0.81) and diurnal variation in calcification and dissolu-tion corresponding to day and night, respectively, suggests that variadissolu-tion in carbonate system parameters as a result of photosynthesis and respiration on the shallow reef flat may facilitate calcification and dissolution (Schmalz and Swanson, 1969; Yates and Halley, 2006). Leclercq et al. (2002) measured dark dissolution of−0.081 to−0.048 g
25
CaCO3 m− 2
h−1 in a coral reef mesocosm with pCO2 manipulated to 411, 647, and
BGD
3, 123–154, 2006CO23−concentration and pCO2 thresholds
K. K. Yates and R. B. Halley
Title Page
Abstract Introduction
Conclusions References
Tables Figures
◭ ◮
◭ ◮
Back Close
Full Screen / Esc
Print Version
Interactive Discussion
EGU saturation state existed at night suggesting that night dissolution was not correlated
with saturation state, rather it was a function of the interstitial aragonite saturation state due to low pH and elevated CO2 from bacterial respiration in sediments. This is
con-trary to our observations of a linear correlation between calcification and dissolution on sand communities relative to surface water pCO2and CO2−
3 .
5
The fact that dissolution occurred in waters that remained supersaturated with re-spect to carbonate minerals indicates that either dissolution of magnesian carbonates (which are more soluble in seawater than calcite and aragonite) occurred, that simple carbonate thermodynamic equilibrium with respect to pCO2and carbonate ion species
was not the sole process causing dissolution, or that some combination of magnesian 10
carbonate dissolution and non-equilibrium dissolution of carbonate sediment occurred. Sabine and Mackenzie (1995) measured higher alkalinity values as a result of disso-lution of resuspended carbonate sediments in surface waters of Penguin Bank, a mid-depth bank extending 45 km southwest of the western end of Molokai with an average depth 60 m. Saturation state of Penguin Bank waters was 4.4 times oversaturated with 15
respect to aragonite, and they attributed the signature to dissolution of high-mg calcite. We calculated stoichiometric solubility products (K*sp=mCa2+ mCO23− reported as −log K*sp in Table 3) for the dissolving carbonate mineral phase at each substrate type by assuming that mineral saturation state is equal to one when the rate of calci-fication is equivalent to dissolution (C/D=1), that the Ca2+ concentration in seawater 20
was 10.3 M (Morse and Mackenzie, 1990), and by using our threshold CO2−
3,C/D=1
val-ues (Table 3). It is important to note, however, that dissolution likely began before the calcification/dissolution threshold was reached (i.e. C/D=1) because we measured net calcification resulting from the combined processes of calcium carbonate precipitation and dissolution. Therefore, our−log K*sp calculations most likely represent maximum
25
BGD
3, 123–154, 2006CO23−concentration and pCO2 thresholds
K. K. Yates and R. B. Halley
Title Page
Abstract Introduction
Conclusions References
Tables Figures
◭ ◮
◭ ◮
Back Close
Full Screen / Esc
Print Version
Interactive Discussion
EGU correspond to−log K*sp of 6.18 and 6.37, respectively. Stumm and Morgan (1981)
report K*sp for aragonite and calcite in seawater of 6.05 and 6.20, respectively. Our −log K*sp values were lower than those reported for aragonite in seawater suggesting that dissolution of magnesian calcite occurred.
Solubility of magnesian calcites in seawater is poorly understood (Sabine and 5
Mackenzie, 1995). Busenberg and Plummer (1989) performed one of the most com-prehensive studies of magnesian calcite dissolution and report−log K*sp values for biogenic magnesian calcites ranging from 19 to 0.8 mol% MgCO3 content of 8.16 to
8.46, respectively. Mackenzie et al. (1983) provide a review of experimentally deter-mined magnesian calcite solubilities with lowest−log K*sp values from Plummer and
10
Mackenzie (1974) of approximately 7.20 for magnesian calcite with 23 mol% MgCO3. However, all of these measurements were made in distilled water. Only a few values of −log K*sp have been calculated from dissolution studies on biogenic magnesian calcites in seawater (Chave and Schmalz, 1966; Land, 1967; Weyl, 1967), and these range from approximately 8.05 to 8.62 (Mackenzie et al., 1983). However, these re-15
ported values of−log K*sp for magnesian calcites in seawater are greater than −log K*sp for calcite and aragonite in seawater (Mucci, 1983; Stumm and Morgan, 1981), and higher than values reported for magnesian calcite dissolution in distilled water (Plummer and Mackenzie, 1974). Thus, reported K*sp values for magnesian calcites remain contradictory. Our estimates of −log K*sp indicate that magnesian calcites
20
in natural systems are much more soluble than previously determined, or that non-equilibrium processes are facilitating mineral dissolution.
Other processes that may contribute to dissolution include bioerosion from endolithic microbes and boring foraminifera (Lazar, 1991; Peyrot-Clausade, 1995; Peyre’-Venec, 1987), under-saturated pore water conditions in the sediment due to bacterial respira-25
BGD
3, 123–154, 2006CO23−concentration and pCO2 thresholds
K. K. Yates and R. B. Halley
Title Page
Abstract Introduction
Conclusions References
Tables Figures
◭ ◮
◭ ◮
Back Close
Full Screen / Esc
Print Version
Interactive Discussion
EGU place in sediment pore waters, advection and diffusion can transfer alkalinity across
the sediment water interface imparting a chemical signature to surface water (Walter et al., 1993). It is likely that the calcification/dissolution signatures that we observed result from a combination of high-mg calcite dissolution and other sediment pore water processes.
5
It is predicted that atmospheric pCO2 will reach 560µatm by 2065, and 700µatm
by 2100 (Houghton et al., 1996) surpassing the average pCO2 threshold value of
654µatm that we calculated for our study sites on the Molokai reef flat. At present day atmospheric pCO2 of 380 ppmv, ambient seawater pCO2 on the Molokai reef flat
ranged from 170 to 935µatm, and individual pCO2 threshold values for all substrate 10
types (ranging from 467 to 1003µatm) were exceeded, on average, 18% of the time during measurement of ambient seawater chemistry. Ambient seawater pCO2
mea-surements were higher than atmospheric pCO2(380 ppmv) 66% of the time. Our linear
correlation between calcification/dissolution rates and pCO2, and our calculated pCO2 threshold values suggest that not only will rates of dissolution increase with increasing 15
pCO2, but the amount of time that pCO2threshold values for dissolution are exceeded
will increase resulting in considerable loss of carbonate sediments on reefs.
While insufficient data exists to fully characterize spatial and temporal trends in threshold values for pCO2 and CO
2−
3 , our data indicate that these values vary
con-siderably among substrate types, and on similar substrate types during different time 20
periods. There are many potential causes of variability in threshold pCO2 and CO 2−
3
values that remain to be quantified. These causes include variation in metabolic per-formance due to community composition (Gattuso et al., 1997), seasonal variation in calcification and dissolution rates, variation in sediment composition, degree of biologic control on calcification and dissolution mechanisms, and mixing rate of water masses 25
BGD
3, 123–154, 2006CO23−concentration and pCO2 thresholds
K. K. Yates and R. B. Halley
Title Page
Abstract Introduction
Conclusions References
Tables Figures
◭ ◮
◭ ◮
Back Close
Full Screen / Esc
Print Version
Interactive Discussion
EGU atmospheric pCO2levels.
Acknowledgements. This study was funded by the Coastal and Marine Geology Program of the U.S. Geological Survey. We extend our sincere gratitude to C. Dufore, N. Smiley, and P. Thompson for technical assistance during field excursions and laboratory analyses. We thank P. Chavez and J. Isbrecht of the U.S. Geological Survey, Southwest Geographic Science
5
Team for Landsat TM satellite images of Molokai. We gratefully acknowledge X. Liu, F. Millero, and R. Byrne for their instruction on preparation of automated Gran titration and spectropho-tometric instrumentation and methodologies. We would also like to thank S. Kahue, R. Moran, and the staffof the Molokai Hotel for logistical support during field expeditions.
References
10
Agegian, C. R.: The biogeochemical ecology ofPorolithon gardineri (Foslie), PhD thesis, Uni-versity of Hawaii, 178 pp., 1985.
Andersson, A. J., Mackenzie, F. T., and Ver, L. M.: Solution of shallow-water carbonates: an insignificant buffer against rising atmospheric CO2, Geology, 31, 513–516, 2003.
Atkinson, M. J. and Grigg, R. W.: Model of a coral reef ecosystem II: gross and net benthic
15
primary production at French Frigate Shoals, Hawaii, Coral Reefs, 3, 13–22, 1984.
Barnes, D. J. and Cuff, C.: Solution of reef rock buffers seawater against rising atmospheric CO2, in: Proc. 9th Int. Coral Reef Sym. Abstracts: Indonesia, State Ministry for the Environ-ment, edited by: Hopley, D., Hopley, P., Tamelander, J., and Done, T., 248 p., 2000.
Barnes, D. J. and Devereux, M. J.: Productivity and calcification on a coral reef: a survey using
20
pH and oxygen electrode techniques, J. Exp. Mar. Biol. Ecol., 79, 213–231, 1984.
Borowitzka, M. A.: Photosynthesis and calcification in the articulated coralline red algae Am-phiroa ancepsandA. foliacea, Mar. Biol., 62, 17–23, 1981.
Boucher, G., Clavier, J., Hily, C., and Gattuso, J.-P.: Contribution of soft-bottoms to the commu-nity metabolism (primary production and calcification) of a barrier reef flat (Moorea, French
25
Polynesia), J. Exp. Mar. Biol. Ecol., 225, 269–283, 1998.
Busenberg, E. and Plummer, L. N.: Thermodynamics of magnesian calcite solid-solutions at 25◦C and 1 atm total pressure, Geochim. Cosmochim. Acta, 53, 1189–1208, 1989.
sedi-BGD
3, 123–154, 2006CO23−concentration and pCO2 thresholds
K. K. Yates and R. B. Halley
Title Page
Abstract Introduction
Conclusions References
Tables Figures
◭ ◮
◭ ◮
Back Close
Full Screen / Esc
Print Version
Interactive Discussion
EGU
ment water interface and organic matter mineralization in an atoll lagoon (Tikehau, Tuamotu Archipelago, French Polynesia), Mar. Ecol. Prog. Ser., 132, 181–190, 1996.
Chave, K. E. and Schmalz, R. F.: Carbonate-seawater interactions, Geochim. Cosmochim. Acta, 30, 1037–1048, 1966.
Conand, C., Chabanet, P., Cuet, P., and Letourneur, Y.: The carbonate budget of a fringing reef
5
in La Reunion Island (Indian Ocean): sea urchin and fish bioerosion and net calcification, Proc. 8th Int. Coral Reef Sym., 953–958, 1997.
Dickson, A. G.: Standard potential of the reaction: AgCl(s)+12H2(g)=Ag(s)+HCl(aq), and the
standard acidity constant of the ion HSO4- in synthetic seawater from 273.15 to 318.15 K, J. Chem. Thermodyn., 22, 113–127, 1990.
10
Dickson, A. G. and Millero, F. J.: A comparison of the equilibrium constants for the dissociation of carbonic acid in seawater media, Deep-Sea Res., 34, 1733–1743, 1987.
Feely, R. A., Byrne, R. H., Betzer, P. R. Gendron, J. F., and Acker, J. G.: Factors influencing the degree of saturation of the surface and intermediate waters of the North Pacific Ocean with respect to aragonite, J. Geophys. Res., 89, 10 631–10 640, 1984.
15
Gao, K., Aruga, Y., Asada, K., Ishihara, T., Akano, T., and Kiyohara, M.: Calcification in the articulated coralline algaCorallina pilulifera, with special reference to the effect of elevated CO2concentration, Mar. Biol., 117, 129–132, 1993.
Gattuso, J.-P., Pichon, M., Delesalle, B., and Frankignoulle, M.: Community metabolism and air-sea CO2fluxes in a coral reef ecosystem (Moorea, French Polynesia), Mar. Ecol. Prog.
20
Ser., 96, 259–267, 1993.
Gattuso, J.-P., Frankignoulle, M., Ware, J. R., Smith, S. V., Wollast, R., Buddemeier, R. W., and Kayanne, H.: Coral Reefs and Carbon Dioxide, Science, 271, 1298–1300, 1996.
Gattuso, J.-P., Payri, C. E., Pichon, M., Delesalle, B., and Frankignoulle, M.: Primary produc-tion, calcificaproduc-tion, and air-sea CO2 fluxes of a macroalgal-dominated coral reef community
25
(Moorea, French Polynesia), J. Phycol., 33, 729–738, 1997.
Gattuso, J.-P., Frankignoulle, M., Bourge, I., Romaine, S., and Buddemeier, R. W.: Effect of calcium carbonate saturation of seawater on coral calcification, Global Planet. Change, 18, 37–46, 1998.
Gattuso, J.-P., Allemand, D., and Frankignoulle, M.: Photosynthesis and calcification at cellular,
30
organismal and community levels in coral reefs: a review on interactions and control by carbonate chemistry, Am. Zool., 39, 160–183, 1999.
BGD
3, 123–154, 2006CO23−concentration and pCO2 thresholds
K. K. Yates and R. B. Halley
Title Page
Abstract Introduction
Conclusions References
Tables Figures
◭ ◮
◭ ◮
Back Close
Full Screen / Esc
Print Version
Interactive Discussion
EGU
Proc. 9th Int. Coral Reef Sym., Abstracts: Indonesia, State Ministry for the Environment, 2000.
Houghton, J. T., Meira Filho, L. G., Callander, B. A., Harris, N., Kattenberg, A., and Maskell, K.: Climate change 1995, The Science of Climate Change, Cambridge University Press, Cambridge, 1996.
5
Keeling, C. D. and Whorf, T. P.: Trends Online: a compendium of data on global change, Carbon Dioxide Analysis Center, Oak Ridge National Laboratory, http://cdiac.esd.ornl.gov/ ftp/ndp001r7/, 2004.
Kinsey, D. W.: Preliminary observations on community metabolism and primary productivity of the pseudo-atoll reef at One Tree Island, Great Barrier Reef, in: Proc. Symp. Corals and
10
Coral Reefs, Mar. Biol. Assoc. India, 13–22, 1972.
Kinsey, D. W.: Productivity and calcification estimates using slack-water periods and field en-closures, in: Coral Reefs: Research Methods, edited by: Stoddart, D. R. and Johannes, R. E., UNESCO, Monographs on Oceanographic Methodology, 5, 439–468, 1978.
Kinsey, D. W.: Carbon turnover and accumulation by coral reefs, PhD dissertation, University
15
of Hawaii, Honolulu, 248 pp., 1979.
Kinsey, D. W.: Metabolism, calcification, and carbon production: system level studies, in: Pro-ceedings 5th Int. Coral Reef Congress, Tahiti, 4, 505–526, 1985.
Kleypas, J. A., Buddemeier, R. W., Archer, D., Gattuso, J.-P., Langdon, C., and Opdyke, B. N.: Geochemical consequences of increased atmospheric CO2on coral reefs, Science, 284,
20
118–120, 1999.
Kleypas, J. A., Buddemeier, R. W., and Gattuso, J.-P.: The future of coral reefs in an age of global change, Int. J. Earth Sci., 90, 426–437, 2001.
Land, L. S.: Diagenesis of skeletal carbonates, J. Sed. Petrol., 37, 914–930, 1967.
Langdon, C., Takahashi, T., McConnaughey, T., Anderson, H., and West, H.: Effect of calcium
25
carbonate saturation state on the rate of calcification of an experimental coral reef, Am. Zool., 37, abstract #254, 1998.
Langdon, C., Takahashi, T., Sweeney, C., Chipman, D., Goddard, J., Marubini, F., Aceves, H., Barnett, H., and Atkinson, M. J.: Effect of calcium carbonate saturation state on the calcification rate of an experimental coral reef, Global Biogeochem. Cycles, 14, 639–654,
30
2000.
BGD
3, 123–154, 2006CO23−concentration and pCO2 thresholds
K. K. Yates and R. B. Halley
Title Page
Abstract Introduction
Conclusions References
Tables Figures
◭ ◮
◭ ◮
Back Close
Full Screen / Esc
Print Version
Interactive Discussion
EGU
enrichment, J. Geophys. Res.-Oceans, 110, C09S07, doi:10.1029/2004JC002576, 2005. Lazar, B.: Bioerosion of coral reefs: a chemical approach, Limnol. Oceanogr., 36, 377–383,
1991.
Leclercq, N., Gattuso, J.-P., and Jaubert, J.: CO2partial pressure controls the calcification rate of a coral community, Global Change Biol., 6, 329–334, 2000.
5
Leclercq, N., Gattuso, J.-P., and Jaubert, J.: Primary production, respiration, and calcification of a coral reef mesocosm under increased CO2 partial pressure, Limnol. Oceanogr., 47, 558–564 2002.
Lewis, E. and Wallace, D. W. R.: Program developed for CO2 system calculations, ORNL/CDIAC-105, Carbon dioxide information analysis center, Oak Ridge National
Labo-10
ratory, U.S. Department of Energy, Oak Ridge Tennessee, 1998.
Mackenzie, F. T., Bischoff, W. D., Bishop, F. C., Loijens, M., Schoonmaker, J., and Wollast, R.: Magnesian calcites: low-temperature occurrence, solubility and solid-solution behavior, in: Reviews in Mineraology 11, Carbonates: Mineralogy and Chemistry, edited by: Reeder, R. J., 97–144, 1983.
15
Mackenzie, F. T. and Agegian, C. R.: Biomineralization and tentative links to plate tectonics, in: Origin, Evolution, and Modern Aspects of Biomineralization in Plants and Animals, edited by: Crick, R.E., Plenum Press, New York, 11–27, 1989.
Mackenzie, F. T., Ver, L. M., and Lerman, A.: Coastal zone biogeochemical dynamics under global warming, Int. Geol. Rev., 42, 193–206, 2000.
20
Marubini, F. and Atkinson, M.: Effect of lowered pH and elevated nitrate on coral Calcification, Mar. Ecol. Prog. Ser., 188, 117–121, 1999.
Marubini, F. and Thake, B.: Bicarbonate addition promotes coral growth, Limnol. Oceanogr., 44, 716–720, 1999.
Marubini, F., Ferrier-Pages, C., and Cuif, J. P.: Suppression of skeletal growth in scleractinian
25
corals by decreasing ambient carbonate-ion concentration: a cross-family comparison, Proc. Roy. Soc. London, Ser. B, 270, 179–184, 2003.
McNeil, B., Matear, R., and Barnes, D.: Coral reef calcification and climate change: the effect of ocean warming, Geophys. Res. Lett., 31, L2239, doi:10.1029/2004GL021541, 2004. Merbach, C., Culberson, C. H., Hawley, J. E., and Pytkowicz, R. M.: Measurement of the
ap-30
parent dissociation constants of carbonic acid in seawater at atmospheric pressure, Limnol. Oceanogr., 18, 897–907, 1973.
BGD
3, 123–154, 2006CO23−concentration and pCO2 thresholds
K. K. Yates and R. B. Halley
Title Page
Abstract Introduction
Conclusions References
Tables Figures
◭ ◮
◭ ◮
Back Close
Full Screen / Esc
Print Version
Interactive Discussion
EGU
Millero, F. J., Zhang, J., Lee, K., and Campbell, D. M.: Titration alkalinity of seawater, Mar. Chem., 44, 153–165, 1993.
Morse, J. W. and Mackenzie, F. T.: Geochemistry of Sedimentary Carbonates, Elsevier Science Publishing Company Inc., New York, 707 p., 1990.
Mucci, A.: The solubility of calcite and aragonite in seawater at various salinities, temperatures,
5
and one atmosphere total pressure, Amer. J. Sci., 283, 780–799, 1983.
Orr, J. C., Fabry, V. J., Aumont, O., et al.: Anthropogenic ocean acidification over the twenty-first century and its impact on calcifying organisms, Nature, 437, 681–686, 2005.
Pelejero, C., Calvo, E., McCullouch, M., Marshall, J., Gagan, M., Lough, J., and Opdyke, B.: Preindustrial to modern interdecadal variability in coral reef pH, Science, 309, 2204–2207,
10
2005.
Peyrot-Clausade, M., Le Campion-Alsumard, T., Hutchings, P., Le Campion, J., Payri, C., and Fontaine, M. C.: Initial bioerosion and bioaccretion on experimental substrates in high island and atoll lagoons (French Polynesia), Oceanol. Acta, 18, 531–541, 1995.
Peyre’-Venec, M. T.: Boring foraminifera in French Polynesia, Coral Reefs, 11, 205–212, 1987.
15
Plummer, L. N. and Mackenzie, F. T.: Predicting mineral solubility from rate data: application to the magnesian calcites, Amer. Jour. Sci., 274, 61–83, 1974.
Sabine, C. L. and Mackenzie, F. T.: Bank-derived carbonate sediment transport and dissolution in the Hawaiian Archipelago, Aquat. Geochem., 1, 189–230, 1995.
Schmalz, R. F. and Swanson, F. J.: Diurnal variations in the carbonate saturation of seawater,
20
J. Sed. Petrol., 39, 255–267, 1969.
Smith, S. V.: Carbon dioxide dynamics: a record of organic carbon production, respiration, and calcification in the Eniwetok reef flat community, Limnol. Oceanogr., 18, 106–120, 1973. Smith, S. V.: The Houtman Abrolhos Islands: carbon metabolism of coral reefs at high latitude,
Limnol. Oceanogr., 26, 612–621, 1981.
25
Smith, S. V. and Key, G. S.: Carbon dioxide and metabolism in marine environments, Limnol. Oceanogr., 20, 493–495, 1975.
Smith, S. V. and Kinsey, D. W.: Calcium carbonate production, coral reef growth, and sea level change, Science, 194, 937–939, 1976.
Smith, S. V., Chandra, S., Kwitko, L., Schneider, R. C., Schoonmaker, J., Seeto, J., Tebano,
30
BGD
3, 123–154, 2006CO23−concentration and pCO2 thresholds
K. K. Yates and R. B. Halley
Title Page
Abstract Introduction
Conclusions References
Tables Figures
◭ ◮
◭ ◮
Back Close
Full Screen / Esc
Print Version
Interactive Discussion
EGU
Stumm, W. and Morgan, M. J.: Aquatic Chemistry, J. Wiley and Sons, Inc., New York, 1981. Walter, L., Bischof, S. A., Patterson, W. P., and Lyons, T. W.: Dissolution and recrystallization
in modern shelf carbonates: evidence from pore water and solid phase chemistry, Philos. Trans. R. Soc. Lond., Ser. A, 344, 203–215, 1993.
Weyl, P. K.: The solution behavior of carbonate minerals in sea water, Int. Conf. Tropical
5
Oceanography, Univ. Miami, Miami, Florida, 178–228, 1967.
Yao, W. and Byrne, R. H.: Simplified seawater alkalinity analysis: use of linear array spectrom-eters, Deep-Sea Res. I, 45, 1383–1392, 1998.
Yates, K. K. and Halley, R. B.: Measuring coral reef community metabolism using new benthic chamber technology, Coral Reefs, 22, 247–255, 2003.
10
BGD
3, 123–154, 2006CO23−concentration and pCO2 thresholds
K. K. Yates and R. B. Halley
Title Page
Abstract Introduction
Conclusions References
Tables Figures
◭ ◮
◭ ◮
Back Close
Full Screen / Esc
Print Version
Interactive Discussion
EGU
Table 1.Carbonate system parameters for incubation chamber measurements.
Description Time Salinity Temp. TA pH G TCO2 CO
2−
3 pCO2 ΩC ΩA
(hh:mm) (◦C) (µmol kg−1
) (g CaCO3m− 2
4 h−1
) (µmol kg−1
) (µmol kg−1 ) (µatm)
Sand Bottom 19:00 33.7 24.7 2217 8.11 – 1956 186 429 4.5 3.0
9/2–10/2/2000 23:00 33.7 24.4 2218 8.03 −0.020 2000 159 535 3.9 2.5
3:00 33.7 23.8 2222 8.00 −0.080 2025 147 589 3.6 2.3
7:00 33.7 23.6 2236 7.94 −0.240 2066 131 690 3.2 2.1
11:00 33.7 24.2 2243 8.00 −0.110 2043 149 598 3.6 2.4
15:00 33.7 26.1 2232 8.04 0.190 1999 170 533 4.1 2.7
19:00 33.7 25.1 2235 8.03 −0.060 2016 161 551 3.9 2.6
23:00 33.7 24.5 2241 7.97 −0.100 2053 142 645 3.5 2.3
Coral Rubble 13:00 34.2 26.0 2166 8.00 – 1958 152 583 3.7 2.4
13/2–14/2/2000 17:00 34.2 27.4 2142 8.09 0.390 1881 185 450 4.5 3.0
21:00 34.2 25.9 2147 8.03 −0.080 1926 159 530 3.9 2.5
1:00 34.2 24.9 2195 7.95 −0.800 2013 137 666 3.3 2.2
5:00 34.2 24.2 2227 7.91 −0.530 2063 127 742 3.1 2.0
9:00 34.2 24.0 2236 7.92 −0.160 2067 130 717 3.1 2.1
13:00 34.2 25.8 2230 8.06 0.110 1987 176 503 4.3 2.8
Patch Reef (10% 9:30 35.0 24.9 2177 8.09 – 1926 178 452 4.3 2.8
Coral Cover) 13:30 35.0 26.7 2145 8.17 0.550 1839 212 357 5.1 3.4
15/2–16/2/2000 17:30 35.0 27.8 2141 8.16 0.060 1833 214 367 5.2 3.4
21:30 35.0 26.7 2125 8.07 0.270 1877 175 472 4.2 2.8
1:30 35.0 24.9 2160 7.99 −0.580 1956 148 580 3.6 2.3
5:30 35.0 24.8 2218 7.99 −0.980 2012 152 597 3.6 2.4
9:30 35.0 25.3 2221 7.97 −0.040 2020 149 631 3.6 2.4
Patch Reef (22% 14:15 35.0 24.9 2161 8.22 – 1833 226 303 5.4 3.6
Coral Cover) 18:15 35.0 26.7 2105 8.16 0.930 1808 205 358 4.9 3.3
16/2–17/2/2000 22:15 35.0 27.8 2114 8.01 −0.140 1889 161 553 3.9 2.6
3:49 35.0 26.7 2187 7.91 −1.220 2011 133 752 3.2 2.1
7:49 35.0 24.9 2211 7.84 −0.410 2071 113 888 2.7 1.8
11:49 35.0 24.8 2178 8.01 0.560 1966 154 558 3.7 2.4
2:20 35.0 25.3 2144 8.10 0.580 1883 183 426 4.4 2.9
Sand Bottom 7:00 34.3 25.0 2277 7.95 – 2088 143 688 3.5 2.3
23/7–24/7/2001 11:00 34.3 27.7 2258 7.99 0.320 2038 163 630 4.0 2.6
15:00 34.3 29.3 2250 8.06 0.130 1987 190 530 4.6 3.1
19:00 34.3 28.0 2197 8.12 0.890 1911 202 429 4.9 3.3
23:00 34.3 27.0 2276 8.10 −1.330 1999 199 462 4.8 3.2
3:00 34.3 26.3 2259 8.02 0.290 2030 168 568 4.1 2.7
7:00 34.3 26.2 2262 7.89 −0.050 2094 131 802 3.2 2.1
Patch Reef (10% 11:00 34.4 27.0 2250 8.10 – 1978 195 465 4.7 3.1
Coral Cover) 15:00 34.4 28.4 2226 7.91 0.400 2042 140 773 3.4 2.3
28/7–29/7/2001 19:00 34.4 28.6 2222 7.92 0.070 2031 144 747 3.5 2.3
23:00 34.4 27.5 2221 7.84 0.010 2071 120 914 2.9 1.9
3:00 34.4 26.6 2234 7.79 −0.210 2109 106 1050 2.6 1.7
7:00 34.4 26.0 2247 7.72 −0.220 2147 92 1229 2.2 1.5
BGD
3, 123–154, 2006CO23−concentration and pCO2 thresholds
K. K. Yates and R. B. Halley
Title Page
Abstract Introduction
Conclusions References
Tables Figures
◭ ◮
◭ ◮
Back Close
Full Screen / Esc
Print Version
Interactive Discussion
EGU
Table 2.Carbonate system parameters for ambient seawater measurements.
Date Time Salinity Temp. TA pH TCO2 CO32− pCO2 ΩC ΩA
(hh:mm) (◦C) (µmol kg−1) (µmol kg−1) (µmol kg−1) (µatm)
13/10/2000 10:00 34.1 25.8 2306 8.03 2073 172 564 4.2 2.8
14:20 33.9 26.7 2243 8.15 1949 209 403 5.1 3.4
19:25 35.6 25.9 2293 8.14 1990 214 411 5.1 3.4
14/10/2000 0:00 33.8 25.0 2292 8.00 2080 158 601 3.9 2.5
5:55 34.3 24.6 2286 8.07 2041 179 499 4.3 2.8
11:35 34.9 25.9 2298 8.05 2053 179 539 4.3 2.9
20/7/2001 23:00 33.8 26.1 2287 8.05 2046 177 535 4.3 2.8
21/7/2001 3:00 33.8 25.7 2266 7.92 2091 135 748 3.3 2.2
7:00 33.8 25.1 2255 8.01 2042 158 583 3.8 2.5
11:00 33.8 26.4 2284 8.12 2003 202 441 4.9 3.3
22/7/2001 15:00 34.3 27.4 2293 8.25 1919 263 303 6.4 4.2
19:00 34.3 26.9 2294 8.16 1981 223 393 5.4 3.6
23:00 34.3 26.3 2270 8.13 1986 204 430 5.0 3.3
23/7/2001 3:00 34.3 26.0 2259 7.93 2076 140 723 3.4 2.2
7:00 34.3 25.9 2270 8.05 2029 175 531 4.3 2.8
11:00 34.3 27.4 2242 8.22 1893 244 323 5.9 3.9
15:00 34.3 28.8 2245 8.28 1846 277 273 6.8 4.5
19:00 34.3 27.7 2223 8.16 1910 220 380 5.4 3.6
23:00 34.3 26.8 2261 8.13 1974 206 429 5.0 3.3
24/7/2001 3:00 34.3 24.0 2268 8.06 2033 171 506 4.1 2.7
7:00 34.3 24.6 2271 8.24 1927 242 304 5.8 3.9
25/7/2001 11:00 34.3 26.7 2271 8.21 1934 238 341 5.8 3.8
15:00 34.3 28.1 2204 8.43 1712 335 170 8.2 5.4
19:00 34.3 27.1 2228 8.27 1851 262 276 6.4 4.2
23:00 34.3 26.3 2247 8.22 1909 237 326 5.8 3.8
26/7/2001 3:00 34.3 25.5 2234 8.09 1979 184 469 4.5 2.9
7:00 34.3 25.7 2284 8.11 2008 198 446 4.8 3.2
11:00 34.3 26.9 2273 8.29 1881 274 269 6.6 4.4
15:00 34.1 28.7 2264 8.35 1817 309 225 7.5 5.0
19:00 34.1 27.6 2237 8.22 1889 244 323 5.9 3.9
23:00 34.1 26.9 2244 8.14 1948 210 405 5.1 3.4
27/7/2001 3:00 34.1 26.4 2257 8.13 1969 205 419 5.0 3.3
7:00 34.1 26.0 2288 8.03 2057 170 567 4.1 2.7
11:00 34.1 27.1 2268 8.27 1889 265 285 6.5 4.3
15:00 34.1 28.9 2250 8.23 1885 256 319 6.2 4.2
19:00 34.4 28.8 2236 8.19 1896 238 355 5.8 3.9
23:00 34.4 28.0 2232 8.13 1938 208 427 5.1 3.4
28/7/2001 3:00 34.4 27.2 2283 8.13 1987 212 428 5.1 3.4
7:00 34.4 26.2 2265 8.08 2008 186 490 4.5 3.0
11:00 34.4 27.0 2256 8.30 1860 275 261 6.7 4.4
15:00 34.4 28.1 2252 8.31 1839 286 253 7.0 4.6
17:00 34.4 28.2 2237 8.21 1890 243 335 5.9 3.9
23:00 34.4 27.1 2206 8.18 1889 222 359 5.4 3.6
29/7/2001 3:00 34.4 26.3 2249 8.18 1932 224 362 5.4 3.6
7:00 34.4 25.8 2252 8.00 2037 159 600 3.9 2.5
11:00 34.4 26.4 2265 8.29 1877 270 268 6.5 4.3
16/6/2003 8:15 35.8 26.4 2235 7.92 2050 139 744 3.3 2.2
12:52 35.9 27.6 2164 8.09 1892 191 457 4.6 3.0
16:28 36.1 27.1 2213 8.07 1948 188 488 4.5 3.0
21:36 36.2 26.3 2197 8.11 1917 196 433 4.7 3.1
17/6/2003 0:08 36.2 25.5 2193 8.03 1961 166 538 4.0 2.6
4:45 36.2 25.1 2206 7.82 2069 110 935 2.6 1.7
8:10 35.3 26.0 2212 7.85 2060 120 868 2.9 1.9
12:12 36.4 26.8 2214 8.02 1976 170 561 4.1 2.7
16:19 36.1 27.4 2173 7.97 1960 155 629 3.7 2.5
19:53 36.0 26.4 2246 8.15 1936 217 391 5.2 3.4
18/6/2003 0:21 36.0 25.6 2241 8.09 1969 192 456 4.6 3.0
4:24 35.3 25.2 2256 7.99 2045 156 616 3.7 2.5
7:58 35.3 25.3 2274 8.08 2012 188 477 4.5 3.0
11:56 36.0 27.1 2258 8.19 1918 237 353 5.7 3.8
15:52 35.8 27.1 2205 8.24 1842 249 301 6.0 4.0
19:56 35.9 26.4 2253 8.13 1958 208 423 5.0 3.3
19/6/2003 0:14 35.9 25.7 2252 8.06 1999 181 507 4.3 2.9
BGD
3, 123–154, 2006CO23−concentration and pCO2 thresholds
K. K. Yates and R. B. Halley
Title Page
Abstract Introduction
Conclusions References
Tables Figures
◭ ◮
◭ ◮
Back Close
Full Screen / Esc
Print Version
Interactive Discussion
EGU
Table 3. Percent of time ambient seawater CO2−
3 concentration and pCO2surpassed
thresh-olds for C/D=1.
Description CO2−
3,C/D=1 −log % time below CO 2−
3,C/D=1 pCO2,C/D=1 % time above pCO2,C/D=1
(µmol kg−1
) K*sp Oct. 2000 July 2001 June 2003 (µatm) Oct. 2000 July 2001 June 2003 Sand Bottom 2000 157 5.79 0a 5a 21a 562 13 11 28 Coral Rubble 2000 164 5.77 9a 8a 33a 537 24 13 43 Patch Reef 10% 2000 184 5.72 59a 15a 53a 467 69 21 64 Patch Reef 20% 2000 155 5.80 0a 5a 19a 605 0 7 26 Sand Bottom 2001 138 5.85 0a 1 10a 748 0 0a 10 Patch Reef 2001 113 5.93 0a 0a 2 1003 0 0 0a Average±1 std. dev. 152±24 5.81±.07 11.3±24 5.7±5 23.0±18 654±195 17.7±27 8.7±8 29.0±23 Total hours – – 25.6 h 156.0 h 71.6 h – 25.6 h 156.0 h 71.6 h
a
percent of time both CO2−
BGD
3, 123–154, 2006CO23−concentration and pCO2 thresholds
K. K. Yates and R. B. Halley
Title Page
Abstract Introduction
Conclusions References
Tables Figures
◭ ◮
◭ ◮
Back Close
Full Screen / Esc
Print Version
Interactive Discussion
EGU Molokai, Hawaii
BGD
3, 123–154, 2006CO23−concentration and pCO2 thresholds
K. K. Yates and R. B. Halley
Title Page
Abstract Introduction
Conclusions References
Tables Figures
◭ ◮
◭ ◮
Back Close
Full Screen / Esc
Print Version
Interactive Discussion
EGU
pCO2 (µatm)
CO
3
2- (
µ
mol kg
-1)
50 100 150 200 250 300 350
0 200 400 600 800 1000 1200 1400
Ambient Seawater Incubation Chamber
Y = 510.48 - 1.2687x + 0.0016843x 2 - 1.0846e-06x3 + 2.6744e-10x4 R2 = 0.97
.
Fig. 2. pCO2 and CO2−
3 concentrations of ambient seawater on the Molokai reef flat near
BGD
3, 123–154, 2006CO23−concentration and pCO2 thresholds
K. K. Yates and R. B. Halley
Title Page Abstract Introduction Conclusions References Tables Figures ◭ ◮ ◭ ◮ Back Close
Full Screen / Esc
Print Version Interactive Discussion EGU -1 -0.5 0 0.5 1 1.5
Bare Sand, 09/02/2000
y = 0.99178 - 0.0017778x R2= 0.65
-1 -0.5 0 0.5 1 1.5
Bare Sand, 09/02/2000
y = -1.4215 + 0.0089916x R2= 0.81
-1 -0.5 0 0.5 1
Coral Rubble, 13/02/2000
y = 1.4939 - 0.0027811x R2= 0.63
-1 -0.5 0 0.5 1
Coral Rubble, 13/02/2000
y = -2.3826 + 0.014489x R2= 0.69
-1 -0.5 0 0.5 1
Patch Reef (10% Coral Cover), 15/02/2000
y = 1.5564 - 0.0033487x R2= 0.51
-1 -0.5 0 0.5 1
Patch Reef (10% Coral Cover), 15/02/2000
y = -2.3733 + 0.012893x R2= 0.50
-1.5 -1 -0.5 0 0.5 1
300 400 500 600 700 800 900
Patch Reef (22% Coral Cover), 16/02/2000
y = 1.9627 - 0.0032465x R2= 0.66
-1.5 -1 -0.5 0 0.5 1
80 100 120 140 160 180 200 220
Patch Reef (22% Coral Cover), 16/02/2000
y = -2.9596 + 0.019056x R2= 0.63
G (g CaCO
3
m
-2 4 h -1)
G (g CaCO
3
m
-2 4 h
-1
)
G (g CaCO
3
m
-2 4 h
-1
)
G (g CaCO
3
m
-2 4 h
-1
)
pCO2 (µatm) CO32- (µmol kg-1)
G (g CaCO
3
m
-2 4 h
-1
)
G (g CaCO
3
m
-2 4 h
-1
)
G (g CaCO
3
m
-2 4 h
-1
)
G (g CaCO
3
m
-2 4 h
-1
)
(a) (b)
BGD
3, 123–154, 2006CO23−concentration and pCO2 thresholds
K. K. Yates and R. B. Halley
Title Page Abstract Introduction Conclusions References Tables Figures ◭ ◮ ◭ ◮ Back Close
Full Screen / Esc
Print Version
Interactive Discussion
EGU
G (g CaCO
3
m
-2 4 h
-1
)
G (g CaCO
3
m
-2 4 h
-1
)
pCO2 (µatm) CO32- (µmol kg-1)
G (g CaCO
3
m
-2 4 h
-1
)
G (g CaCO
3
m
-2 4 h
-1 ) (a) (b) -1.5 -1 -0.5 0 0.5 1 1.5
300 400 500 600 700 800 900
Bare Sand, 22/07/2001
y = 1.5364 - 0.0020624x R2= 0.66
-1.5 -1 -0.5 0 0.5 1 1.5
80 100 120 140 160 180 200 220
Bare Sand, 22/07/2001
y = -1.3293 + 0.0096319x R2= 0.56
-1.5 -1 -0.5 0 0.5 1 1.5
400 600 800 1000 1200 1400
Patch Reef (10% Coral Cover), 28/07/2001
y = 1.1116 - 0.001118x R2= 0.57
-1.5 -1 -0.5 0 0.5 1 1.5
80 100 120 140 160 180 200 220
Patch Reef (10% Coral Cover), 28/07/2001
y = -1.0904 + 0.0096202x R2= 0.51
pCO2 (µatm) CO32- (µmol kg-1)
Fig. 4. Rates of calcification/dissolution (G) vs. pCO2 (a) and CO2−
3 concentrations (b) for
BGD
3, 123–154, 2006CO23−concentration and pCO2 thresholds
K. K. Yates and R. B. Halley
Title Page
Abstract Introduction
Conclusions References
Tables Figures
◭ ◮
◭ ◮
Back Close
Full Screen / Esc
Print Version
Interactive Discussion
EGU
pCO
2
(
µ
atm)
CO
3
2- (
µ
mol kg
-1) (a)
(b)
100 150 200 250 300 350
10:00 14:20 19:25 0:00 5:55 11:35
Time of Day (hh:mm)
Bare Sand 09/02/2000 Coral Rubble 13/02/2000
Patch Reef 16/02/2000 Patch Reef 15/02/2000
Patch Reef 28/07/2001 Bare Sand 22/07/2001 C/D = 1
100 300 500 700 900 1100
10:00 14:20 19:25 0:00 5:55 11:35 Ambient Seawater 13/10 - 14/10/2000
Time of Day (hh:mm)
Bare Sand 09/02/2000 Coral Rubble 13/02/2000 Patch Reef 16/02/2000
Patch Reef 15/02/2000 Patch Reef 28/07/2001
Bare Sand 22/07/2001 C/D = 1
Fig. 5. Ambient seawater measurements of pCO2 and CO2−
3 concentrations from 13–14
BGD
3, 123–154, 2006CO23−concentration and pCO2 thresholds
K. K. Yates and R. B. Halley
Title Page
Abstract Introduction
Conclusions References
Tables Figures
◭ ◮
◭ ◮
Back Close
Full Screen / Esc
Print Version
Interactive Discussion
EGU
pCO
2
(
µ
atm)
(a)
(b)
100 300 500 700 900 1100
23:00 11:00 23:00 11:00 23:00 11:00 23:00 11:00 23:00 11:00 23:00 11:00 23:00 11:00
Bare Sand 09/02/2000 Coral Rubble 13/02/2000 Patch Reef 16/02/2000
Patch Reef 15/02/2000 Patch Reef 28/07/2001
Bare Sand 22/07/2001 Ambient Seawater 20/07 - 29/07/2001
Time of Day (hh:mm)
100 150 200 250 300 350
Bare Sand 09/02/2000 Coral Rubble 13/02/2000
Patch Reef 16/02/2000 Patch Reef 15/02/2000
Patch Reef 28/07/2001 Bare Sand 22/07/2001
23:00 11:00 23:00 11:00 23:00 11:00 23:00 11:00 23:00 11:00 23:00 11:00 23:00 11:00
Time of Day (hh:mm)
C/D = 1
C/D = 1
CO
3
2- (
µ
mol kg
-1)
Fig. 6. Ambient seawater measurements of pCO2and CO23− concentrations from 20–29 July 2001. Horizontal lines represent threshold pCO2 and CO2−
3 values from each substrate type