www.nat-hazards-earth-syst-sci.net/14/2133/2014/ doi:10.5194/nhess-14-2133-2014
© Author(s) 2014. CC Attribution 3.0 License.
An integrated approach for the evaluation of technological hazard
impacts on air quality: the case of the Val d’Agri oil/gas plant
M. Calvello1,2, F. Esposito3, and S. Trippetta1,2
1IMAA, Istituto di Metodologie per l’Analisi Ambientale, CNR, C.da S. Loja, Z.I., 85050 Tito Scalo (PZ), Italy 2Osservatorio Ambientale Val d’Agri, Via Vittorio Emanuele II, 3, 85052 Marsico Nuovo (PZ), Italy
3Scuola di Ingegneria, Università degli Studi della Basilicata, Viale dell’Ateneo Lucano 10, 85100 Potenza, Italy
Correspondence to:M. Calvello ([email protected])
Received: 27 February 2014 – Published in Nat. Hazards Earth Syst. Sci. Discuss.: 8 April 2014 Revised: 17 June 2014 – Accepted: 22 June 2014 – Published: 21 August 2014
Abstract. The Val d’Agri area (southern Italy) hosts one of the biggest onshore European reservoir and the largest oil/gas pre-treatment plant, named Centro Olio Val d’Agri (COVA), located in a rural/anthropized context. Several haz-ards are associated with this plant. These are mainly repre-sented by possible impacts of the COVA atmospheric emis-sions on the local air quality and human health. This work uses a novel approach based on the integration of air quality measurements from the regional monitoring network, addi-tional experimental measurements (i.e. sub-micrometre par-ticulate matter (PM1) and black carbon (BC)) and advanced statistical analyses to provide a preliminary evaluation of the Val d’Agri air quality state and give some indication of spe-cific areas potentially affected by COVA hazards. Results show that the COVA plant emissions have a particular impact on the air quality of the area closest to it. In this area sev-eral pollutants specifically related to the COVA combustion processes (i.e. nitrogen oxides, benzene and toluene) show the highest concentration values and significant correlations. The proposed approach represents a first step in the assess-ment of the risks associated with oil/gas exploration and pre-treatment activities and a starting point for the development of effective and exportable air quality monitoring strategies.
1 Introduction
The Val d’Agri area (Basilicata region – southern Italy) is characterized by the peculiar coexistence of natural features (woods and natural parks), large biodiversity, agricultural activities (cultivated and grazing areas) and several small
All this implies the need for efficient monitoring of the air quality state in this area, which should be carried out through the implementation of advanced and integrated ob-serving strategies able to characterize and possibly quantify the environmental and human health impacts of such activ-ity. In order to realize effective near-real-time monitoring of environmental hazards associated with the COVA emis-sions, an advanced network of five stations devoted to the air quality state control has been established in the Val d’Agri area. This network is operated by the Agenzia Regionale per la Protezione dell’Ambiente (ARPA) of the Basilicata region (ARPA Basilicata hereafter) and provides near-real-time concentration measurements of both regulated pollu-tants (i.e. sulfur dioxide, carbon monoxide, nitrogen diox-ide, nitrogen oxides, ozone, particulate matter and benzene) and several pollutants specifically related to oil/gas extrac-tion and treatment activities (i.e. nitrogen monoxide, hydro-gen sulfide, methane, non-methane hydrocarbons, total hy-drocarbons, toluene, ethylbenzene and isomers of xylene). To the best of our knowledge, this is the first air quality network which provides continuous concentration measure-ments of so many pollutants in a such small area, even when compared, for example to the very efficient observing net-work operating near the five refineries in the San Francisco Bay Area described in a recent comprehensive report by Fu-jita and Campbell (2013). More common monitoring strate-gies are mainly devoted to the study of volatile organic com-pounds (VOCs) and sulfur dioxide near refineries (Baltr˙enas et al., 2011; Lin et al., 2008) or near industrial parks, in-cluding petrochemical facilities (Liu et al., 2008; Hsieh et al., 2006). Nevertheless, more investigation should be done. In fact, previous studies carried out in the Val d’Agri area suggested the need for the integration of the existing obser-vations with experimental measurements of sub-micrometre aerosol particles (i.e. PM1, aerosol particles with an aerody-namic diameter less than 1.0 µm) and black carbon (BC here-after) due to their possible association with combustion pro-cesses such as those occurring in the COVA plant (Trippetta et al., 2013; Pavese et al., 2012). The importance of the mea-surement of PM1 and BC is especially related to their ad-verse effects on environment and human health (e.g. Mo-hiuddin et al., 2014; Anenberg et al., 2011). Moreover, BC also contributes significantly to global warming (Bond et al., 2013). Despite this, there is still a relatively limited amount of data for the sub-micrometre atmospheric particle fraction available at present (Mirante et al., 2013), and only recently there has been growth for BC monitoring networks in many countries around the world; these networks often employ Aethalometers due to their good time resolution, portabil-ity and low costs (see, for example, the US EPA network in Solomon et al. (2008), the UK Black Carbon Network in Butterfield et al. (2010) and the Swiss National Air Pollution Monitoring Network – NABEL in EMPA (2010)).
The present study enters into this context, and its main goal is to provide a preliminary evaluation of the air
qual-ity state of the Val d’Agri area and to give some indication of specific areas potentially affected by hazards deriving from the COVA plant through the use of a novel approach based on the integration of routine air quality measurements, ad-ditional experimental measurements and advanced statistical analyses.
To this aim, as a preliminary phase, daily concentrations of the main pollutants measured at the five monitoring stations located in the Val d’Agri area in the period 1 September– 31 October 2013 were considered and analysed along with simultaneous concentration measurements of PM1 and BC obtained at two of the five sampling sites and involving ad-ditional experimental facilities by the Istituto di Metodologie per l’Analisi Ambientale (IMAA) of the National Research Council of Italy (CNR). In particular, the temporal and spa-tial variability of the pollutant concentration measurements and the relative correlations were investigated using multi-variate statistical techniques, which also provided a prelimi-nary indication of the source types contributing to their pres-ence in the local atmosphere.
The possibility to integrate measurements from the exist-ing monitorexist-ing network with further key parameters as PM1 and BC with an in-depth cluster and spatial variance analy-ses represents a powerful approach to study the COVA influ-ence on the Val d’Agri environment. This will provide use-ful indications to the stakeholders in order to develop better emission control strategies and to reach a sustainable equilib-rium between the environmental impact of energy supply by oil/gas resources and the strong agricultural vocation of the area and to improve the standards of living for the Val d’Agri population.
2 Materials and methodologies
2.1 The ARPA Basilicata air quality monitoring network
The Val d’Agri air quality monitoring network con-sists of five monitoring stations: Viggiano Zona Indus-triale (VZI; 40◦18′50.64′′N, 15◦54′16.69′′E), Viggiano 1
(V1; 40◦20′4.58′′N, 15◦54′1.90′′E), Masseria De Blasiis
(MDB; 40◦19′26.18′′N, 15◦52′2.58′′E), Grumento Nova
(GN; 40◦17′18.00′′N, 15◦53′28.00′′E) and Costa Molina
Sud 1 (CMS; 40◦18′57.00′′N, 15◦57′15.00′′E). The
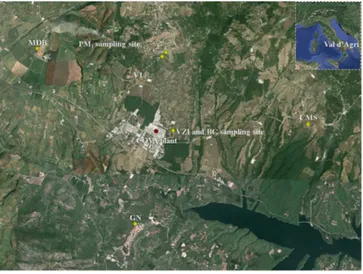
mon-itoring stations are located at a distance ranging between about 500 m and about 4800 m from the COVA plant and are representative of the air quality of an area of about 100 km2 around this plant (Fig. 1).
Figure 1. Location of the five stations of the ARPA Basilicata air quality monitoring network. The image also shows the loca-tion of the PM1 and BC sampling sites and of the Centro Olio Val d’Agri (COVA) plant. Aerial photography courtesy of Google Earth (http://earth.google.com/). Legend: Viggiano Zona Industri-ale (VZI), Viggiano 1 (V1), Masseria De Blasiis (MDB), Grumento Nova (GN) and Costa Molina Sud 1 (CMS).
hydrocarbons (THC; i.e. the sum of CH4and NMHCs), ben-zene (C6H6), toluene, ethylbenzene and isomers of xylene. Moreover, V1, MDB, GN and CMS also provide continu-ous and near-real-time measurements of the concentrations of particulate matter with an aerodynamic diameter less than 10 and 2.5 µm (PM10 and PM2.5, respectively). Regarding VZI, it is equipped for the measurement of the PM10 con-centrations only. These measurements are provided with a time lag of several months due to the instrumentation used (i.e. a gravimetric sampler). A summary of the methods used for the measurements of the concentrations of each pollutant is reported in Table 1.
All the air quality monitoring stations also provide mea-surements of the main meteorological parameters: air tem-perature (T), atmospheric pressure (P), relative humidity (RH), wind speed (ws) and direction (wd), global radiation (GR) and rainfall (rf).
2.2 Experimental PM1and BC measurements
PM1 measurements were performed in Viggiano at a dis-tance of about 170 m (SW direction) from V1–ARPA Basil-icata monitoring station (Fig. 1). This site was chosen since Viggiano is the nearest town to the COVA plant, at about 2400 m from it, and one of the most populated towns of the Val d’Agri area (about 3100 inhabitants). PM1 samples were collected using a low-volume (16.7 L min−1flow rate) gravimetric sampler (TCR Tecora) equipped with a PM1 cut-off inlet and polycarbonate filters (Ø=47 mm). The sam-pling time was 24 h (starting from 12.00 pm), and each fil-ter was humidity-conditioned in a filfil-ter-conditioning
cabi-net (approximately T=20±2◦C and RH=50±5 %) be-fore and after sampling for 48 h. The PM1mass was deter-mined by means of a gravimetric method using an analytical microbalance with a sensitivity of±1 µg.
Regarding BC measurements, they were performed close to the COVA plant by placing a dedicated instrument at VZI–ARPA Basilicata monitoring station. This location was chosen for its closeness to the COVA, where continuous combustion processes were thought to have an impact on BC content. A rack-mount seven-wavelengths Magee Sci-entific Aethalometer AE31 (370, 470, 520, 590, 660, 880 and 950 nm) was used to estimate BC mass concentrations and to detect the presence of its organic fraction through the UV-absorbing particulate matter (UVPM) quantity. The Aethalometer measures light attenuation due to the presence of absorbing carbonaceous aerosol deposits on a quartz fi-bre filter (Hansen, 2005). Corresponding absorption coeffi-cients are obtained at the seven wavelengths and converted to mass concentrations with, in particular, measurements at the 880 nm wavelength used to obtain BC content assuming a mass-specific absorption cross section of 16.6 m2g−1(Nair et al., 2012; Reche et al., 2011). If the organic component is present in carbonaceous aerosols, an enhanced absorption at the UV wavelengths is recorded, leading to qualitative detec-tion of this component through measurements at 370 nm (Es-posito et al., 2012). For the data considered in this work, the instrument was equipped with a cut size-selective cyclone to intake particles with aerodynamic diameters less than 2.5 µm at a flow rate of 4 L min−1and a time resolution of 5 min.
2.3 Meteorology and air mass history
A summary of the main meteorological parameters averaged over the period 1 September–31 October 2013 is reported in Table 2 for the five monitoring stations.
Low variations were observed for all parameters show-ing a quite homogeneous meteorological pattern all over the study area. Looking at the prevailing wind directions, westerly winds were more frequent for all the sites except for VZI monitoring station where a southeastern compo-nent was present. During the study period, the area was affected by frequent anticyclonic systems, as verified by the map of the 850 hPa geopotential heights obtained from the NOAA-NCEP/NCAR (National Oceanic and Atmo-spheric Administration–National Centers for Environmen-tal Prediction/National Center for Atmospheric Research) global reanalysis database (http://www.esrl.noaa.gov/psd/ data/gridded/data.ncep.reanalysis.derived.html; Kalnay et al., 1996) (Fig. 2).
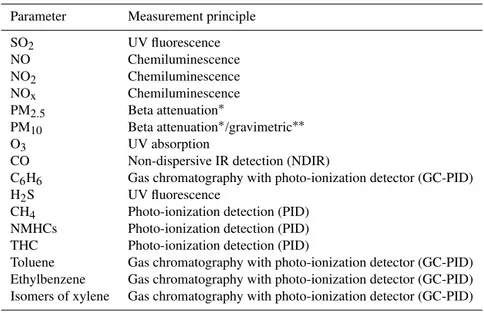
Table 1.Summary of the methods used for measuring concentrations of each pollutant.
Parameter Measurement principle
SO2 UV fluorescence
NO Chemiluminescence
NO2 Chemiluminescence
NOx Chemiluminescence
PM2.5 Beta attenuation∗
PM10 Beta attenuation∗/gravimetric∗∗
O3 UV absorption
CO Non-dispersive IR detection (NDIR)
C6H6 Gas chromatography with photo-ionization detector (GC-PID) H2S UV fluorescence
CH4 Photo-ionization detection (PID) NMHCs Photo-ionization detection (PID) THC Photo-ionization detection (PID)
Toluene Gas chromatography with photo-ionization detector (GC-PID) Ethylbenzene Gas chromatography with photo-ionization detector (GC-PID) Isomers of xylene Gas chromatography with photo-ionization detector (GC-PID)
∗V1, GN, MDB and CMS monitoring stations;∗∗VZI monitoring station.
Table 2.Mean±standard deviation (m±SD) of the main meteorological parameters measured at the five air quality monitoring stations from 1 September to 31 October 2013. Regarding the wind direction (wd), the prevailing directions evaluated for the entire period of observation are reported.
Monitoring T RH P ws Prevailing wd GR rf
station (◦C) (%) (hPa) (ms−1) (Wm−2) (mm)
VZI 17±3 74±9 946±4 1.2±0.5 SE/SW 174±59 1.8±3.9 V1 17±2 66±11 933±4 3.4±1.6 SW/NW 159±55 1.4±4.3 MDB 16±3 75±8 948±4 3.1±1.6 NW 149±47 1.1±3.5 GN 17±3 64±11 932±4 2.4±1.3 SW 106±42 0.1±0.6 CMS 18±3 73±11 939±4 3.7±1.7 NW 167±58 1.3±3.8
at 500 m above ground level (a.g.l.) were computed 4 times daily and further put together in different clusters accord-ing to similar transport patterns. A map with the mean tra-jectory for each representative cluster and the corresponding percentage of occurrence is shown in Fig. 3. As Fig. 3 shows, 48 % of the total backward trajectories travelled very low be-fore reaching the study area, and among these, 45 % were of local origin remaining over the Tirrenian Sea. This could have favoured the accumulation of pollutants in the lowest atmospheric layers during the study period.
3 Results and discussion
3.1 Explorative statistical analysis
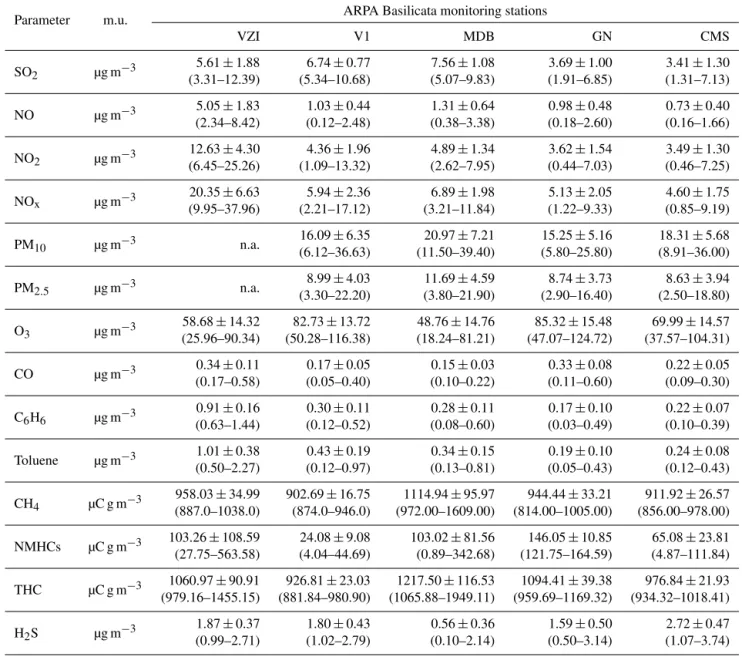
Table 3 reports a summary of the explorative statistical anal-ysis carried out on the pollutant mean daily concentrations measured in the area under study from 1 September to 31 Oc-tober 2013. Concentration measurements of ethylbenzene and isomers of xylene were not considered in this study due
to the several data being missing. As Table 3 shows, signif-icantly higher values of NO, NO2, NOx, C6H6 and toluene daily concentrations were registered at VZI monitoring sta-tion with respect to the other four stasta-tions. These compounds mainly originate from anthropogenic sources, including the COVA plant. In fact, NOx and VOCs represent some of the main gaseous emissions of this plant (ENI, 2012). Therefore, the higher concentration values recorded at VZI monitoring station should be also related to a contribution from COVA to their presence in the local atmosphere. Furthermore, CH4 daily concentrations showed higher values at MDB monitor-ing station, likely due to its proximity to several farms de-voted to the breeding of dairy cows. In fact, the livestock sector is one of the largest contributors to greenhouse gas emissions globally, mostly as CH4emissions (Van Middelaar et al., 2014; Liang et al., 2013). Finally, higher H2S concen-tration values were registered at CMS station.
Figure 4 reports the temporal pattern of the PM1 daily concentrations. As Fig. 4 shows, the PM1 daily concentra-tions ranged from 1.1 to 7.4 µg m−3, with a mean value of
2.7 µg m−3. Due to the lack of PM
Table 3.Statistical parameters of the atmospheric pollutant daily concentrations measured at the five air quality monitoring stations from 1 September to 31 October 2013. Mean±standard deviation (m±SD) and the range of variability (min–max) are reported for each pollutant. Legend: n.a.=not available; m.u.=measurement units.
Parameter m.u. ARPA Basilicata monitoring stations
VZI V1 MDB GN CMS
SO2 µg m−3 (3.31–12.39)5.61±1.88 (5.34–10.68)6.74±0.77 7.56(5.07–9.83)±1.08 (1.91–6.85)3.69±1.00 (1.31–7.13)3.41±1.30
NO µg m−3 5.05±1.83 1.03±0.44 1.31±0.64 0.98±0.48 0.73±0.40
(2.34–8.42) (0.12–2.48) (0.38–3.38) (0.18–2.60) (0.16–1.66)
NO2 µg m−3 (6.45–25.26)12.63±4.30 (1.09–13.32)4.36±1.96 4.89(2.62–7.95)±1.34 (0.44–7.03)3.62±1.54 (0.46–7.25)3.49±1.30
NOx µg m−3 (9.95–37.96)20.35±6.63 (2.21–17.12)5.94±2.36 (3.21–11.84)6.89±1.98 (1.22–9.33)5.13±2.05 (0.85–9.19)4.60±1.75
PM10 µg m−3 n.a. (6.12–36.63)16.09±6.35 (11.50–39.40)20.97±7.21 (5.80–25.80)15.25±5.16 18.31(8.91–36.00)±5.68
PM2.5 µg m−3 n.a.
8.99±4.03 11.69±4.59 8.74±3.73 8.63±3.94 (3.30–22.20) (3.80–21.90) (2.90–16.40) (2.50–18.80)
O3 µg m−3 58.68
±14.32 82.73±13.72 48.76±14.76 85.32±15.48 69.99±14.57 (25.96–90.34) (50.28–116.38) (18.24–81.21) (47.07–124.72) (37.57–104.31)
CO µg m−3 0.34±0.11 0.17±0.05 0.15±0.03 0.33±0.08 0.22±0.05
(0.17–0.58) (0.05–0.40) (0.10–0.22) (0.11–0.60) (0.09–0.30)
C6H6 µg m−3 0.91
±0.16 0.30±0.11 0.28±0.11 0.17±0.10 0.22±0.07 (0.63–1.44) (0.12–0.52) (0.08–0.60) (0.03–0.49) (0.10–0.39)
Toluene µg m−3 1.01±0.38 0.43±0.19 0.34±0.15 0.19±0.10 0.24±0.08 (0.50–2.27) (0.12–0.97) (0.13–0.81) (0.05–0.43) (0.12–0.43)
CH4 µC g m−3 958.03
±34.99 902.69±16.75 1114.94±95.97 944.44±33.21 911.92±26.57 (887.0–1038.0) (874.0–946.0) (972.00–1609.00) (814.00–1005.00) (856.00–978.00)
NMHCs µC g m−3 103.26±108.59 24.08±9.08 103.02±81.56 146.05±10.85 65.08±23.81
(27.75–563.58) (4.04–44.69) (0.89–342.68) (121.75–164.59) (4.87–111.84)
THC µC g m−3 1060.97±90.91 926.81±23.03 1217.50±116.53 1094.41±39.38 976.84±21.93
(979.16–1455.15) (881.84–980.90) (1065.88–1949.11) (959.69–1169.32) (934.32–1018.41)
H2S µg m−3 1.87±0.37 1.80±0.43 0.56±0.36 1.59±0.50 2.72±0.47
(0.99–2.71) (1.02–2.79) (0.10–2.14) (0.50–3.14) (1.07–3.74)
in the area under study during the considered period, these values were compared with the unique PM1 concentration measurements presently existing for this area and reported in a previous study (Trippetta et al., 2013). Results show that the PM1daily concentrations registered during the period under consideration were lower than the PM1 concentration mean value (11.0±5.1 µg m−3)measured close to the COVA plant from July to November 2011.
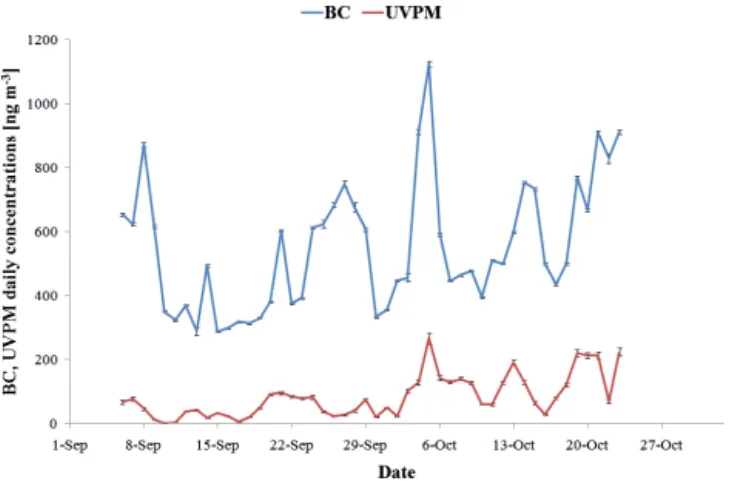
Daily values of BC and UVPM content are reported in Fig. 5. BC daily concentrations were found in the range from 288 to 1125 ng m−3with a mean value of 551 ng m−3. Also,
in the case of BC, a comparison was possible with the unique data set of BC concentration measurements available for the
area described in Pavese et al. (2012). In that case, a slightly lower monthly mean value of 494 ng m−3 was obtained in February 2011, while higher mean monthly values of 822, 735 and 858 ng m−3were found in January, March and April 2011, respectively.
For UVPM, estimated values were included in the range from 2 to 267 ng m−3with a mean value of 84 ng m−3,
im-plying the constant presence of the organic component of car-bonaceous particles during the sampling period.
3.2 Cluster analysis
Figure 2. Map of the 850 hPa geopotential heights averaged for the period 1 September–31 October 2013 from the NOAA-NCEP/NCAR (National Oceanic and Atmospheric Administration– National Centers for Environmental Prediction/National Center for Atmospheric Research) reanalysis database.
a preliminary indication of the source types contributing to their presence in the local atmosphere, cluster analysis (CA) was used. In particular, a hierarchical-type clustering algo-rithm was applied to the Pearson correlation (ρ)matrix, and the furthest-neighbour method was chosen as a criterion for forming clusters (Legendre and Legendre, 1985).
For this analysis, THC was considered as the sum of CH4 and NMHCs, and NOxas the sum of NO and NO2, in order to avoid redundant information.
By applying CA to the pollutant concentration data recorded at VZI monitoring site, three clusters and three iso-lated variables were found (Fig. 6a). In particular, the first cluster is composed of C6H6 and toluene; the second in-cludes SO2and NOx; and the third consists of BC, UVPM and THC. CO, H2S and O3 represent the isolated vari-ables. By analysing each identified cluster, it can be ob-served that C6H6and toluene, which belong to the aromatic VOCs group, show a good correlation (ρ=0.86). This could suggest a common source of these two compounds in the considered area. Major sources of ambient VOCs – espe-cially of benzene, toluene, ethylbenzene and isomers of xy-lene (BTEX) – include vehicular emissions, automobile ser-vice stations and industrial emissions (Caselli et al., 2010). In particular, the vehicular emissions come from different
Figure 3.Maps with average trajectories for each obtained clus-ter and corresponding percentage of occurrence (in brackets) for the period 1 September–31 October 2013. The numbers outside the brackets identify each cluster.
Figure 4.Temporal pattern of the PM1daily concentrations mea-sured at Viggiano town from 1 September to 31 October 2013.
Figure 5.Temporal patterns of daily values of black carbon (BC) and UV-absorbing particulate matter (UVPM) content obtained at Viggiano Zona Industriale (VZI) station from 6 September to 23 October 2013.
gaseous compounds represent the main gases emitted by the COVA thermodestroyers (ENI, 2012). Therefore, the signif-icant SO2and NOxcorrelation could suggest the influence of the COVA emissions on the local air quality. Regarding the third cluster, a good correlation is found between BC and UVPM (ρ=0.53) as well as between these two param-eters and THC (ρ=0.45). The formation of this cluster can be explained by incomplete combustion processes as a com-mon source of all the three parameters, and highlights the strong interaction between the particle phase represented by BC and the organic molecular species contained in UVPM. These molecules, quantitatively determined by THC concen-tration measurements, are verified to have a high probability to be adsorbed on BC particles surfaces (Kim et al., 2009). From concentration values in Table 3, it can be easily verified that more than 90 % of THC consists of methane, and there-fore a good correlation between BC, UVPM and CH4can be inferred from CA. Since the presence of methane in the local atmosphere of the area covered by VZI monitoring station is very likely related to COVA combustion processes, rather than traffic, the same prevailing source can be attributed to BC and UVPM emissions at the sampling site under consid-eration.
By considering V1 monitoring site, the application of CA to the pollutant daily concentration data pointed out three clusters and four isolated variables (Fig. 6b). Since the PM1 monitoring site is very close to V1 monitoring station, it can be assumed that these two sites are representative of the same area, implying that PM1measurements can be consid-ered along with those performed at V1 monitoring station in CA. As Fig. 6b shows, the first cluster includes PM10 and PM2.5; the second is composed of NOx, C6H6and toluene;
and the third consists of CO and THC. H2S, O3, PM1and SO2represent the isolated variables. Focusing on each sin-gle cluster, it can be observed that PM10and PM2.5show the
highest value of the correlation coefficient (ρ=0.93). This indicates that they could share some sources and/or emis-sion processes (Parmar et al., 2001). Due to the large num-ber of sources emitting particulate matter in the considered area, the lack of the PM10 and PM2.5 chemical characteri-zation, and the absence of significant correlations between PM10/PM2.5and other pollutants, their main origin was not
identified. Regarding the second cluster, NOxand C6H6are significantly correlated with each other (ρ=0.74) and with toluene (ρ=0.65). Moreover, focusing on the third cluster, it can be observed that CO and THC are characterized by a cor-relation coefficient of 0.54. All these compounds, although included into two separate clusters, could have originated from common sources. In fact, CO, NOx, VOCs and hydro-carbons as NMHCs are the main emissions of petrol and diesel-engine motor vehicles. Moreover, CO, NOx, VOCs and hydrocarbons, in this case as CH4, are included among the main gaseous emissions of the COVA plant (ENI, 2012). If one considers that V1 monitoring station is located at about 5 m from the main road connecting the industrial area with the town of Viggiano, and at about 2300 m from the COVA plant, this cluster could reveal the influence of both traffic-and COVA-plant-related emissions on the local atmosphere.
When applying CA to the pollutant daily concentrations measured at MDB monitoring site, two clusters and four iso-lated variables are found (Fig. 6c). In particular, the first clus-ter is composed of PM10, PM2.5 and CO, and the second includes C6H6, toluene and NOx. H2S, O3, SO2 and THC represent the isolated variables. By considering the correla-tion coefficients, it can be observed that PM10 and PM2.5 are significantly correlated with each other (ρ=0.94) and with CO (ρ=0.60). A significant correlation between CO and PM measurements was found in areas affected by emis-sions coming from residential wood combustion (e.g. Bignal et al., 2008) and agricultural-burning smoke (Gonçalves et al., 2011), and/or in sites exposed to traffic emissions (Perez et al., 2004). All these types of emissions characterize the area where MDB monitoring station is located. In fact, MDB is placed in a rural area where open burning of grass and forest is a common practice used for clearing field waste in farming and ranching. Moreover, MDB is about 1400 m from a high-speed motorway (i.e. SS 598) characterized by a moderate volume of traffic consisting of cars and heavy ve-hicles. The proximity of the MDB monitoring station to the SS 598 could also justify the second cluster identified where C6H6and toluene are significantly correlated with each other (ρ=0.86) and with NOx (ρ=0.60). In fact, benzene and toluene are considered to be emitted from vehicle-related ac-tivity, including vehicular exhaust and gasoline evaporation (Seco et al., 2013; Wang et al., 2012), while NOxis signifi-cantly related to heavy-duty vehicle emissions (e.g. Fu et al., 2013).
(a)
(c)
(e)
(b)
(d)
Figure 6.Dendrograms obtained by applying the furthest-neighbour clustering method to the pollutant concentration data recorded at(a) VZI monitoring site,(b)V1 monitoring site,(c)MDB monitoring site,(d)GN monitoring site and(e)CMS monitoring site. The clusters are shown in grey.
second includes C6H6, toluene, NOxand THC. H2S, O3and SO2represent the isolated variables. In particular, PM10and PM2.5 show the highest value of the correlation coefficient (ρ=0.91), meaning that they are characterized by a similar behaviour. However no suggestion about their origin, and as a consequence no indication about the sources affecting the local air quality, is provided by CA in this case. Focusing on the second cluster, it can be observed that C6H6and toluene are significantly correlated with each other (ρ=0.81) and with NOx(ρ=0.74). Then, this group correlates with THC (ρ=0.53). As found for V1 monitoring station, these corre-lations highlight the traffic- and COVA-plant-related contri-butions that can be justified if it is considered that GN mon-itoring station is located in the suburbs of the town of Gru-mento, where a contribution deriving from traffic is expected and that GN is about 2800 m from the COVA plant.
When applying CA to the pollutant daily concentrations measured at CMS monitoring site, three clusters and three isolated variables are found (Fig. 6e). In particular, the first cluster is composed of PM10and PM2.5; the second includes
C6H6, THC and toluene; and the third is represented by CO and H2S. NOx, SO2and O3represent the isolated variables. By considering the correlation coefficients between the vari-ables included in each cluster, it can be observed that PM10 and PM2.5 show the highest value of the correlation coef-ficient (ρ=0.97), but CA does not provide any suggestion about their origin in this case either. Regarding the second cluster, C6H6and THC are significantly correlated with each other (ρ=0.75) and with toluene (ρ=0.48). As found for V1 and GN monitoring stations, these correlations could be attributed to COVA-plant-related contributions. Finally, fo-cusing on the third cluster, it can be observed that CO and H2S are correlated with each other (ρ=0.48). This cluster very likely reveals the impact of the COVA emissions on the local air quality, probably deriving from the incomplete com-bustion of the natural gas in the plant’s system of torches.
3.3 Data spatial variance
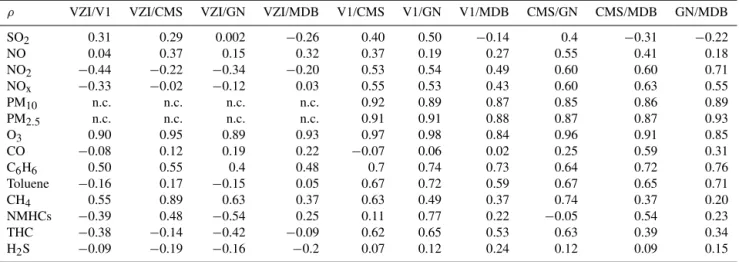
Pearson correlation coefficients (ρ)were calculated between the pollutant concentrations measured at the five air quality stations.
Regarding the COD, it was calculated for each parameter and for each pair of stations to obtain an estimate of the de-gree of the data set uniformity following Eq. (1):
CODj, k= v u u t 1 p
p
X
i=1
(xij−xik)/(xij+xik)
2
, (1)
wherex represents the daily concentrations and thei,j and k indexes refer respectively to the sampling day and to the two sampling stations (Wongphatarakul et al., 1998). The CODs can vary from 0 (maximum degree of homogeneity) to 1 (minimum degree of homogeneity) for the considered pollutant concentrations measured at each pair of sampling sites.
COD and ρ values are reported in Tables 4 and 5, respectively.
Substantial homogeneity was observed for CH4 and O3 when they were compared to the other pollutants. In fact, they show low values of CODs and relatively high ρ val-ues very likely due to their longer residence times in the at-mosphere with respect to the other pollutants. This peculiar feature allowed for a more uniform distribution of the pol-lutants over the entire area, which was also favoured by fre-quent high-pressure conditions characterizing the considered period (see Fig. 2).
Focusing on the comparison between the CH4 and O3 concentrations measured at the five air quality stations, the higher COD and the lower ρ values found when the cou-pling with the MDB station was considered confirm the pe-culiarity of this site for CH4production, as already reported in Sect. 3.1. Then, looking at the O3ρ values, the highest values were found when VZI and MDB stations were ex-cluded from the coupling, implying that these two stations are different from the others with regard to ozone. This is in accordance with the lower mean values of O3found at VZI and MDB stations (see Table 3), where at the same time high concentration values of both NOxand NMHCs, the two well-known main ozone precursors, are found. This confirms the larger probability that ozone enhancement is detected at sites far from where it is formed through secondary processes (Li et al., 2013).
Regarding PM10 and PM2.5, a comparison was possible in all cases except for VZI station, where no measurements were available for these two parameters. For the remaining stations, very low CODs and very high ρ values were ob-tained, highlighting a spread and homogeneous diffusion of such pollutants over the study area. This could be due to com-mon sources of these two parameters, and their uniform pres-ence in the local atmosphere could be also associated with the prevalence of high-pressure systems over the area during the study period.
For benzene, toluene and nitrogen compounds, higher val-ues of COD and correspondingly lowerρvalues were found when the coupling with VZI station was considered. This can be attributed to an additional source of such compounds other than traffic present at VZI and related to the COVA emissions as previously assessed by the CA. Looking in particular at NOx, benzene and toluene, good values ofρ and low val-ues of COD were found when the other four stations were considered, suggesting a common source of traffic that is in agreement with CA results.
Regarding SO2, COD values did not show any particular trend while the lowestρvalues were found when MDB sta-tion was considered. In the case of H2S, lowest ρ values were found for VZI coupling, suggesting the presence of a source of this pollutant at the sampling site located close to the COVA plant. At the same time, the highest CODs cor-respond to the coupling with MDB station, where particu-larly low mean values of this parameter were registered, as reported in Table 3, probably due to the upwind position of this station with respect to the COVA (see Fig. 1 and Table 2, where prevailing wind direction is mentioned).
As to CO, a lack of homogeneity was present for all the stations. This, in agreement with what was found by CA, reflects the presence of several different sources of CO in the area, including COVA emissions, traffic, and combustion processes related to agricultural activities.
Finally, when NMHCs are considered, a lack of homo-geneity was present for all the stations, probably due to their short residence time in the atmosphere.
4 Conclusions
Table 4.Coefficients of divergence (CODs) calculated for each pollutant and each pair of stations. Legend: n.c. – not calculable.
COD VZI/V1 VZI/CMS VZI/GN VZI/MDB V1/CMS V1/GN V1/MDB CMS/GN CMS/MDB GN/MDB
SO2 0.17 0.31 0.26 0.24 0.38 0.32 0.11 0.18 0.43 0.37 NO 0.66 0.75 0.68 0.60 0.32 0.30 0.28 0.30 0.38 0.29 NO2 0.52 0.57 0.56 0.44 0.21 0.23 0.18 0.19 0.19 0.23 NOx 0.56 0.63 0.60 0.49 0.20 0.19 0.17 0.16 0.22 0.21 PM10 n.c. n.c. n.c. n.c. 0.10 0.08 0.16 0.12 0.10 0.17 PM2.5 n.c. n.c. n.c. n.c. 0.16 0.10 0.16 0.12 0.24 0.16 O3 0.19 0.10 0.20 0.10 0.09 0.03 0.28 0.11 0.19 0.29 CO 0.36 0.27 0.17 0.40 0.21 0.35 0.16 0.25 0.20 0.39 C6H6 0.46 0.60 0.67 0.51 0.19 0.36 0.13 0.31 0.18 0.33 Toluene 0.45 0.60 0.67 0.50 0.33 0.43 0.21 0.24 0.22 0.32 CH4 0.03 0.03 0.02 0.08 0.01 0.03 0.11 0.02 0.10 0.09 NMHCs 0.54 0.29 0.44 0.52 0.50 0.73 0.62 0.45 0.50 0.56 THC 0.08 0.06 0.05 0.09 0.03 0.08 0.14 0.06 0.11 0.07 H2S 0.20 0.23 0.23 0.60 0.24 0.21 0.58 0.32 0.69 0.55
Table 5.Pearson correlation coefficients (ρ)calculated for each pollutant and each pair of stations. Legend: n.c. – not calculable.
ρ VZI/V1 VZI/CMS VZI/GN VZI/MDB V1/CMS V1/GN V1/MDB CMS/GN CMS/MDB GN/MDB
SO2 0.31 0.29 0.002 −0.26 0.40 0.50 −0.14 0.4 −0.31 −0.22
NO 0.04 0.37 0.15 0.32 0.37 0.19 0.27 0.55 0.41 0.18 NO2 −0.44 −0.22 −0.34 −0.20 0.53 0.54 0.49 0.60 0.60 0.71
NOx −0.33 −0.02 −0.12 0.03 0.55 0.53 0.43 0.60 0.63 0.55
PM10 n.c. n.c. n.c. n.c. 0.92 0.89 0.87 0.85 0.86 0.89 PM2.5 n.c. n.c. n.c. n.c. 0.91 0.91 0.88 0.87 0.87 0.93 O3 0.90 0.95 0.89 0.93 0.97 0.98 0.84 0.96 0.91 0.85 CO −0.08 0.12 0.19 0.22 −0.07 0.06 0.02 0.25 0.59 0.31
C6H6 0.50 0.55 0.4 0.48 0.7 0.74 0.73 0.64 0.72 0.76 Toluene −0.16 0.17 −0.15 0.05 0.67 0.72 0.59 0.67 0.65 0.71 CH4 0.55 0.89 0.63 0.37 0.63 0.49 0.37 0.74 0.37 0.20 NMHCs −0.39 0.48 −0.54 0.25 0.11 0.77 0.22 −0.05 0.54 0.23
THC −0.38 −0.14 −0.42 −0.09 0.62 0.65 0.53 0.63 0.39 0.34
H2S −0.09 −0.19 −0.16 −0.2 0.07 0.12 0.24 0.12 0.09 0.15
the significant correlation found between BC and UVPM content and THC (mainly consisting of CH4) could indi-cate the COVA incomplete combustion processes as a source of carbonaceous compounds in this area and highlights the role of BC as a vehicle for organic compounds in the envi-ronment. Regarding CMS station, the impact of the COVA emissions on the local air quality probably derives from the incomplete combustion of the natural gas in the plant’s sys-tem of torches. Traffic represents an additional and important source of atmospheric pollutants over the entire area. More-over, the contribution of emission deriving from dairy cow breeding and agriculture-related activities has been found in the area where MDB monitoring station is located. This is in fair agreement with the prevailing rural features of this area. Results also show that PM1is not correlated with any pollu-tant, suggesting the need for further investigation of these pa-rameters so as to define its main origin. Regarding the inter-site variability of the pollutant concentrations, substantial ho-mogeneity was observed for CH4, O3, PM10and PM2.5when
they were compared to the other pollutants. This is proba-bly due to peculiar features of these pollutants (referring to CH4and O3), probable common sources (referring to PM10 and PM2.5)and the prevalence of high-pressure systems over
the area during the study period (all pollutants). Focusing on the single air quality station, COD andρvalues confirm the presence of an additional CH4source in the area where MDB station is located. Moreover, a difference among the VZI and MDB stations and the remaining stations is observed if O3is considered. Finally, remarkable differences between VZI and the other stations have been confirmed when concentration values of NOx, benzene, toluene and H2S are considered.
integrated observing strategy applicable to other similar in-dustrial sites.
Acknowledgements. This work was carried out in the framework of the research agreement between “Regione Basilicata – Osserva-torio Ambientale della Val d’Agri” and “Istituto di Metodologie per l’Analisi Ambientale” of the National Research Council (IMAA-CNR). The authors are indebted to Rosa Caggiano and Giulia Pavese for helpful discussions and suggestions. The authors would like to thank the Agenzia Regionale per la Protezione dell’Ambiente (ARPA) of the Basilicata region for providing envi-ronmental data and for the logistical support in BC measurements operations. Moreover, authors are grateful to the “Protezione Civile Gruppo Lucano – Viggiano” for the logistical support given during the PM1sampling campaign.
Edited by: F. Vallianatos
Reviewed by: two anonymous referees
References
Anenberg, S. C., Talgo, K., Arunachalam, S., Dolwick, P., Jang, C., and West, J. J.: Impacts of global, regional, and sec-toral black carbon emission reductions on surface air quality and human mortality, Atmos. Chem. Phys., 11, 7253–7267, doi:10.5194/acp-11-7253-2011, 2011.
Baltr˙enas, P., Baltr˙enait˙e, E., Šereviˇcien˙e V., and Pereira, P.: At-mospheric BTEX concentrations in the vicinity of the crude oil refinery of the Baltic region, Environ. Monit. Asses., 182, 115– 127, 2011.
Bignal, K. L., Langridge, S., and Zhou, J. L.: Release of polycyclic aromatic hydrocarbons, carbon monoxide and particulate matter from biomass combustion in a wood-fired boiler under varying boiler conditions, Atmos. Environ., 42, 8863–8871, 2008. Bond, T. C., Doherty, S. J., Fahey, D. W., Forster, P. M., Berntsen,
T., De Angelo, B. J., Flanner, M. G., Ghan, S., Kärcher, B., Koch, D., Kinne, S., Kondo, Y., Quinn, P. K., Sarofim, M. C., Schultz, M. G., Schulz, M., Venkataraman, C., Zhang, H., Zhang, S., Bel-louin, N., Guttikunda, S. K., Hopke, P. K., Jacobson, M. Z., Kaiser, J. W., Klimont, Z., Lohmann, U., Schwarz, J. P., Shin-dell, D., Storelvmo, T., Warren, S. G., and Zender, C. S.: Bound-ing the role of black carbon in the climate system: A scientific assessment, J. Geophys. Res., 118, 5380–5552, 2013.
Butterfield, D., Beccaceci, S., Sweeney, B., Green, D., Alexander, J., and Grieve, A.: Annual Report for the UK Black Carbon Network, available at: http://uk-air.defra.gov.uk/reports/cat05/ 1009031405_2009_BC_Annual_Report_Final.pdf (last access: February 2014), 2010.
Caselli, M., De Gennaro, G., Marzocca, A., Trizio, L., and Tutino, M.: Assessment of the impact of the vehicular traffic on BTEX concentration in ring roads in urban areas of Bari (Italy), Chemo-sphere, 81, 306–311, 2010.
COVA plant: External Emergency Plan, available at: http://www. osservatoriovaldagri.it/ (last access: February 2014), 2009 (in Italian).
Draxler, R. R. and Rolph, G. D.: HYSPLIT (Hybrid Single-Particle Lagrangian Integrated Trajectory) model, NOAA Air Resour. Lab., Silver Spring, MD, available at: http://ready.arl.noaa.gov/ HYSPLIT.php (last access: February, 2014), 2003.
EMPA: Technischer Bericht zum Nationalen Beobachtungsnetz für Luftfremdstoffe (NABEL), Swiss Federal Laboratories for Materials Testing and Research (EMPA), Dübendorf, Switzer-land, available at: http://www.empa.ch/nabel (last access: March 2013), 2010.
ENI (Ente Nazionale Idrocarburi): ENI in Basilicata, Local Re-port 2012, available at: http://www.eni.com/files/documenti/ eni-in-basilicata.pdf, 2012 (in Italian).
Esposito, F., Calvello, M. R., Gueguen, E., and Pavese, G.: A new algorithm for brown and black carbon identification and organic carbon detection in fine atmospheric aerosols by a multi-wavelength Aethalometer, Atmos. Meas. Tech. Discuss., 5, 1003–1027, doi:10.5194/amtd-5-1003-2012, 2012.
Fu, M., Ge, Y., Wang, X., Tana, J., Yu, L., and Liang, B.: NOx emis-sions from Euro IV busses with SCR systems associated with ur-ban, suburban and freeway driving patterns, Sci. Total Environ., 452–453, 222–226, 2013.
Fujita, E. M., and Campbell, D. E.: Review of Current Air Monitor-ing Capabilities near Refineries in the San Francisco Bay Area, Final Report, available at: http://www.baaqmd.gov/~/media/ Files/Technical%20Services/DRI_Final_Report_061113.ashx, last access: February, 2014.
Godoi, R. H. M., Godoi, A. F. L., Gonçalves Junior, S. J., Paralovo, S. L., Borillo, G. C., Barbosa, C. G. G., Arantes, M. G., Charello, R. C., Filho, N. A. R., Grassi, M. T., Yamamoto, C. I., Potgieter-Vermaake, S., Rotondo, G. G., De Waelf, K., and van Grieken, R.: Healthy environment – indoor air quality of Brazilian elemen-tary schools nearby petrochemical industry, Sci. Total Environ., 463–464, 639–646, 2013.
Gonçalves, C., Evtyugina, M., Alves, C., Monteiro, C., Pio, C., and Tomé, M.: Organic particulate emissions from field burning of garden and agriculture residues, Atmos. Res., 101, 666–680, 2011.
Hansen, A. D. A.: The Aethalometer manual, Magee Sci-entific, available at: http://mageesci.com/support/downloads/ Aethalometerbook2005.07.03.pdf (last accesse: February 2014), 2005.
Hsieh, L., Yang, H., and Chen, H.: Ambient BTEX and MBTE in the neighbourhoods of different industrial parks in Southern Tai-wan, J. Hazard. Mater., A128, 106–115, 2006.
Kalnay, E., Kanamitsu, M., Kistler, R., Collins, W., Deaven, D., Gandin, L., Iredell, M., Saha, S., White, G., Woollen, J., Zhu, Y., Leetmaa, A., Reynolds, R., Chelliah, M., Ebisuzaki, W., Higgins, W., Janowiak, J., Mo, K. C., Ropelewski, C., Wang, J., Jenne, R., and Joseph, D.: The NCEP/NCAR 40-year reanalysis project, B. Am. Meteorol. Soc., 77, 437–470, 1996.
Kim, D., Kumfe, B. M., Anastasio, C., Kennedy, I. M., and Young, T. M.: Environmental aging of polycyclic aromatic hydrocarbons on soot and its effect on source identification, Chemosphere, 76, 1075–1081, 2009.
Legendre, L. and Legendre, P.: Numerical Ecology, Elsevier Sci-ence Publishers, Amsterdam, 1985.
Liang, L., Lal, R., Du, Z., Wu, W., and Meng, F.: Estimation of ni-trous oxide and methane emission from livestock of urban agri-culture in Beijing, Agr. Ecosyst. Environ., 170, 28–35, 2013. Lin, T.-Y., Sree, U., Tseng, S.-H., Chiu, K. H., Wu, C.-H., and Lo,
J.-G.: Volatile organic compound concentrations in ambient air of Kaohsiung petroleum refinery in Taiwan, Atmos. Environ., 38, 4111–4122, 2008.
Liu, P.-W., Yao, Y.-C., Tsai, J.-H., Hsu, Y.-C., Chang, L.-P., and Chang, K.-H.: Source impacts by volatile organic compounds in an industrial city of southern Taiwan, Sci. Total Environ., 398, 154–163, 2008.
Mirante, F., Alves, C., Pio, C., Pindado, O., Perez, R., Revuelta, M. A., and Artiñano, B.: Organic composition of size segregated atmospheric particulate matter, during summer and winter sam-pling campaigns at representative sites in Madrid, Spain, Atmos. Res., 132–133, 345–361, 2013.
Mohiuddin, K., Strezov, V., Nelson, P. F., and Stelcer, E.: Charac-terisation of trace metals in atmospheric particles in the vicinity of iron and steelmaking industries in Australia, Atmos. Environ., 83, 72–79, 2014.
Nair, V. S., Solmon, F., Giorgi, F., Mariotti,L., Babu, S. S., and Moorthy, K. K.: Simulation of South Asian aerosols for regional climate studies, J. Geophys. Res., 117, D04209, doi:10.1029/2011JD016711, 2012.
Parmar, R. S., Satsangi, G. S., Kumari, M., Lakhani, A., Srivastav, S. S., and Prakash, S.: Study of size-distribution of atmospheric aerosols at Agra, Atmos. Environ., 35, 693–702, 2001.
Pavese, G., Calvello, M., and Esposito, F.: Black Carbon and or-ganic components in the atmosphere of Southern Italy: compar-ing emissions from different sources and production processes of carbonaceous particles, Aerosol Air Qual. Res., 12, 1146–1156, 2012.
Perez, P., Palacios, R., and Castillo, A.: Carbon monoxide concen-tration forecasting in Santiago, Chile, J. Air Waste Manage., 54, 908–913, 2004.
Reche, C., Querol, X., Alastuey, A., Viana, M., Pey, J., Moreno, T., Rodríguez, S., González, Y., Fernández-Camacho, R., de la Rosa, J., Dall’Osto, M., Prévôt, A. S. H., Hueglin, C., Harrison, R. M., and Quincey, P.: New considerations for PM, Black Carbon and particle number concentration for air quality monitoring across different European cities, Atmos. Chem. Phys., 11, 6207–6227, doi:10.5194/acp-11-6207-2011, 2011.
Seco, R., Peñuelas, J., Filella, I., Llusia, J., Schallhart, S., Metzger, A., Müller, M., and Hansel, A.: Volatile organic compounds in the western Mediterranean basin: urban and rural winter mea-surements during the DAURE campaign, Atmos. Chem. Phys., 13, 4291–4306, doi:10.5194/acp-13-4291-2013, 2013.
Solomon, P. A., Hopke, P. K., Foines, J., and Scheffe, R.: Key sci-entific and policy- and health-relevant findings from the U.S. En-vironmental Protection Agency’s Particulate Matter Supersites Program and related studies: an integration and synthesis of re-sults, J. Air Waste Manag. Assoc., 58, S3–S92, 2008.
Trippetta, S., Caggiano, R., and Telesca, L.: Analysis of particu-late matter in anthropized areas characterized by the presence of crude oil pre-treatment plants: The case study of the Agri Valley (Southern Italy), Atmos. Environ., 77, 105–116, 2013.
Van Middelaar, C. E., Dijkstra, J., Berentsen, P. B. M., and De Boer, I. J. M.: Cost-effectiveness of feeding strategies to reduce green-house gas emissions from dairy farming, J. Dairy Sci., 97, 2427– 2439, doi:10.3168/jds.2013-7648, 2014.
Wang, Y., Ren, X., Ji, D., Zhang, J., Sun, J., and Wu, F.: Characteri-zation of volatile organic compounds in the urban area of Beijing from 2000 to 2007, J. Environ. Sci., 24, 95–101, 2012.
Wongphatarakul, V., Friedlander, S. K., and Pinto, J. P.: A compar-ative study of PM2.5ambient aerosol chemical databases,