Submitted13 May 2016 Accepted 22 August 2016 Published11 October 2016
Corresponding authors
Keping Sun, [email protected] Jiang Feng, [email protected]
Academic editor David Coltman
Additional Information and Declarations can be found on page 10
DOI10.7717/peerj.2472
Copyright 2016 Liu et al.
Distributed under
Creative Commons CC-BY 4.0
OPEN ACCESS
Phylogenetic relationships and
evolutionary history of the greater
horseshoe bat,
Rhinolophus
ferrumequinum
, in Northeast Asia
Tong Liu1, Keping Sun1, Yung Chul Park2and Jiang Feng1
1Jilin Provincial Key Laboratory of Animal Resource Conservation and Utilization, Northeast
Normal University, Changchun, China
2Department of Forest Environment Protection, College of Forest and Environmental Science,
Kangwon National University, Chuncheon, South Korea
ABSTRACT
The greater horseshoe bat,Rhinolophus ferrumequinum, is an important model organ-ism for studies on chiropteran phylogeographic patterns. Previous studies revealed the population history ofR. ferrumequinumfrom Europe and most Asian regions, yet there continue to be arguments about their evolutionary process in Northeast Asia. In this study, we obtained mitochondrial DNA cytband D-loop data ofR. ferrumequinum from Northeast China, South Korea and Japan to clarify their phylogenetic relationships and evolutionary process. Our results indicate a highly supported monophyletic group of Northeast Asian greater horseshoe bats, in which Japanese populations formed a single clade and clustered into the mixed branches of Northeast Chinese and South Korean populations. We infer thatR. ferrumequinumin Northeast Asia originated in Northeast China and South Korea during a cold glacial period, while some ancestors likely arrived in Japan by flying or land bridge and subsequently adapted to the local environment. Consequently, during the warm Eemian interglaciation, the Korea Strait, between Japan and South Korea, became a geographical barrier to Japanese and inland populations, while the Changbai Mountains, between China and North Korea, did not play a significant role as a barrier between Northeast China and South Korea populations.
SubjectsBiogeography, Evolutionary Studies
Keywords Rhinolophus, Phylogeography, Mitochondrial DNA, Northeast Asia
INTRODUCTION
present sea level (Lambeck, Esat & Potter, 2002). Land bridges appeared in several parts of the world, which inevitably led to range changes for most living organisms (Hewitt, 2000). Consequently, organisms adapted to different environments and new neighbors, causing genetic variation, both through selection and drift, and ultimately speciation (Harrison, 1993;Hewitt, 2000).
The greater horseshoe bat,Rhinolophus ferrumequinum(Rhinolophidae,Rhinolophus), is widely distributed in northern Africa, southern Europe, and Asia (Csorba, Ujhelyi & Thomas, 2003). In China, it ranges from northeastern to southwestern regions (Wang, 2003). Previous studies have revealed the impact of glaciations on their geographic patterns in Europe and most Asian regions (Rossiter et al., 2000;Rossiter et al., 2007; Bilgin et al., 2009;Flanders et al., 2009;Flanders et al., 2011), but little is known about this species from Northeast Asia.Flanders et al. (2009)andFlanders et al. (2011)showed that R. ferrumequinumfrom the Jilin Province of China was affiliated with those from Japan based on the mtDNAND2gene, which suggests greater horseshoe bats might move between east China and Japan using South Korea as a stepping-stone (Flanders et al., 2009) or by the Korean Peninsula-Japanese land bridge during glacial periods (Flanders et al., 2011). However, no Korean samples and only one sample from Jilin Province were analyzed in theFlanders et al. (2009)andFlanders et al. (2011)studies. Their results indicated that the Jilin Province sample was located in the East clade of China, whereasSun et al. (2013) showed that all samples from the Jilin Province were divided into another Northeast clade based on the mtDNA D-loop region. Therefore, it is necessary to combine more samples from Northeast China, South Korea and Japan to investigate the population evolutionary process ofR. ferrumequinumin Northeast Asia.
Natural landscape features, such as mountains and rivers, can function as genetic boundaries and shape the population structure of animals by hindering dispersal and gene flow (Funk et al., 2008;Bilgin et al., 2009;Fünfstück et al., 2014). ForR. ferrumequinum in Northeast Asia, the Yalu River and Changbai Mountains separated the populations from Northeast China and Korean Peninsula. Additionally, the Korea Strait separated the populations in Korea from those in Japan.Koh et al. (2014)considered that the Yalu River and Changbai Mountains did not play a role as physical barriers for Korean and adjacent Northeast Chinese populations inR. ferrumequinumbased on mtDNA cytbgene. However, only one sample from Northeast China was included in their analyses.
In this study, we collected and sequenced mtDNA cytband blank D-loop sequences of additional R. ferrumequinumsamples from Northeast China and South Korea, and analyzed them with all of the previously published mtDNA sequences from China, Japan and South Korea. Our aims were to (i) clarify the phylogenetic relationships of R. ferrumequinumin Northeast Asia, (ii) infer the evolutionary process in Northeast Asia and (iii) detect whether the Changbai Mountains and Korea Strait act as geographical barriers forR. ferrumequinum.
MATERIALS AND METHODS
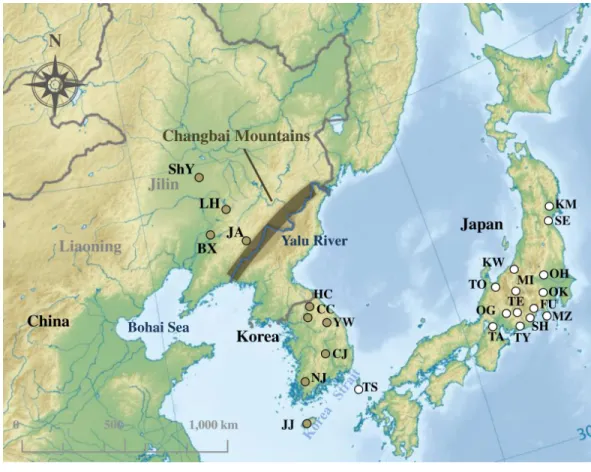
Figure 1 Sampling localities ofRhinolophus ferrumequinumin this study.The colors of sampling points fit with clades identified inFig. 2. Locality codes are identical to those inTable S1. Map uploaded to Wikimedia Commons by Ksio unde the GNU Free Documentation License.
respectively. A total of 76 sequences (63 cyt bsequences and 13 D-loop sequences) of R. ferrumequinumwere collected from Japan, South Korea and China (Fig. 1;Table S1). For the D-loop region, our study did not include the sequences from Japan because no D-loop sequence of JapaneseR. ferrumequinumwas deposited in GenBank. All field studies were approved by National Animal Research Authority in Northeast Normal University, China (approval number: NENU-20080416).
Previous studies and this study show South Korean, Japanese and Northeast Chinese R. ferrumequinumhave very low genetic divergence (Sakai, Kikkawa & Tsuchiya, 2003;Koh et al., 2014). Therefore, we regard bats from South Korea, Japan or Northeast China as a single geographic population.
DNA extraction and amplification
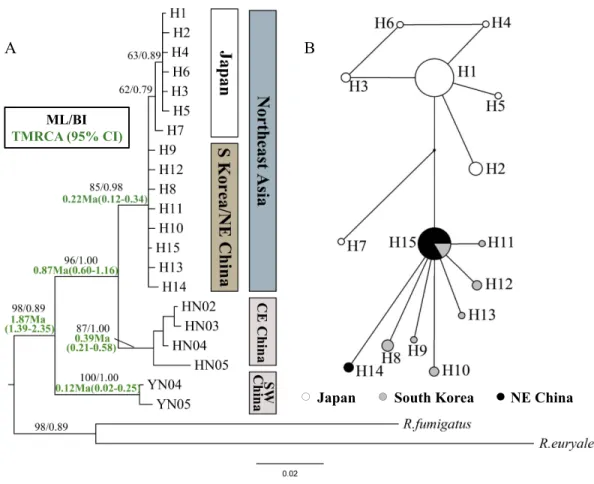
Figure 2 Phylogenetic trees and network forRhinolophus ferrumequinumpopulations based on cyt
bhaplotypes.(A) Phylogenetic trees constructed by ML and BI methods. (B) Median-joining network for the East AsianR. ferrumequinumhaplotypes. The circle size is proportional to the frequency of that haplotype. Small black dots represent missing haplotypes. Locality codes and haplotype are described in
Tables S1andS2, respectively.
and aligned using Geneious v8.0.2 (Kearse et al., 2012), and then were assembled by eye. Sequence data were deposited in GenBank (accession number:KX237527–KX237538and
KX237546).
Genetic diversity
Haplotype diversity, nucleotide diversity and polymorphic sites of each population were calculated based on cytband D-loop sequences, respectively. The gene flow was calculated using cytbgene sequences based on the equation: Fst=1/(1+4 Nm). All calculations were carried out using DnaSP v4.0 (Rozas et al., 2003). Pairwise distances between populations were obtained using Kimura-2-Parameter (K2P) distance model (Kimura, 1980), with 1,000 bootstrap replications, using MEGA v5.0 (Tamura et al., 2013).
Phylogenetic analysis
a BioNJ tree by default (Gascuel, 1997), and statistical support for branching patterns was estimated by bootstrap with 1,000 replicates. BI was run with four Markov Chains Monte Carlo (MCMC), each of 1×10⁷generations, sampled every 100 generations. Two congeneric species from the Afro-Paleartic clade, Rhinolophus euryale (GenBank nos.
EU436671andKF031268) andR. fumigatus(GenBank nos.EU436678andKU531336)
were used as outgroups.
ML and BI methods are sensitive to nucleotide substitution models, which can be estimated by jModelTest v0.1 (Posada, 2008). According to the Akaike information criterion (AIC) (Posada & Buckley, 2004), the HKY+G (transition/transversion=12.9820; gamma shape=0.1510) and HKY+G (transition/transversion=4.5832; gamma shape=0.1840) were selected for cytband D-loop, respectively.
The program NETWORK v4.6 (Bandelt, Forster & Röhl, 1999) was used to build a maximum parsimony network using the median-joining method which simplified same-possible trees and removed redundant nodes and connections (Puizina et al., 2013) as well as represented the intraspecific genetic variation (Posada & Crandall, 2001).
In order to estimate divergent time, the time to the most recent common ancestor (TMRCA) was estimated using BEAST v1.6 (Drummond & Rambaut, 2007) under a strict clock and a constant-size tree prior. The chain was run for 1×10⁷generations, with the ESS values >200 taken as evidence for convergence. Cytbgene was chosen to calculate TMRCA because of its moderate evolutionary rate. A mean substitution rate of 1.3% per million years (Nabholz, Glemin & Galtier, 2008), used inHipposideros turpiscomplex (Thong et al., 2012),Hipposideros commersoni(Rakotoarivelo et al., 2015) andMyotis natterericomplex (Puechmaille et al., 2012), was used in this analysis.
Demographic analysis
The demographic expansion of Northeast Asian R. ferrumequinum was examined in Arlequin v3.1 (Schneider, Roessli & Excoffier, 2000). Tajima’sD(Tajima, 1989) and Fu’sFs tests (Fu, 1997) were employed to confirm neutral expectation based on 1,000 coalescent simulations. Significant negative Tajima’sDand Fu’sFsvalues indicate a sudden expansion, whereas significant positive values indicate processes such as population subdivision or recent bottlenecks. When the values are nearly zero, they represent a population of constant size (Liao et al., 2010) The raggedness index (Hri;Harpending, 1994) and sum of squared deviations (SSD;Schneider & Excoffier, 1999) were generated with 10,000 replicates parametric bootstrapping. Hri was calculated to describe the smoothness of observed mismatch distribution. The small value means a population has experienced a sudden expansion event, and the higher value indicates a stationary or bottlenecked population (Harpending, 1994;Liao et al., 2010). SSD value was used to describe the goodness-of-fit of observed mismatch distribution to that expected under the spatial expansion model. A non-significant SSD value (PSSD>0.05) suggests a good fitness (Excoffier, Laval &
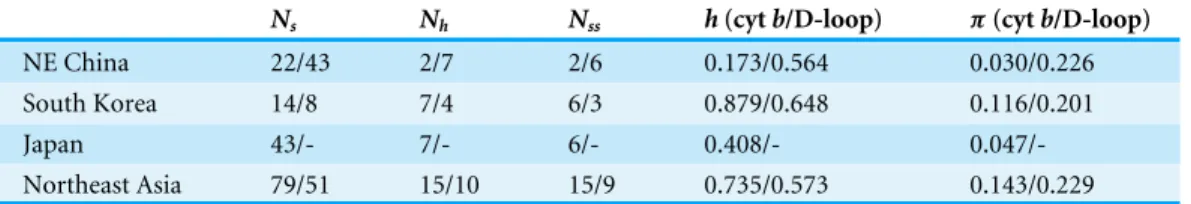
Table 1 Genetic diversity ofRhinolophus ferrumequinumin Northeast Asia.
Ns Nh Nss h(cytb/D-loop) π(cytb/D-loop)
NE China 22/43 2/7 2/6 0.173/0.564 0.030/0.226 South Korea 14/8 7/4 6/3 0.879/0.648 0.116/0.201
Japan 43/- 7/- 6/- 0.408/-
0.047/-Northeast Asia 79/51 15/10 15/9 0.735/0.573 0.143/0.229
Notes.
Ns, the number of sequences;Nh, the number of haplotypes;Nss, the number of segregating sites;h, haplotype diversity;π,
nu-cleotide diversity; -, missing data.
If the expansion was detected, the time of expansion in generations (t) can be estimated by the equation,τ=2ut, whereτ (tau) is the time to expansion in mutational units andu is the mutation rate per generation for the DNA sequence being studied. Cytbmutation rate is 1.3% per million years (Nabholz, Glemin & Galtier, 2008), and the generation time is two years (Ransome, 1995).
RESULTS
Genetic diversity and divergence
A total of 85 sequences based on the cytbgene (1,140 bp) and 62 sequences based on D-loop region (465 bp) were obtained and analyzed (Table S1). For the cytbgene, 15 different haplotypes were identified from 79 sequences of Northeast AsianR. ferrumequinum. The Japanese population had 7 unique haplotypes, while Chinese and South Korean populations shared haplotype H15, which was the most shared haplotype. For D-loop region, 10 unique haplotypes were identified from 51 sequences ofR. ferrumequinumin Northeast Asia. H9 was shared by individuals from Ji’an and Benxi in Northeast China, whereas H10 was shared by most individuals and populations (including individuals in all four localities of China and some individuals in South Korea) (Table S2).
Within cytband D-loop haplotypes, there were 15 (1.3%) and 9 (2.0%) polymorphic sites, respectively, and 10 (0.87%) and 5 (1.1%) parsimonious informative sites, respectively. Genetic diversity of the South Korean population was the highest, while that of the Northeast Chinese population was the lowest (Table 1).
The cytbdivergence of Northeast AsianR. ferrumequinumwas lower than 1%. The average K2P distances between populations from Northeast China and South Korea (0.07%) were lower than those between Japanese and other Northeast Asian populations (0.21–0.26%). Furthermore, the gene flow between South Korea and Northeast China (Nm ≥3) was highest, which was enough to prevent genetic divergence caused by genetic drift (Slatkin, 1987;Yang, Ma & Wu, 2011). However, the gene flow levels between Japanese and the other Northeast Asian populations were low (Table 2).
Phylogenetic relationships and TMRCA
Table 2 Average K2P distance (%) and gene flow ofRhinolophus ferrumequinumbased on cytb se-quences.
Population NE China South Korea Japan Henan Yunnan
NE China 3.11 0.6 0.06 0.01
South Korea 0.7 0.11 0.06 0.01
Japan 0.21 0.26 0.05 0.01
Henan 1.44 2.01 2.15 0.03
Yunnan 3.96 4.02 4.17 4.27
Notes.
Nm: above the diagonal; Average K2P distance (%): below the diagonal.
haplotypes was much less resolved, likely due to only a few mutations. Japanese haplotypes formed their own clade, but with relatively low bootstrap values (62/79% in ML/BI, respectively) (Fig. 2A). The Japanese clade clustered into the mixed branches of South Korean and Northeast Chinese haplotypes. The haplotypes of Northeast Asia were sister to those of the Central-East China (Fig. 2A). The haplotype network showed similar relationships with the phylogenetic trees, while showing the relationship between the haplotypes more clearly (Fig. 2B).
The noncoding D-loop region generally provides sufficient variation for studies at intraspecific level (Qu et al., 2009). However, in the phylogenetic tree and haplotype network based on D-loop region, the Northeast Chinese haplotypes were hardly separated from South Korean haplotypes (Fig. 3).
The TMRCA of all examinedR. ferrumequinumindividuals could be dated to 1.87 Ma (95% CI [1.39–2.35] Ma). The TMRCA estimates obtained for Clade CE China/Northeast Asia were 0.87 Ma (95% CI [0.60–1.16] Ma). For East AsianR. ferrumequinum, the TMRCA was 0.22 Ma (95% CI [0.12–0.34] Ma), which could be traced back to the late Pleistocene.
Historical demography
Mismatch distribution analysis based on cytbrevealed different historical demography. Japanese and South Korean populations failed to reject the model of population expansion based on Hri, SSD (PSSD>0.05,PHri>0.05) (Table 3) and their smooth or unimodal
mismatch distributions (Fig. S1). The significant negative Fu’sFsvalue also indicate a sudden expansion. The most recent expansion times were estimated to be 0.15 Ma (95% CI [0.05–0.27] Ma) and 0.12 Ma (95% CI [0.03–0.20] Ma) for Japanese and South Korean populations, respectively. However, the high Hri, non-significant positive Fu’s Fsvalue and multiple mismatch distribution of Northeast Chinese population suggests a stable population history or population bottlenecks (Liao et al., 2010) (Table 3,Fig. S1).
DISCUSSION
Figure 3 Phylogenetic trees and network forRhinolophus ferrumequinumpopulations based on D-loop haplotypes. (A) Phylogenetic trees constructed by ML and BI methods. The D-loop data of Japanese population was unavailable. (B) Median-joining network for the South Korean and Northeast Chinese
R. ferrumequinumhaplotypes. The circle size is proportional to the frequency of that haplotype. Small black dots represent missing haplotypes. Locality codes and haplotype are described inTables S1andS2, respectively.
Table 3 Results of mismatch distribution analyses and neutrality tests forRhinolophus ferrumequinumbased on cytbsequences.
SSD Hri Tau (95%CI) t(95%CI) Tajima’sD Fu’sFs
NE China 0.04 0.74 3.00 (0.55–3.00) - −0.84 0.81 South Korea 0.07 0.35 1.71 (0.43–2.98) 0.12 Ma (0.03–0.20 Ma) −1.73* −5.26**
Japan 0.04 0.16 2.27 (0.75–3.94) 0.15 Ma (0.05–0.27 Ma) −0.73 −5.58**
Notes.
Hri, raggedness index; SSD, sum of squared deviations; NA, data deficiencies; -, no expansion was detected. *Statistically significant results are indicated byP<0.05.
**Statistically significant results are indicated byP<0.01.
from Shandong Province by the Bohai Sea, as this is the shortest way and the Bohai Sea would have disappeared if the sea level dropped 120 m (Ray & Adams, 2001). Furthermore, haplotype network seemed to support this scenario, where H15 is a more likely ancestor haplotype occupying the center of the network with numerous connects (Fig. 2B).
In Northeast China, the population might have undergone a founder effect due to its low genetic diversity. However, a specific haplotype H14 was detected in Northeast China, which may be not congruent with this notion. Instead, combining the high Hri and non-significant positive Fu’sFsvalue, we inferred a bottlenecked event may have occurred in Northeast China (Liao et al., 2010). In regard to the South Korean population, we compared previous studies on R. ferrumequinum (Flanders et al., 2011; Sun et al., 2013;Koh et al., 2014) and found an expanding event was first detected at 0.12 Ma (95% CI [0.03–0.20] Ma), which corresponds to the relatively warm Eemian interglaciation (0.12–0.13 Ma) in the Pleistocene
The Changbai Mountains are the boundary of Northeast China and Korean Peninsula. Extremely low genetic divergence and high gene flow level between populations from Northeast China and South Korea suggest that the Changbai Mountains have not acted as a geographic barrier. In previous studies,Sun et al. (2013)andFlanders et al. (2011)found the Qinling Mountains have played an important role in forming different lineages of R. ferrumequinum bats; however,Rossiter et al. (2007) considered the Pyrenees (above 2,000 m) have not hindered gene flow of R. ferrumequinum andBilgin et al. (2009) showed the Taurus Mountains and eastern Anatolian Diagonal Mountain Chain have not limited the western clade of R. ferrumequinum bats’ distribution. Therefore, the isolation effect of different mountains is variable. Moreover, we cannot rule out other reasons, such as incomplete lineage sorting and ancestral polymorphism, which can also cause low divergence between populations from Northeast China and South Korea (Flanders et al., 2009).
In our study, the Japanese population formed a single sub-clade and diverged more recently than the populations from Northeast China and South Korea (Fig. 2A), which is in contrast to theFlanders et al. (2009)andFlanders et al. (2011)studies.Flanders et al. (2009) considered thatR. ferrumequinumcolonized East China from Japan. However, our results indicate that the Japanese population colonized more recently from Eurasian continent. It was determined that the Korea Strait is about 130 m deep, so the land bridge can only be formed during main glacial period (McKay, 2012).Ohshima (1990)mentioned that the Korean Peninsula-Japanese land bridge was estimated to have remained in place until 0.15 Ma (also seeWatanobe, Ishiguro & Nakano, 2003). Thus, we inferred that the emergence of the land bridge favored someR. ferrumequinumbats to colonize Japan from Northeast China and South Korea. Additionally, other mammals, such as the Japanese wild boar (Sus scrofa leucomystax) (Watanobe, Ishiguro & Nakano, 2003), sika deer (Cervus nippon) (Nagata et al., 1999) and Asian black bear (Ursus thibetanus) (Ohnishi et al., 2009) were found to colonize Japan from Eurasian continent via the Korean Peninsula–Japanese land bridge (Flanders et al., 2011).
a narrow seaway (about 20 km wide) in Korea Strait connecting the East China Sea and the East Japan Sea (Park et al., 2000). Bats ofR. ferrumequinumare able to fly up to 30 km between the winter and summer roosts, with the longest recorded movement being 180 km (Paz, Fernandez & Benzal, 1986).Bilgin et al. (2009)found the Marmara Sea (70 km) does not seem to limit the dispersal inR. ferrumequinum. Although a narrow seaway would have been present,R. ferrumequinumfrom the Eurasian continent could go through the Korea Strait and enter Japan during the glacial period.Rhinolophus ferrumequinumin Japan might have expanded at 0.15 Ma (95% CI [0.05–0.27] Ma), which is consistent with the expansion time (0.13–0.19 Ma) calculated by Flanders et al. (2011). This expansion time is in the Saale glaciation, which suggests Japan might act as a refuge for mammals in Northeast Asia during glacial periods.
With the arrival of the Eemian interglaciation (0.12–0.13 Ma), the temperature increased gradually, resulting in rising sea levels. The Korea Strait became a natural barrier which isolated JapaneseR. ferrumequinumfrom other Eurasian continental populations. Other studies also show gene flow can be hindered by water bodies, such as the Taiwan Strait (131 km) and English Channel (100 km) (Chen et al., 2006;Rossiter et al., 2007). The wider Korea Strait (180 km) was inferred to play an important role in acting as a barrier to hinder the gene flow between Japanese and Eurasian continental populations.
ACKNOWLEDGEMENTS
We would like to thank Tinglei Jiang and Guanjun Lu who worked hard with us in the field to collect the samples used in this study. We are especially grateful to Katy Parise for her kind help with language modification. We would also like to thank Ying Tang for the lab work.
ADDITIONAL INFORMATION AND DECLARATIONS
Funding
This work was supported by the National Natural Science Foundation of China (Grant Nos. 31370399, 30900132 and 31270414), Specialized Research Fund for the Doctoral Program of Higher Education (Grant No. 20120043130002) and the Fundamental Research Funds for the Central Universities (Grant No. 2412016KJ045). The funders had no role in study design, data collection and analysis, decision to publish, or preparation of the manuscript.
Grant Disclosures
The following grant information was disclosed by the authors:
The National Natural Science Foundation of China: 31370399, 30900132, 31270414. Specialized Research Fund for the Doctoral Program of Higher Education: 20120043130002. The Fundamental Research Funds for the Central Universities: 2412016KJ045.
Competing Interests
Author Contributions
• Tong Liu performed the experiments, analyzed the data, wrote the paper, prepared figures and/or tables.
• Keping Sun conceived and designed the experiments, contributed reagents/materials/-analysis tools, wrote the paper, reviewed drafts of the paper.
• Yung Chul Park and Jiang Feng reviewed drafts of the paper.
Animal Ethics
The following information was supplied relating to ethical approvals (i.e., approving body and any reference numbers):
National Animal Research Authority in Northeast Normal University, China (approval number: NENU-20080416).
DNA Deposition
The following information was supplied regarding the deposition of DNA sequences: GenBank nos.KX237527–KX237538andKX237546.
Data Availability
The following information was supplied regarding data availability: The raw data has been supplied asSupplemental Information.
Supplemental Information
Supplemental information for this article can be found online athttp://dx.doi.org/10.7717/ peerj.2472#supplemental-information.
REFERENCES
Avise JC. 2000.Phylogeography: the history and formation of species. Harvard: Harvard
University Press.
Bandelt HJ, Forster P, Röhl A. 1999.Median-joining networks for inferring
in-traspecific phylogenies.Molecular Phylogenetics and Evolution16:37–48
DOI 10.1093/oxfordjournals.molbev.a026036.
Bilgin R, Çoraman E, Karata¸s A, Morales JC. 2009.Phylogeography of the greater
horse-shoe bat,Rhinolophus ferrumequinum(Chiroptera: Rhinolophidae), in Southeastern Europe and Anatolia, with a specific focus on whether the sea of marmara is a barrier to gene flow.Acta Chiropterologica11:53–60DOI 10.3161/150811009X465686.
Capinera J. 2011.Insects and wildlife: arthropods and their relationships with wild
vertebrate animals. Hoboken: John Wiley & Sons.
Chen SF, Rossiter SJ, Faulkes CG, Jones G. 2006.Population genetic structure and
demographic history of the endemic Formosan lesser horseshoe bat (Rhinolophus monoceros).Molecular Ecology15:1643–1656DOI 10.1111/j.1365-294X.2006.02879.x.
Csorba G, Ujhelyi P, Thomas N. 2003.Horseshoe bats of the world: (Chiroptera:
Rhi-nolophidae). Shropshire: Alana Books.
Drummond AJ, Rambaut A. 2007.BEAST: Bayesian evolutionary analysis by sampling
Ehlers J, Gibbard PL, Hughes PD. 2011.Quaternary glaciations-extent and chronology: a closer look. Oxford: Elsevier.
Excoffier L, Laval G, Schneider S. 2005.ARLEQUIN ver. 3.0: an integrated software
package for population genetics data analysis.Evolutionary Bioinformatics1:47–50.
Flanders J, Jones G, Benda P, Dietz C, Zhang S, Li G, Sharifi M, Rossiter SJ. 2009.
Phy-logeography of the greater horseshoe bat,Rhinolophus ferrumequinum: contrasting results from mitochondrial and microsatellite data.Molecular Ecology18:306–318
DOI 10.1111/j.1365-294X.2008.04021.x.
Flanders J, Wei L, Rossiter SJ, Zhang S. 2011.Identifying the effects of the Pleistocene on
the greater horseshoe bat,Rhinolophus ferrumequinum, in East Asia using ecological niche modelling and phylogenetic analyses.Journal of Biogeography38:439–452
DOI 10.1111/j.1365-2699.2010.02411.x.
Fu YX. 1997.Statistical tests of neutrality of mutations against population growth,
hitchhiking and background selection.Genetics147:915–925.
Fünfstück T, Arandjelovic M, Morgan DB, Sanz C, Breuer T, Stokes EJ, Reed P, Olson
SH, Cameron K, Ondzie A. 2014.The genetic population structure of wild western
lowland gorillas (Gorilla gorilla gorilla) living in continuous rain forest.American Journal of Primatology76:868–878DOI 10.1002/ajp.22274.
Funk WC, Forsman ED, Mullins TD, Haig SM. 2008.Landscape features shape genetic
structure in threatened Northern Spotted Owls. United States: Geological Survey.
Gascuel O. 1997.BIONJ: an improved version of the NJ algorithm based on a simple
model of sequence data.Molecular Biology and Evolution14:685–695
DOI 10.1093/oxfordjournals.molbev.a025808.
Guindon S, Dufayard JF, Lefort V, Anisimova M, Hordijk W, Gascuel O. 2010.New
algorithms and methods to estimate maximum-likelihood phylogenies: assessing the performance of PhyML3.0.Systematic Biology59:307–321
DOI 10.1093/sysbio/syq010.
Harpending HC. 1994.Signature of ancient population growth in a low-resolution
mitochondrial DNA mismatch distribution.Human Biology 66:591–600.
Harrison RG. 1993.Hybrid zones and the evolutionary process. Oxford: Oxford University
Press on Demand.
Hewitt G. 2000.The genetic legacy of the Quaternary ice ages.Nature405:907–913
DOI 10.1038/35016000.
Irwin DM, Kocher TD, Wilson AC. 1991.Evolution of the cytochromebgene of
mammals.Journal of Molecular Evolution32:128–144DOI 10.1007/BF02515385.
Kearse M, Moir R, Wilson A, Stones-Havas S, Cheung M, Sturrock S, Buxton S, Cooper
A, Markowitz S, Duran C. 2012.Geneious basic: an integrated and extendable
desktop software platform for the organization and analysis of sequence data. Bioinformatics28:1647–1649DOI 10.1093/bioinformatics/bts199.
Kimura M. 1980.A simple method for estimating evolutionary rates of base substitutions
through comparative studies of nucleotide sequences.Journal of Molecular Evolution
Koh HS, Jo JE, Oh JG, Kweon GH, Ahn NH, Sin WH, Sin DS. 2014.Little genetic divergence of the greater horseshoe batRhinolophus ferrumequinumfrom far-eastern Asia, with a preliminary report on genetic differentiation ofR. ferrumequinum from Eurasia and northern Africa examined from cytochromebsequences.Russian Journal of Theriology13:97–103.
Lambeck K, Esat TM, Potter E-K. 2002.Links between climate and sea levels for the past
three million years.Nature419:199–206DOI 10.1038/nature01089.
Li SH, Yeung CL, Feinstein J, Han L, Le MH, Wang CX, Ding P. 2009.Sailing through
the Late Pleistocene: unusual historical demography of an East Asian endemic, the Chinese Hwamei (Leucodioptron canorum canorum), during the last glacial period. Molecular Ecology 18:622–633DOI 10.1111/j.1365-294X.2008.04028.x.
Liao PC, Kuo DC, Lin CC, Ho KC, Lin TP, Hwang SY. 2010.Historical spatial range
expansion and a very recent bottleneck ofCinnamomum kanehiraeHay. (Lau-raceae) in Taiwan inferred from nuclear genes.BMC Evolutionary Biology10(1):1
DOI 10.1186/1471-2148-10-1.
Lisiecki LE, Raymo ME. 2005.A Pliocene-Pleistocene stack of 57 globally distributed
benthicδ18O records.Paleoceanography20:1–17DOI 10.1029/2004PA001071.
McKay BD. 2012.A new timeframe for the diversification of Japan’s mammals.Journal of
Biogeography 39:1134–1143DOI 10.1111/j.1365-2699.2011.02666.x.
Molodkov AN, Bolikhovskaya NS. 2002.Eustatic sea-level and climate changes over
the last 600 ka as derived from mollusc-based ESR-chronostratigraphy and pollen evidence in Northern Eurasia.Sedimentary Geology150:185–201
DOI 10.1016/S0037-0738(01)00275-5.
Nabholz B, Glemin S, Galtier N. 2008.Strong variations of mitochondrial mutation
rate across mammals—the longevity hypothesis.Molecular Biology and Evolution
25:120–130DOI 10.1093/molbev/msm248.
Nagata J, Masuda R, Tamate HB, Hamasaki S-i, Ochiai K, Asada M, Tatsuzawa S, Suda
K, Tado H, Yoshida MC. 1999.Two genetically distinct lineages of the sika deer,
Cervus nippon, in Japanese islands: comparison of mitochondrial D-loop region sequences.Molecular Phylogenetics and Evolution13:511–519
DOI 10.1006/mpev.1999.0668.
Ohnishi N, Uno R, Ishibashi Y, Tamate H, Oi T. 2009.The influence of climatic
oscillations during the Quaternary Era on the genetic structure of Asian black bears in Japan.Heredity102:579–589 DOI 10.1038/hdy.2009.28.
Ohshima K. 1990.The history of straits around the Japanese Islands in the
late-Quaternary.The Quaternary Research29:193–208DOI 10.4116/jaqua.29.193.
Park S-C, Yoo D-G, Lee C-W, Lee E-I. 2000.Last glacial sea-level changes and
paleogeog-raphy of the Korea (Tsushima) Strait.Geo-Marine Letters20:64–71
DOI 10.1007/s003670000039.
Paz Od, Fernandez R, Benzal J. 1986.El anillamiento de quiropteros en el centro de
Posada D. 2008.jModelTest: phylogenetic model averaging.Molecular Biology and Evolution25:1253–1256DOI 10.1093/molbev/msn083.
Posada D, Buckley TR. 2004.Model selection and model averaging in phylogenetics:
advantages of Akaike information criterion and Bayesian approaches over likelihood ratio tests.Systematic Biology 53:793–808DOI 10.1080/10635150490522304.
Posada D, Crandall KA. 2001.Selecting the best-fit model of nucleotide substitution.
Systematic Biology 50:580–601DOI 10.1080/106351501750435121.
Puechmaille SJ, Allegrini B, Boston ESM, Dubourg-Savage M-J, Evin A, Knochel A,
Bris YL, Lecoq V, Lemaire M, Rist D, Teeling EC. 2012.Genetic analyses reveal
further cryptic lineages within theMyotis nattererispecies complex.Mammalian Biology77:224–228DOI 10.1016/j.mambio.2011.11.004.
Puizina J, Puljas S, Fredotović Ž, Šamanić I, Pleslić G. 2013.Phylogenetic relationships
among populations of the Vineyard SnailCernuella virgata(Da Costa, 1778).ISRN Zoology2013:1–9DOI 10.1155/2013/638325.
Qu J, Liu N, Bao X, Wang X. 2009.Phylogeography of the ring-necked pheasant
(Phasianus colchicus) in China.Molecular Phylogenetics and Evolution52:125–132
DOI 10.1016/j.ympev.2009.03.015.
Qu Y, Zhao Q, Lu H, Ji X. 2014.Population dynamics following the last glacial maximum
in two sympatric lizards in Northern China.Asian Herpetological Research5:213–227
DOI 10.3724/SP.J.1245.2014.00213.
Rakotoarivelo AR, Willows-Munro S, Schoeman MC, Lamb JM, Goodman SM.
2015.Cryptic diversity inHipposideros commersonisensu stricto (Chiroptera:
Hipposideridae) in the western portion of Madagascar.BMC Evolutionary Biology
15(1):1DOI 10.1186/s12862-014-0274-0.
Ransome RD. 1995.Earlier breeding shortens life in female greater horseshoe bats.
Philosophical Transactions of the Royal Society of London B: Biological Sciences
350:153–161DOI 10.1098/rstb.1995.0149.
Ray N, Adams JM. 2001.A GIS-based vegetation map of the world at the last glacial
maximum (25,000-15,000 BP).Internet Archaeology 11:1–44DOI 10.11141/ia.11.2.
Rogers AR, Harpending H. 1992.Population growth makes waves in the distribution of
pairwise genetic differences.Molecular Biology & Evolution9:552–569.
Rohling EJ, Fenton M, Jorissen FJ, Bertrand P, Ganssen G, Caulet JP. 1998.
Mag-nitudes of sea-level lowstands of the past 500,000 years.Nature394:162–165
DOI 10.1038/28134.
Ronquist F, Huelsenbeck JP. 2001.MRBAYES: Bayesian inference of phylogenetic trees.
Bioinformatics17:754–755DOI 10.1093/bioinformatics/17.8.754.
Ronquist F, Huelsenbeck JP. 2003.MrBayes 3: Bayesian phylogenetic inference under
mixed models.Bioinformatics19:1572–1574DOI 10.1093/bioinformatics/btg180.
Rossiter SJ, Benda P, Dietz CN, Zhang S, Jones G. 2007.Rangewide phylogeography
in the greater horseshoe bat inferred from microsatellites: implications for pop-ulation history, taxonomy and conservation.Molecular Ecology16:4699–4714
Rossiter SJ, Jones G, Ransome RD, Barratt EM. 2000.Genetic variation and population structure in the endangered greater horseshoe batRhinolophus ferrumequinum. Molecular Ecology 9:1131–1135DOI 10.1046/j.1365-294x.2000.00982.x.
Rozas J, Sánchez-DelBarrio JC, Messeguer X, Rozas R. 2003.DnaSP, DNA
polymor-phism analyses by the coalescent and other methods.Bioinformatics19:2496–2497
DOI 10.1093/bioinformatics/btg359.
Sakai T, Kikkawa Y, Tsuchiya K. 2003.Molecular phylogeny of Japanese Rhinolophidae
based on variations in the complete sequence of the mitochondrial cytochromeb gene.Genes & Genetic Systems78:179–189DOI 10.1266/ggs.78.179.
Schneider S, Excoffier L. 1999.Estimation of past demographic parameters from the
distribution of pairwise differences when the mutation rates vary among sites: application to human mitochondrial DNA.Genetics152:1079–1089.
Schneider S, Roessli D, Excoffier L. 2000.Arlequin: a software for population genetics
data analysis. Geneva: University of Geneva. Available athttp:// www.cmpg.unibe. ch/ software/ arlequin/ archive/ website/ software/ 2.000/ manual/ Arlequin.pdf.
Slatkin M. 1987.Gene flow and the geographic structure of natural populations.Science
236:787–792DOI 10.1126/science.3576198.
Sun K, Luo L, Kimball RT, Wei X, Jin L, Jiang T, Li G, Feng J. 2013.Geographic
variation in the acoustic traits of greater horseshoe bats: testing the importance of drift and ecological selection in evolutionary processes.PLoS ONE 8:e70368
DOI 10.1371/journal.pone.0070368.
Tajima F. 1989.Statistical method for testing the neutral mutation hypothesis by DNA
polymorphism.Genetics123:585–595.
Tamura K, Stecher G, Peterson D, Filipski A, Kumar S. 2013.MEGA6: molecular
evolu-tionary genetics analysis version 6.0.Molecular Biology and Evolution30:2725–2729
DOI 10.1093/molbev/mst197.
Thong VD, Puechmaille SJ, Denzinger A, Bates PJJ, Dietz C, Csorba G, Soisook P,
Teeling EC, Matsumura S, Furey NM, Schnitzler H-U. 2012.Systematics of the
Hipposideros turpiscomplex and a description of a new subspecies from Vietnam. Mammal Review42:166–192DOI 10.1111/j.1365-2907.2011.00202.x.
Wang Y. 2003.A complete checklist of mammal species and subspecies in China: a
taxo-nomic and geographic reference. Beijing: China Forestry Publishing House.
Watanobe T, Ishiguro N, Nakano M. 2003.Phylogeography and population structure
of the Japanese wild boarSus scrofa leucomystax: mitochondrial DNA variation. Zoological Science20:1477–1489DOI 10.2108/zsj.20.1477.
Wilkinson GS, Chapman AM. 1991.Length and sequence variation in evening bat
D-loop mtDNA.Genetics128:607–617.
Yang M, Ma Y, Wu J. 2011.Mitochondrial genetic differentiation across populations of
the malaria vectorAnopheles lesterifrom China (Diptera: Culicidae).Malaria Journal