Increasing Protein Molecular Mass More Rapidly than
Those of Other Proteins
Anna V. Glyakina1,2, Natalya S. Bogatyreva1, Oxana V. Galzitskaya1*
1Institute of Protein Research, Russian Academy of Sciences, Pushchino, Moscow Region, Russia,2Institute of Mathematical Problems of Biology, Russian Academy of Sciences, Pushchino, Moscow Region, Russia
Abstract
Here we present a systematic analysis of accessible surface areas and hydrogen bonds of 2554 globular proteins from four structural classes (all-a, all-b,a/banda+bproteins) that is aimed to learn in which structural class the accessible surface area increases with increasing protein molecular mass more rapidly than in other classes, and what structural peculiarities are responsible for this effect. The beta structural class of proteins was found to be the leader, with the following possible explanations of this fact. First, in beta structural proteins, the fraction of residues not included in the regular secondary structure is the largest, and second, the accessible surface area of packaged elements of the beta-structure increases more rapidly with increasing molecular mass in comparison with the alpha-structure. Moreover, in the beta structure, the probability of formation of backbone hydrogen bonds is higher than that in the alpha helix for all residues ofa+bproteins (the average probability is 0.7360.01 for the beta-structure and 0.6060.01 for the alpha-structure without proline) anda/b
proteins, except for asparagine, aspartic acid, glycine, threonine, and serine (0.7060.01 for the beta-structure and 0.6060.01 for the alpha-structure without the proline residue). There is a linear relationship between the number of hydrogen bonds and the number of amino acid residues in the protein (Number of hydrogen bonds~0:678:number of residues{3:350).
Citation:Glyakina AV, Bogatyreva NS, Galzitskaya OV (2011) Accessible Surfaces of Beta Proteins Increase with Increasing Protein Molecular Mass More Rapidly than Those of Other Proteins. PLoS ONE 6(12): e28464. doi:10.1371/journal.pone.0028464
Editor:Vladimir N. Uversky, University of South Florida College of Medicine, United States of America
ReceivedJune 5, 2011;AcceptedNovember 8, 2011;PublishedDecember 1, 2011
Copyright:ß2011 Glyakina et al. This is an open-access article distributed under the terms of the Creative Commons Attribution License, which permits unrestricted use, distribution, and reproduction in any medium, provided the original author and source are credited.
Funding:This work was supported by the programs "Molecular and Cellular Biology" (01200959110) and ‘‘Fundamental Sciences to Medicine’’, by the Russian Foundation for Basic Research (11-04-00763), by the Russian Science Support Foundation, and by a grant from the Federal Agency for Science and Innovation (#02.740.11.0295). The funders had no role in study design, data collection and analysis, decision to publish, or preparation of the manuscript.
Competing Interests:The authors have declared that no competing interests exist.
* E-mail: [email protected]
Introduction
Analysis of the accessible surface area (SASA) is a necessary element in studying protein-protein interactions and the process of protein folding. The technique of quantitative protein surface analysis using high-resolution X-ray data was first proposed by Lee and Richards [1] who analyzed the accessible surface area (SASA). In particular, using high-resolution X-ray data on 37 monomeric globular proteins with molecular masses (M) of 4-35 kDa it has been shown [2] that the dependence ofSASAonMis a power law with an extent of 0.73. For oligomeric proteins, this value was found to be 0.76 [3]. It has been demonstrated that such a dependence results from the peculiarities of the protein surface relief [4,5]. The aim of this work is to elucidate the features of these peculiarities for different ‘‘architectural’’ classes of proteins. In this study we addressed two questions: (i) what is the relationship between molecular mass and the accessible surface area of proteins from the four general structural classes, and (ii) how much the accessible surfaces vary in molecular mass, shape, and structural type.
The deviation of the power law extent from2=3in theSASA—
M dependence was considered as an indication of the protein surface fractal structure [6,7]. Strictly speaking, a surface is fractal if the dependence of the minimal number of probe bodies (balls, cubes, etc.) fully covering the surface on the probe size is a power law:
N rð Þ~const:r{D ð1Þ with the extent 2,D,3 not coinciding with the topological dimension(Dtop =2) and D being a fractal dimension [8]. The strict fractal dimension is determined at r R0. For self-similar bodies, the relationship between the fractal surface area and the value of confined volume(V)has the following power law [9]:
SMOL~const:VD3 ð2Þ
SASA is not just a geometric measure. It is also of physical significance: the extent of the gain in hydrophobic energy is proportional to the extent of reduction inSASA[10]. For this reason, SASA has become an important factor in the analyses of protein folding and protein-protein interactions [11]. It has been shown that structural determinants, taking into account both the protein shape and its size, show good agreement with experimentally observed rates of protein folding [12]. Moreover, a relationship has been established between the protein accessible surface area and the number of native contacts in its structure [13]. Hidden dependen-cies between protein structural class specific fractal dimension magnitudes and kinetic–thermodynamic parameters (folding/un-folding rate, (folding/un-folding/un(folding/un-folding free energy) were studied not long ago [14–16]. The results of this study confirmed the dependence of fractal dimension values on the fold type and on the location and connectivity of the secondary structures.
Here we offer a systematic analysis of accessible surface areas and hydrogen bonds of 2554 globular proteins with high resolution to answer the questions as to what structural class demonstrates the most rapid growth of the protein accessible surface area with concurrently increasing protein molecular mass and what structural peculiarities are responsible for such a behavior. It has been shown that accessible surface areas of proteins from the beta-structural class increase with the increasing molecular mass more rapidly than those of other classes. We have found two possible reasons for this fact: (i) all-b proteins have more amino acid residues in the irregular structure than proteins from other classes, and (ii) accessible surface areas of packaged elements of the beta-structure increase more rapidly with the
increasing molecular mass than those of the alpha-structure. Moreover, the probability of formation of backbone hydrogen bonds in the beta structure is higher than in alpha helix for practically all amino acid residues except for proline, while aspartic acid and threonine have practically equal probabilities for the two considered structures.
Materials and Methods
Preprocessing of data
We selected single-domain proteins with resolution higher than 3 A˚ and well-refined crystal structures, with less than 25% sequence identity belonging to classes a, b, c, and d (according to the SCOP classification, release 1.65) [17]. The obtained dataset includes2554proteins (see Tables 1, 2): 499 proteins from class a (all-aproteins), 656 proteins from class b (all-bproteins), 709 proteins from class c (a/b proteins), and 690 proteins from class d (a+bproteins). For selection, the general criterion was the absence of unresolved (disordered) residues.
Simultaneously, we considered the re-refined structures to demonstrate that the dependence between accessible surfaces and molecular masses described in this work was not significantly altered. The re-refined structure models were taken from the PDB_REDO databank (http://www.cmbi.ru.nl/pdb_redo/) [18]. We selected the protein structures in accordance with our dataset. As a result, we obtained1498structures: 284 proteins from class a (all-a proteins), 398 proteins from class b (all-b proteins), 427 proteins from class c (a/bproteins), and 389 proteins from class d (a+bproteins).
Table 1.Structural characteristics of 1155 globular protein domains from classesaandb.
Classa(499 proteins) Classb(656 proteins)
Range of length
Number of proteins (average length of protein)
Molecular
surface S, A˚2 Accessiblesurface S, A˚2 Molecularmass
Number of proteins (average length of protein)
Molecular
surface S, A˚2 Accessiblesurface S, A˚2 Molecularmass
51–100 170 (78) 4633663 5352674 88536119 181 (82) 4445654 5133662 90766111
101–150 192 (127) 6897667 7624685 143386123 245 (121) 6091653 6754660 133636105
151–200 77 (171) 87136117 93836142 191746214 127 (173) 8247697 88316106 192026157
201–250 22 (223) 108696241 113206287 253566389 47 (218) 101386186 106956240 240266223
251–300 21 (278) 128346380 131316414 311616495 33 (273) 121376234 124276281 302146306
301–350 17 (324) 144546347 143526339 366156510 23 (326) 136326319 136796353 357016429
doi:10.1371/journal.pone.0028464.t001
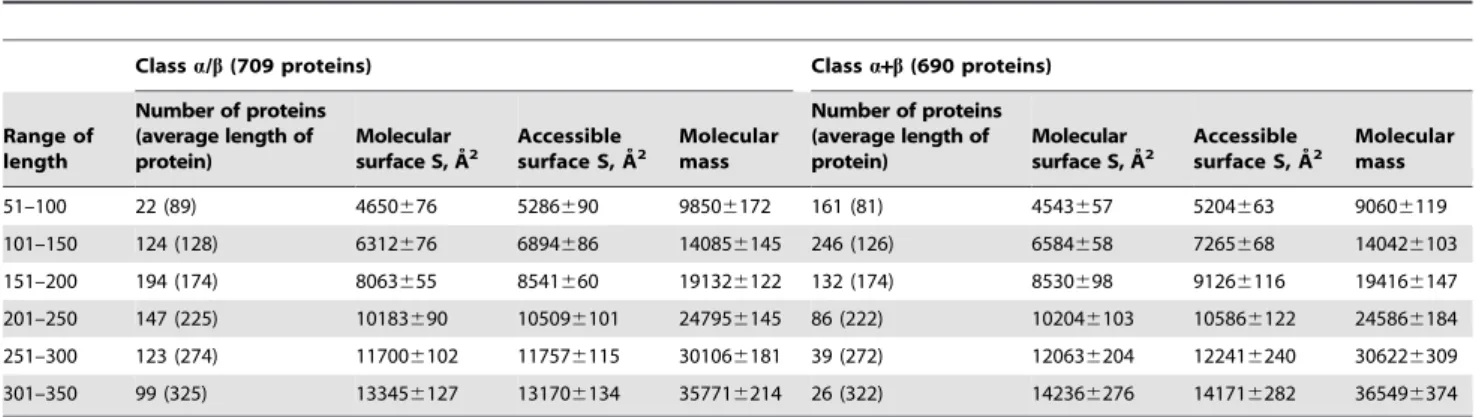
Table 2.Structural characteristics of 1399 globular protein domains from classesa/banda+b.
Classa/b(709 proteins) Classa+b(690 proteins)
Range of length
Number of proteins (average length of protein)
Molecular surface S, A˚2
Accessible surface S, A˚2
Molecular mass
Number of proteins (average length of protein)
Molecular surface S, A˚2
Accessible surface S, A˚2
Molecular mass
51–100 22 (89) 4650676 5286690 98506172 161 (81) 4543657 5204663 90606119
101–150 124 (128) 6312676 6894686 140856145 246 (126) 6584658 7265668 140426103
151–200 194 (174) 8063655 8541660 191326122 132 (174) 8530698 91266116 194166147
201–250 147 (225) 10183690 105096101 247956145 86 (222) 102046103 105866122 245866184
251–300 123 (274) 117006102 117576115 301066181 39 (272) 120636204 122416240 306226309
301–350 99 (325) 133456127 131706134 357716214 26 (322) 142366276 141716282 365496374
Calculation of accessible surface area and protein molecular surface
We calculated the accessible surface areaSASAfor each protein considered. The calculations were made with the YASARA program [http://yasara.org] using 1.4 A˚ as the probe radius of a water molecule. The difference between the molecular surface and the accessible surface is that the accessible surface area (SASA) is a surface formed by the center of a probe molecule rolled over a protein molecule, while the molecular surface is a surface formed by the Van der Waals sphere of a probe molecule rolled over a protein molecule. If the probe is water, a water molecule is modeled by a sphere of radius 1.4 A˚ . This means that the molecular surface is ‘‘thinner’’ thanSASAand the ‘‘distance’’ between them is 1.4 A˚ . In fact, the molecular surface is obtained from the Van der Waals surface if all crevices and interiors inaccessible for water are smoothed by means of the Van der Waals surface of the water molecule.
Hydrogen bonds observed in spatial structures of proteins
Hydrogen bonds were searched for in the same dataset. We collected statistics separately for two variants of hydrogen bonds. In the first case, backbone hydrogen bonds (that is, hydrogen bonds where the donor is an NH-group of the protein backbone and the acceptor is an O-atom of the protein backbone) were analyzed with the standard DSSP program [19]. For each NH-group, only one hydrogen bond (which had the best energy, according to DSSP) was taken into consideration in this case. The criterion of hydrogen bond formation was that recommended by the DSSP authors (the calculated energy lower than -0.5 kcal/mol). In the other case, we calculated the hydrogen bonds taking into account both backbone and side-chains (that is, hydrogen bonds where the donor and acceptor belong to the protein side-chain). For this purpose we used the YASARA program. The criterion of hydrogen bond formation was that recommended by the YASARA authors (the calculated energy lower than21.5 kcal/mol).
During the calculation, the hydrogen bonds were "ascribed" to acceptor residues according to the type of structure (helical-structure or beta-(helical-structure), which resulted in two sets of pro-bability values for each type of amino acid residues. Along with the DSSP program, the helical-structure includes residues froma- and 310–helices. The beta-structure includes residues from isolatedb
-bridges and extended strands involved inb-sheets. Residues from p-helices, hydrogen-bonded turns and bends are included in the irregular structure (coil). The probability of hydrogen bond formation was calculated as the total number of hydrogen bonds of the corresponding variant (backbone2backbone for helical-structure and backbone2backbone for beta-structure) formed by each type of amino acid residues divided by the total number of residues of this type in the considered secondary structure in the dataset.
Error estimation
The standard deviation for the slopes of the straight lines (see Figure 1) of the log-log dependences of the accessible and molecular surface areas versus the protein molecular masses is calculated ass ffiffiffiffiffi
N
p , whereNis the number of proteins andsis the root-mean-square deviation:
s~
ffiffiffiffiffiffiffiffiffiffiffiffiffiffiffiffiffiffiffiffiffiffiffiffiffiffiffiffiffiffiffiffiffiffiffiffiffiffiffiffi Pn
i~1
yi{Bxi{A
ð Þ2
N{2
ð ÞPn i~1
xi{xx
ð Þ2
v u u u u u t
ð3Þ
whereyiis the molecular (or accessible) surface,xiis the molecular mass, and A and B are coefficients of the linear equation yi~B:xizA. Standard deviations for these values are in the third decimal place.
Results and Discussion
Accessible surfaces in four structural classes
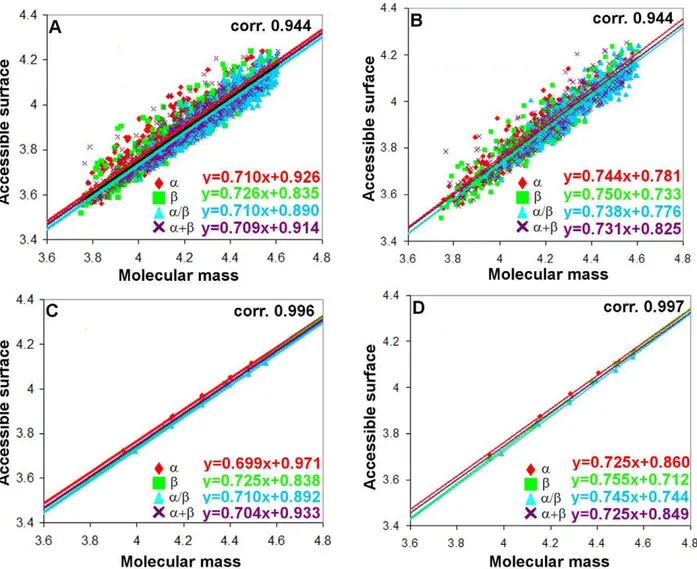
For 2554 globular proteins belonging to four structural classes according to the SCOP classification we calculated accessible surface areas and molecular masses (see Tables 1, 2, Figure 1A,C). The slopes of the straight lines (the tangents of the slope) of the log-log dependences of the accessible surface areas (with account of hydrogen atoms) on the protein molecular masses are given for the four structural classes in Table 3. The slopes of the lines were obtained for two cases: first, when considering all proteins, and second, when averaging was made in the specified region of the length of proteins, which gave six points. One can see that the beta structural class of proteins has a larger power in the analyzed dependences for surface areas than other structural classes. The same trend was observed when considering the re-refined protein structures (see Table 3 and Figure 1B,D). The higher value of the fractal dimension from the SASA — M dependence can be interpreted as an increase of the number of large-scale irregularities on the protein surface with an increase of the protein size [5]. The packing of secondary structure elements is important for the observed protein surface properties. It would be of interest to learn how such packing of secondary structure elements influences the irregularities of the protein surface.
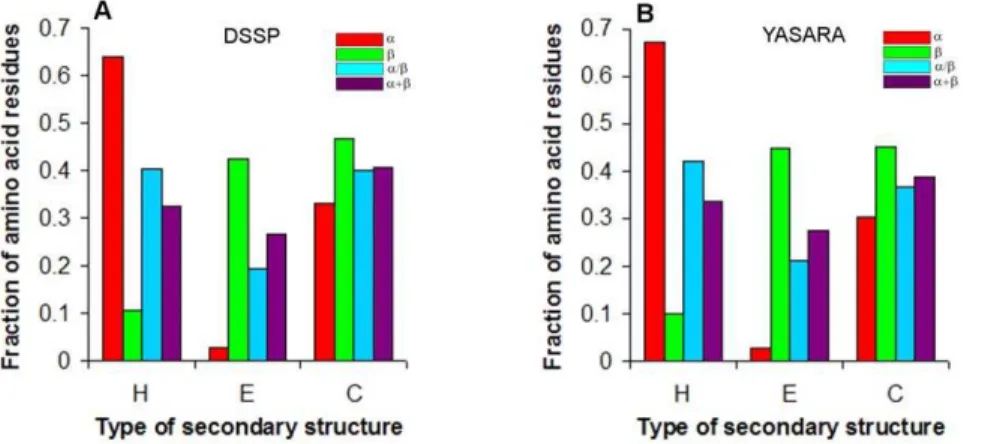
To find the structural peculiarities responsible for the above, we constructed the statistics of occurrence of residues in three different structural classes (alpha-helix, beta-structure, and coil). Since different programs make different assignments of secondary structures, we used two programs for this purpose: DSSP and YASARA. It turned out that the secondary structure assignments obtained with these programs are practically the same. An interesting result obtained from the statistics is that the fraction of residues involved in the regular secondary structure is larger for all-aproteins and the least for all-bproteins according to the both programs used (see Figure 2). Such a difference can be explained by the existence of the largest number of residues in the coil conformation on the surfaces of beta structural proteins.
The higher value of fractal dimension from the SASA — M dependence for all-b proteins can be explained by at least two reasons: first, by a large fraction of residues in the loop regions, and second, by the fact that the accessible surface area of packaged elements of the beta-structure increases more rapidly with the increasing molecular mass than that of the alpha-structure.
To clarify this situation, we made an additional analysis of protein structures from our dataset. Two parameters were considered: (i) the number of loop residues per regular secondary structure element (Figure 3A), and (ii) the fraction of loop residues in the protein structure (Figure 3B). As seen, for all considered sequence sections, the former is higher in all-aproteins, while the latter is higher in all-bproteins. With a given value of parameter (i) or (ii), the dependence between the accessible surface area and the protein molecular mass allows assessing the fractal dimension of helical and beta-structural surfaces and an increase/decrease of this dependence with increasing/ decreasing parameter (i) or (ii).
results in an increase of the power of dependence of the accessible surface on molecular mass from 0.709 to 0.730 (see Figure 4, range 5–10, range 1–5 is not shown). Thus, over range 5–10, the accessible surface areas of the beta-structure grow with the increasing molecular mass more rapidly than those of the alpha-structure (0.730 against 0.695 for accessible surfaces).
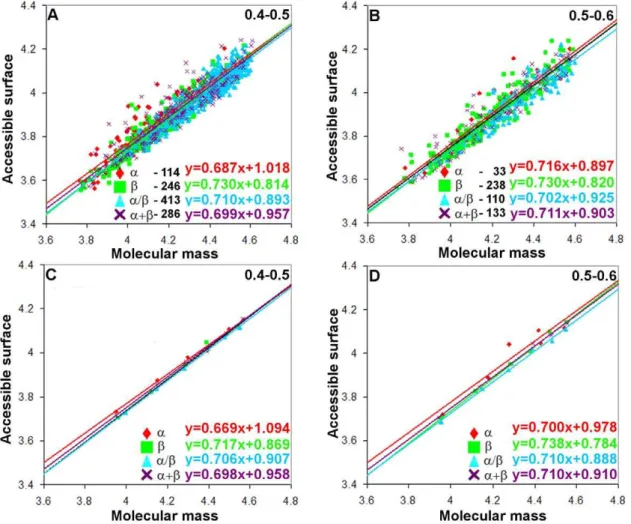
As for parameter (ii), with fractions 0.4–0.5 and 0.5–0.6, we have a sufficient number of proteins for the statistical analysis in all the four structural classes (with exception for class a where in fraction 0.5–0.6 covering chain lengths 201–250 and 251–300 there is only one protein). For the given value of parameter (ii), the beta structural class of proteins has a larger power of dependences for both surface areas than alpha helical proteins. This means that accessible and molecular surface areas of the beta-structure increase with the increasing molecular mass more rapidly than those of the alpha-structure. Construction of two such depen-dences with different numbers of loop residues in the four structural protein classes allows us to conclude that an increase in the length of loops results in the increasing SASA value in monomeric proteins of different structural classes. The depen-dence of the accessible surface area on molecular mass for all-b proteins increases from 0.717 to 0.738 (from 0.669 to 0.700 for all-aproteins) (Figure 5C,D).
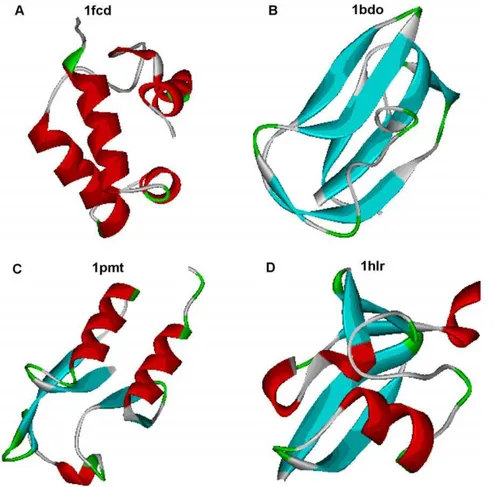
Figure 6 demonstrates the protein structures from four general classes with the same length of proteins and the same fraction of residues in the loop region. But the number of loop residues per regular element of the secondary structure is different especially forastructural proteins.
Figure 1. Log-log dependences of accessible surface areas on protein molecular masses for four structural classes of proteins.Cases (A) and (C) for general dataset of proteins and cases (B) and (D) for re-refined protein structures. In cases (A) and (B), values for all proteins without averaging (the number of points corresponds to the number of proteins in each structural class) were considered. And in cases (C) and (D) these values were averaged in the given region of the protein lengths (six points for each structural class).
doi:10.1371/journal.pone.0028464.g001
Table 3.Slopes of straight lines of log-log dependences of accessible surface areas on protein molecular masses for two databases: PDB (2554 proteins) and PDB_REDO (1498 proteins).
PDB REDO_PDB PDB REDO_PDB
Class
(number of points)
(number of points)
(number of points)
(number of points)
a 0.710 (499) 0.744 (284) 0.699 (6) 0.725 (6)
b 0.726 (656) 0.750 (398) 0.725 (6) 0.755 (6)
c 0.710 (709) 0.738 (427) 0.710 (6) 0.745 (6)
d 0.709 (690) 0.731 (389) 0.704 (6) 0.725 (6)
Thus, it can be concluded that for all-b proteins at least two factors (surface area of packaged elements of the beta-structure increases with the increasing molecular mass more rapidly than that of alpha-helix and a larger number of loop residues in all-b proteins) upregulate the power in theSASA — Mdependence.
Hydrogen bonds in spatial structures of proteins
Since the total number of hydrogen bonds is proportional to the protein helix and sheet content we calculated the number of hydrogen bonds per residue in each structural class of proteins. The distribution of hydrogen bonds per residue in the given range of protein chain lengths determined with the DSSP program is shown in Figure 7A. As seen, alpha structural proteins have more hydrogen bonds per residue, which agrees with the fact that this class of proteins has the largest number of residues in the regular structure. Using the DSSP program we can consider only backbone hydrogen bonds. For analysis of all possible hydrogen bonds in the proteins we used another program, YASARA, which was also applied to calculate accessible and molecular surface areas. In this case we obtained similar patterns of hydrogen bonds per residue in different classes (Figure 8).
Although fora/b proteins the fraction of residues in the coil state is larger than that for all-aproteins (according to the DSSP and YASARA programs), the number of hydrogen bonds per residue for these two classes of proteins is practically the same (see Figure 8A). The number of hydrogen bonds depends on the protein size, and this dependence is crucial since consideration of
all proteins taken together (i.e., without regard to their size) changes the result dramatically, namely: a/b proteins have the same number of hydrogen bonds per residue (Figure 8A), while actually they are in the middle of the averaged values among the four classes, as judged by the analysis using different window sizes (Figure 8A). This situation is a result of a different number of proteins in each size range. Therefore, the average value over six regions does not necessarily coincide with the average over all proteins without dividing them into regions. One can see that the difference between the fractions of irregular structure residues is the largest, about 15%, but the difference in the number of hydrogen bonds per residue is not so great. One of possible explanations of this fact can be a different contribution of side chains or different saturation of hydrogen bonds in alpha helices and beta structures or both.
To check the first assumption, we analyzed the number of hydrogen bonds per residue in each structural class separately for the backbone and side-chains within a given size range where the average length of proteins is nearly the same in each structural class (Figures 8C, E). One can see that the backbone dependence is similar to that for all hydrogen bonds, and the contribution of side chains is insignificant. An advantage of the YASARA program is a possibility to perform energy minimization of protein structures and to check the number of hydrogen bonds after this procedure. A fascinating result that we obtained is the increasing number of hydrogen bonds per residue after minimization (Figure 8B). And the distribution of hydrogen bonds per residue in the given region of a number of amino
Figure 2. Fraction of amino acid residues of each type of secondary structure.H, helix (aand 310); E,bstructure; C, coil for four structural
classes of proteins calculated using the DSSP (A) and YASARA (B) programs. doi:10.1371/journal.pone.0028464.g002
Figure 3. Number of loop residues per regular secondary structure element (A) and the fraction of loop residues in the protein structure (B) in the given region of amino acid residues in four structural classes of proteins.
acid residues in protein chains is similar to that after using these programs without energy minimization. In this case we checked once again the contribution of the backbone and side-chains in the formation of hydrogen bonds and found that the contribution of
side-chains increased more than the contribution of the backbone hydrogen bonds after energy minimization (Figure 8F). Before energy minimization the contribution of side-chain hydrogen bonds was very small in comparison with that of backbone hydrogen bonds. The
Figure 5. Log-log dependences of accessible surface areas on protein molecular masses for four structural classes of proteins where the fraction of loop residues in the protein structure is as follows: (A, C) 0.4–0.5; (B, D) 0.5–0.6.In cases (A) and (B), values for all proteins without averaging were considered (the number of points corresponds to the number of proteins in each structural class). And in cases (C) and (D) these values were averaged in the given region of protein lengths (six points for each structural class).
doi:10.1371/journal.pone.0028464.g005
Figure 4. Log-log dependences of accessible surface areas on protein molecular masses for four structural classes of proteins where the number of loop residues per regular secondary structure element varies from 5 to 10.In case (A), values for all proteins without averaging were considered (the number of points corresponds to the number of proteins in each structural class). And in case (B) these values were averaged in the given region of protein lengths (six points for each structural class).
reason is that side-chains have no alternative donors and acceptors from water molecules, and all hydrogen bonds are formed by atoms from side-chains and the backbone. We have calculated that the accessible surfaces and volumes of structures decrease after energy minimization by 5% and 1%, respectively.
We constructed the difference between the number of hydrogen bonds per residue before and after energy
minimiza-tion according to our division into four groups for X-ray structures (0-1, 1–2, 2–3, and 3–4 A˚ resolution). It was found that the lower the resolution, the larger the number of hydrogen bonds gained by YASARA. As concerns the DSSP program, we did not obtain such an effect, except for proteins with resolution higher than 3 A˚ which have been deleted from our dataset (see Figure 9).
Figure 6. Protein structures from four general structural classes with the same length of proteins (80 amino acid residues) and the same fraction of residues in loop region (0.55).
doi:10.1371/journal.pone.0028464.g006
Figure 7. Distribution of hydrogen bonds per residue in the given region of a number of amino acid residues in four structural classes of proteins calculated with DSSP (A) and probability of formation of backbone hydrogen bonds (B).Hydrogen bonds are assigned to acceptor residues. Black bars correspond to the hydrogen bonds in beta structure, gray bars to the helical structure. The average probability of hydrogen bond formation for helical-structure is 0.6260.01 (0.6260.01 without proline) and for beta-structure 0.6960.03 (0.7260.01 without proline).
Figure 8. Distribution of hydrogen bonds per residue in the given region of amino acid residues in four structural classes of proteins calculated with YASARA. Cases (A, C, E) without and (B, D, F) with energy minimization.
doi:10.1371/journal.pone.0028464.g008
Figure 9. Average number of hydrogen bonds per residue for proteins with different resolutions.(A) Difference in the number of hydrogen bonds per residue after and before energy minimization (YASARA). (B) Number of hydrogen bonds per residue (DSSP).
To verify the other assumption for different saturation of hydrogen bonds in different structures, we constructed the statistics of hydrogen bonds for each of the 20 types of amino acid residues in two structural classes: helical-structures and beta-structures according to the DSSP program. The statistics of hydrogen bonds was analyzed using the same dataset of 2554 three-dimensional protein structures. We searched for two separate variants of hydrogen bonds: backbone2backbone (both the donor and the acceptor are in the protein backbone and hydrogen bonds belong to the helical-structure) and backbone2backbone (both the donor and the acceptor are in the protein backbone and hydrogen bonds belong to the beta-structure). Then, the probabilities of formation (by each type of amino acid residues) of hydrogen bonds of a given variant were calculated. During the calculation, the hydrogen bonds were "ascribed" to acceptor residues, resulting in a set of probability values for each type of amino acid residues. Figures 7B, 10 show the obtained probabilities of formation of hydrogen bonds of different variants for each of the 20 types of amino acid residues. An interesting result of this analysis is that the saturation of hydrogen bonds is higher in the beta-structure than in the helical-structure. Practically for all amino acid residues the probability of formation of hydrogen bonds in the beta-structure is higher than in the helical-structure, that is, the saturation is stronger for the beta-structure, with one exception for proline, while aspartic acid and threonine have practically equal probabilities for the two considered structures. It should be underlined that the number of threonine residues occurring in the four classes of proteins is larger for all-bproteins than for other protein structures, and the number of aspartic acid residues is practically the same in the four classes (see Figure 11). The average probability of hydrogen bond formation for the helical-structure is 0.6260.01 (0.6260.01
without proline), and for the beta-structure it is 0.6960.03 (0.7260.01 without proline).
One can expect that the differences in saturation of hydrogen bonds for the alpha and beta-structures would arise from the edge effects, that is, from the differences between the average numbers of residues in the edge strands of beta-sheets and the helical ends. The DSSP program assigns a ‘‘strand’’ to residues in middle strands if both backbone atoms are H-bonded. So middle strands will always be fully saturated. Edge strands should be half-saturated only. Helices must have H-bonds for the both backbone atoms, the first and last turns of a helix should be half-saturated only. For all-aproteins the number of loop residues per regular secondary structure element is higher over all considered ranges of protein lengths than that for other classes of proteins (see Figure 3A). Compared to an all-a protein of the same size, an all-b protein in general would have more secondary structure elements (beta-strands), hence more loops and turns, but it would have fewer secondary structure blocks (beta-sheets), hence higher saturation of hydrogen bonds in these blocks. More clearly this effect is seen for the d (a+b proteins with segregated alpha and beta regions) and c class proteins (a/bproteins with mixed alpha and beta structures). As for the average probability of hydrogen bond formation for each of the four classes, for the beta-structure this probability is higher for all residues from class d, but in class c asparagine, aspartic acid, glycine, serine, and threonine have higher or equal probability of alpha-helix formation as compared with the beta-structure (see Figure 10C,D).
Since the total number of hydrogen bonds is proportional to the protein helix and sheet content, Stickle et al. [20] suggested an equation for estimation of hydrogen bonds in proteins (their dataset consisted of 42 X-ray structures of proteins):
Figure 10. Statistics of hydrogen bonds observed in protein spatial structures.Probability of formation of backbone hydrogen bonds for four structural classes of proteins: (A) class a; (B) class b; (C) class c and (D) class d.
Number of hydrogen bonds~0:714:L{6:8, whereL is the
num-ber of residues. We suggested close coefficients after studying 2554 structures: Number of hydrogen bonds~0:678:L{3:350
(Figure 12). Correlation coefficient is 0.97.
The results of our analysis of protein surfaces and its detailed structure allow us to obtain important information on protein structures: the probability of formation of backbone hydrogen bonds of the beta structure is higher than in alpha helix practically for all amino acid residues with one exception for proline.
Consideration of two additional parameters (the number of loop residues per regular secondary structure element and the fraction of loop residues in the protein structure) showed that for all-b proteins at least two factors (accessible and molecular surface areas of packaged elements of the beta-structure increase with the
increasing molecular mass more rapidly than those of alpha-helix and a larger number of loop residues in all-bproteins) upregulate the power of theSASA— Mdependence.
Author Contributions
Conceived and designed the experiments: OVG. Performed the exper-iments: AVG NSB. Analyzed the data: AVG NSB OVG. Contributed reagents/materials/analysis tools: OVG. Wrote the paper: OVG. Designed the software used in analysis: OVG.
References
1. Lee B, Richards FM (1971) The interpretation of protein structures: Estimation of static accessibility. J Mol Biol 55: 379–400.
2. Miller S, Janin J, Lesk AM, Chothia C (1987) Interior and surface of monomeric proteins. J Mol Biol 196: 641–656.
3. Miller S, Lesk AM, Janin J, Chothia C (1987) The accessible surface area and stability of oligomeric proteins. Nature 328: 834–836.
4. Serdyuk IN, Galzitskaya OV, Timchenko AA (1997) Roughness of the globular proteins surface. Biofizika (Russian) 42(6): 1197–207.
5. Timchenko AA, Galzitskaya OV, Serdyuk IN (1997) Roughness of the globular protein surface: analysis of high resolution X-ray data. Proteins 28(2): 194–201. 6. Fushman D (1990) Surface fractality of proteins from theory and NMR data.
J Biomol Struct Dynam 7: 1333–1344.
7. Fedorov BA, Fedorov BB, Schmidt PW (1993) An analysis of the fractal properties of the surfaces of globular proteins. J Chem Phys 99: 4076–4083. 8. Pfeifer P, Obert M (1989) Fractals: Basic concepts and terminology. In: "The
Fractal Approach to Heterogeneous Chemistry", Avnir, D. (ed.) New York: Wiley.
9. Pfeifer P, Avnir D (1983) Chemistry in noninteger dimensions between two and three. I. Fractal theory and heterogeneous surfaces. J Chem Phys 79: 3558–3565. [Erratum: J. Chem. Phys. 80:4573, 1984].
10. Chothia C (1974) Hydrophobic bonding and accessible surface-area in proteins. Nature 248: 338–339.
11. Raschke TM, Tsai J, Levitt M (2001) Quantification of the hydrophobic interaction by simulations of the aggregation of small hydrophobic solutes in water. Proc Natl Acad Sci USA 98: 5965–5969.
12. Ivankov DN, Bogatyreva NS, Lobanov MY, Galzitskaya OV (2009) Coupling between Properties of the Protein Shape and the Rate of Protein Folding. PLoS ONE 4(8): e6476.
13. Bogatyreva NS, Ivankov DN (2008) The relationship between protein accessible surface area and number of native contacts in its structure. Mol Biol (Mosk) 42(6): 1048–1055.
14. Tejera E, Machadoa A, Rebelo I, Nieto-Villar J (2009) Fractal protein structure revisited: topological kinetic and thermodynamic relationships. Phys A 388: 4600–4608.
15. Morita H, Takano M (2009) Residue network in protein native structure belongs to the universality class of three dimensional critical percolation cluster. Phys Rev E 79: 020901.
16. Banerji A, Ghosh I (2009) Revisiting the myths of protein interior: studying proteins with mass-fractal hydrophobicityfractal and polarizability-fractal dimensions. PLoS ONE 4(10): e7361.
17. Murzin AG, Brenner SE, Hubbard T, Chothia C (1995) SCOP: a structural classification of proteins database for the investigation of sequences and structures. J Mol Biol 247(4): 536–540.
18. Joosten RP, Salzemann J, Bloch V, Stockinger H, Berglund A, et al. (2009) PDB_REDO: automated re-refinement of X-ray structure models in the PDB. J Appl Crust 42: 376–384.
19. Kabsch W, Sander C (1983) Dictionary of protein secondary structure: pattern recognition of hydrogen-bonded and geometrical features. Biopolymers 22(12): 2577–2637.
20. Stickle DF, Presta LG, Dill KA, Rose GD (1992) Hydrogen bonding in globular proteins. J Mol Biol 226(4): 1143–1159.
Figure 11. Average frequency of occurrence of each type of amino acid residue in four structural classes of proteins.
doi:10.1371/journal.pone.0028464.g011
Figure 12. Dependences of a number of hydrogen bonds on the number of amino acid residues in protein.