Specificity and Evolvability in Eukaryotic Protein
Interaction Networks
Pedro Beltrao*, Luis Serrano
European Molecular Biology Laboratory, Structures and Computational Biology Program, Heidelberg, Germany
Progress in uncovering the protein interaction networks of several species has led to questions of what underlying principles might govern their organization. Few studies have tried to determine the impact of protein interaction network evolution on the observed physiological differences between species. Using comparative genomics and structural information, we show here that eukaryotic species have rewired their interactomes at a fast rate of approximately 105 interactions changed per protein pair, per million years of divergence. For Homo sapiens this corresponds to 103interactions changed per million years. Additionally we find that the specificity of binding strongly determines the interaction turnover and that different biological processes show significantly different link dynamics. In particular, human proteins involved in immune response, transport, and establishment of localization show signs of positive selection for change of interactions. Our analysis suggests that a small degree of molecular divergence can give rise to important changes at the network level. We propose that the power law distribution observed in protein interaction networks could be partly explained by the cell’s requirement for different degrees of protein binding specificity.
Citation: Beltrao P, Serrano L (2007) Specificity and evolvability in eukaryotic protein interaction networks. PLoS Comput Biol 3(2): e25. doi:10.1371/journal.pcbi.0030025
Introduction
Many partial protein interaction maps for several eukary-otic species have now been published [1–9], and several studies have tried to analyse the structure and evolution of such networks on a topological level [10–16]. The massive data produced by sequencing efforts has allowed for comparison of different genomes, giving us much more information about their organization and evolution than what would be possible by the analysis of individual genomes [17–21]. By analogy, to obtain a similar insight into the structure and evolution of interactomes, different protein networks would need to be compared, a procedure one could call‘‘comparative interactomics.’’This could be achieved by studying the conserved interactions between groups of ortholog proteins in different species, defined as interologs [1,22,23]. Recent attempts to compare protein interactions networks of different species [24,25] suggested that, at the moment, the current data are poorly suited for direct comparison; the overlap between datasets is small and this is most likely due to insufficient data quantity and quality. An alternative approach has been to look for conservation of network modules between species [26,27]. This has lead to the development of several network alignment tools and has largely been more successful at finding conserved interac-tions [26,28].
These studies have not, however, taken into account the large evolutionary distance separating the species under study. In fact, the four eukaryotic species for which we currently have the most interaction data (Saccharomyces cerevisiae, Drosophila melanogaster, Caenorhabditis elegans, and Homo sapiens) shared a common ancestor more than 900 million years (My) ago [29]. This raises the intriguing hypothesis that this evolutionary distance is too large for these species to have retained many similarities in their interaction networks. In fact, the relative success of the network alignment approaches hints that evolutionary
pressures do not constrain the exact cellular interactions, but instead constrain the required functional complexes that emerge. Hence, the lack of overlap would correspond in part to divergence and not merely to poor coverage.
Even without the ability to compare interactomes directly, one could try to obtain estimates for the rate of change in interactomes by mining existing data with comparative genomics. Previously, Wagner [13,30] used paralogous protein pairs from S. cerevisiae to estimate that 2 3 106 new interactions are added to the yeast interactome per protein pair per My, suggesting that, on average, about 50 to 100 new interactions have arisen every 1 My. The method relied on very few interactions between paralogous protein pairs, making it impossible to dissect the different contributions to the average value. Also, in the last three years, we have more data available from a greater number of species, allowing us to compare how interactomes have changed in more recent evolutionary time and to draw more general conclusions about these processes.
We have attempted to evaluate the rate of change of interactions in the interactomes of several eukaryotic species (S. cerevisiae,D. melanogaster,H. sapiens,andC. elegans). We have determined that, in all species tested, interactions change at a rate on the order of 13105interactions per protein pair per My. The approach used allowed us to explore different
Editor:Alfonso Valencia, Spanish National Cancer Research Centre, Spain ReceivedJuly 5, 2006;AcceptedDecember 27, 2006;PublishedFebruary 16, 2007 A previous version of this article appeared as an Early Online Release on December 28, 2006 (doi:10.1371/journal.pcbi.0030025.eor).
Copyright:Ó2007 Beltrao and Serrano. This is an open-access article distributed under the terms of the Creative Commons Attribution License, which permits unrestricted use, distribution, and reproduction in any medium, provided the original author and source are credited.
Abbreviations:My, million years; UBA, ubiquitin-associated
protein properties influencing interaction turnover. We have observed that specificity in protein binding and protein function can determine link dynamics during the evolution of cellular networks.
Results
Recently Duplicated Proteins of Eukaryotic Species Have a Fast Rate of Interaction Change
To calculate the rate of interaction change, we have established for each protein, in all species studied here, an approximate age of origin, according to the presence or absence of an identifiable ortholog in several other reference species (see Materials and Methods). We assumed that any interaction observed today with a recently duplicated protein was either inherited in the process of duplication or created after the process of gene duplication. It has been estimated that forS. cerevisiae the fraction of gene duplicates with at least one shared interaction is below 20% after 50 My [13]. For each species, we calculated the fraction of interactions that were also observed with the closest homolog of the recently duplicated protein. Within the time frame studied (20 to 100 My), the fraction of observed conserved inter-actions after gene duplication was low (1% to 20%, see Tables
1 and S1). Eliminating the interactions likely inherited by duplication, we were left with protein interactions that were either gained in the copy we are considering or they were inherited by duplication and subsequently lost in the homolog. Either of these cases represents an event of interaction change that occurred after gene duplication, and we can thus calculate the rate at which interactions change (see Materials and Methods). This rate for all species was approximately on the order of 1 3 105 interactions changed per protein pair per My (see Table 1) and ranged from 5.363106in H. sapiensto 2.453105 inS. cerevisiae. Considering the possible protein pairs in the different species (about 1.83107inS. cerevisiaeand 2.33108inH. sapiens,when excluding splicing alternatives), this estimate would corre-spond to a change of approximately 100 to 1,000 interactions every My.
Due to the low coverage of the current interactomes, it is quite possible that these values might change as new data is made available. To study the impact of coverage on the values mentioned above, we have mimicked the effect of lowering the coverage of the current datasets by randomly sampling the interactomes in two ways: randomly removing protein interactions or randomly removing proteins (and their interactions).
The percentage of inherited interactions increased with increasing coverage; approximately linearly in the case of random node removal and nonlinearly in the case of random protein removal (see Figure S1). Therefore, the percentage of inherited interactions is a measure that depends on the size of the network and is therefore likely to change as more data is added.
The rate of change of interactions, on the other hand, appears to be independent of network size. There was no significant change in the rate in the case of random removal of proteins. In the case of random removal of interactions, only when more than 80% of the interactions were removed was there a significant increase of the rate (see Figure S1). It is important to note that the trend points to a stabilization of the value, indicating that further increases in coverage will not likely change it. We deduce from this result that the rate of change of interactions is a measure that is mostly independent of network size and can be used to study the evolution of protein interaction networks.
To test the robustness of our method for variations in accuracy of the data, the human interactome was separated into three subsets, as defined in the Human Protein
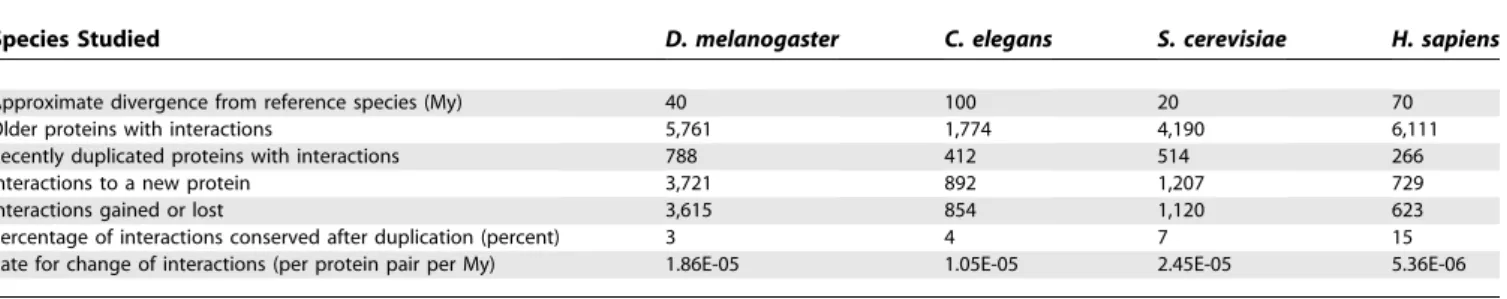
Table 1.Eukaryotic Species Had in the Recent Evolutionary Past a Fast Rate of Change of Interactions
Species Studied D. melanogaster C. elegans S. cerevisiae H. sapiens
Approximate divergence from reference species (My) 40 100 20 70
Older proteins with interactions 5,761 1,774 4,190 6,111
Recently duplicated proteins with interactions 788 412 514 266
Interactions to a new protein 3,721 892 1,207 729
Interactions gained or lost 3,615 854 1,120 623
Percentage of interactions conserved after duplication (percent) 3 4 7 15
Rate for change of interactions (per protein pair per My) 1.86E-05 1.05E-05 2.45E-05 5.36E-06
Using estimated times of origin for all the proteins and the currently available protein interaction data, we have calculated the rate of change of interactions and the percentage of these interactions conserved after the process of gene duplication (see Materials and Methods).
doi:10.1371/journal.pcbi.0030025.t001
Author Summary
Reference Database: (1) yeast two-hybrid (including the two recent high-throughput studies [3,4]); (2) in vitro studies, such as GST pull-down; and (3) in vivo studies, such as co-immunoprecipitation. The in vivo and in vitro subsets contain only literature-derived interactions and should therefore be of higher accuracy. The rate of change of interactions for these three datasets was 1.093105, 7.233
106, and 7.12
3 106, respectively (see Table S1). The
calculated rate using the high accuracy datasets was very similar to the values from the human yeast two-hybrid data and the data from the other species. We conclude that the order of magnitude reported is a good approximation for the rate of change of eukaryotic protein interactions networks.
The Rate of Change of Interactions Correlates with the Number of Binding Partners of a Protein in All Eukaryotic Species Studied
Topological analysis of protein interaction networks has shown previously that the distribution of the number of interactions follows a power law, such that the frequency of proteins with n interactions falls off as na(where alpha is the exponent of the power law) [15]. It has been proposed that the observed power law distributions could arise by network growth and preferential attachment, where newly created nodes would preferentially link to already highly connected nodes [31]. Two independent studies have shown, for S. cerevisiae, preferential attachment in the protein interaction network [11,30], supporting the model proposed for the emergence of the power law distribution (at least in the case of protein interaction networks).
We asked if there was also a correlation between the number of partners of a protein and the rate of change of its interactions. Given that the rate of change was calculated as the number of changed interactions per protein pair per My, no bias was expected for proteins having different degrees of connectivity. Using the data for different species, we observed a linear correlation between the number of binding partners and the link turnover for all species studied (Figure 1). The correlation in all cases is strong with R2of 0.94 forS. cerevisiae,
0.97 for D. melanogaster, 0.96 for C. elegans, and 0.93 for H. sapiens. From these results we can conclude that there is preferential turnover of interactions in eukaryotic interac-tomes with highly connected proteins having a faster rate of change in their interactions.
Domain Binding Characteristics Influence the Rate of Change of Interactions
The initial observations about the robustness of power law networks to random node removal [32] and the correlation between protein essentiality and the number of interactions [15] led to the idea that the overall structure of interactomes could be the outcome of selection for robustness to gene deletion. Wagner [30] suggested that there is no need to invoke natural selection to explain the network topology, since the local preferential attachment and network growth observed in the S. cerevisiae interactome suffice to create power law networks. We showed above that preferential turnover is a property of the protein interactions networks of all species studied, but what might determine this behavior at a molecular level?
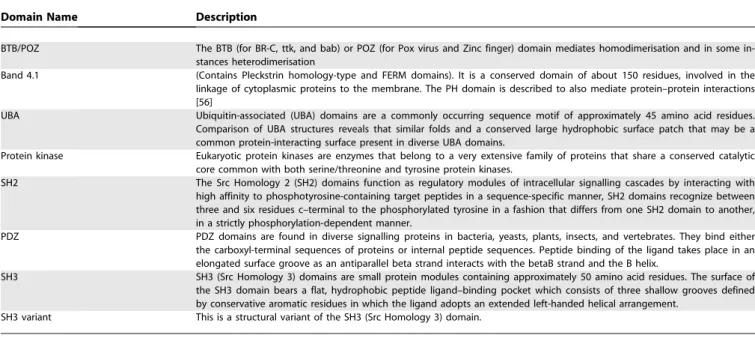
It is known that interfaces of transient protein–protein interactions are less restricted in evolution than the binding surfaces of permanent complexes. Also, interacting residues of transient complexes are less likely to co-evolve than interaction residues of permanent complexes [33]. It is plausible that different types of interactions have different likelihoods of changing their interactions over a given evolutionary period. To test this in an unbiased fashion, we first aimed to determine the protein domains that contribute more to the fast rate of change. We considered only domains that conferred a rate of change to a group of proteins that was larger than average in at least three of the four species studied (see Materials and Methods). All of the domains selected by this criteria (see Table 2) are currently known to mediate protein–protein interactions. Interestingly, five of the eight domains are known to form domain–peptide interactions, as opposed to domain–domain interactions, suggesting that proteins containing peptide-binding domains
Figure 1.Preferential Interaction Turnover Is Observed in All Eukaryotic Interactomes
We have binned proteins according to their average number of interactions and calculated for each bin the rate of change of interactions. There is a very strong correlation between the degree of connectivity and the interaction turnover.
are more likely to change their interactions faster over the same evolutionary time than other types of domains [34].
Many domain–peptide interactions involved a globular domain binding to a peptide that does not adopt a regular secondary structure and that is not part of the globular region of the target protein [35]. Since the interaction area is
small, changes in the critical residues can easily abolish binding. Also, random point mutations in the proteome can more easily create new binding sites for these domains. This could explain their fast link turnover.
To test this hypothesis further, we analyzed a database containing structures of interacting protein domains [36] to search for domains with different degrees of specificity. Here, we define a‘‘specific protein’’as one that has few ligands and few interaction surfaces, while an‘‘unspecific protein’’is one that has many potential ligands and/or many different interaction surfaces. Therefore, promiscuous protein-binding domains are those that have been observed in close physical contact with a high number of other types of domains. We have binned proteins containing domains with increasing number of known structural interactions with other domains and calculated for each bin the rate of change (see Materials and Methods and Figure 2). Using the human dataset of literature-derived protein interactions, we observed that groups of proteins having domains capable of interacting with a higher number of other domains tend to have higher rates of change of their interactions.
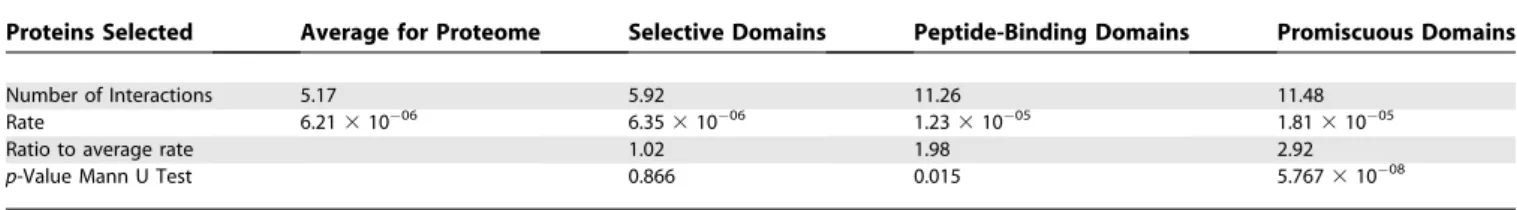
For promiscuous proteins (containing domains capable of interacting with 15 or more other domains), we calculated the rate of change of interactions and compared this value with that obtained for proteins containing more specific domains (fewer than five structural interactions in iPfam) and the average for all proteins. We observed that peptide-binding domains and promiscuous domains have a higher rate of change of interactions (p-value,0.02 for both groups with a Mann Whitney U test) than the average for the proteome (see Table 3). The difference between these two groups is not statistically significant (p¼0.06 with a Mann Whitney U test). Proteins having more specific binding domains have a rate of
Table 2.Domains Found to Contribute to the Fast Rate of Change of Interactions in at Least Three of the Four Species Studied
Domain Name Description
BTB/POZ The BTB (for BR-C, ttk, and bab) or POZ (for Pox virus and Zinc finger) domain mediates homodimerisation and in some in-stances heterodimerisation
Band 4.1 (Contains Pleckstrin homology-type and FERM domains). It is a conserved domain of about 150 residues, involved in the linkage of cytoplasmic proteins to the membrane. The PH domain is described to also mediate protein–protein interactions [56]
UBA Ubiquitin-associated (UBA) domains are a commonly occurring sequence motif of approximately 45 amino acid residues. Comparison of UBA structures reveals that similar folds and a conserved large hydrophobic surface patch that may be a common protein-interacting surface present in diverse UBA domains.
Protein kinase Eukaryotic protein kinases are enzymes that belong to a very extensive family of proteins that share a conserved catalytic core common with both serine/threonine and tyrosine protein kinases.
SH2 The Src Homology 2 (SH2) domains function as regulatory modules of intracellular signalling cascades by interacting with high affinity to phosphotyrosine-containing target peptides in a sequence-specific manner, SH2 domains recognize between three and six residues c–terminal to the phosphorylated tyrosine in a fashion that differs from one SH2 domain to another, in a strictly phosphorylation-dependent manner.
PDZ PDZ domains are found in diverse signalling proteins in bacteria, yeasts, plants, insects, and vertebrates. They bind either the carboxyl-terminal sequences of proteins or internal peptide sequences. Peptide binding of the ligand takes place in an elongated surface groove as an antiparallel beta strand interacts with the betaB strand and the B helix.
SH3 SH3 (Src Homology 3) domains are small protein modules containing approximately 50 amino acid residues. The surface of the SH3 domain bears a flat, hydrophobic peptide ligand–binding pocket which consists of three shallow grooves defined by conservative aromatic residues in which the ligand adopts an extended left-handed helical arrangement.
SH3 variant This is a structural variant of the SH3 (Src Homology 3) domain.
We have binned proteins according to the protein domains defined by Interpro [55]. To find protein domains that conferred an above-average rate in most species, we selected bins with an average rate greater than average in at least three of the four species.
doi:10.1371/journal.pcbi.0030025.t002
Figure 2.Protein Binding Domains with Many Structural Interactions Observed Have a Higher Link Turnover
We have grouped proteins containing domains with increasing observed structural interactions with other domain types and calculated for each bin the rate of change of interactions. Proteins containing domains known to interact with many other different domains have a higher rate of change of interactions than proteins containing domains with few known interactions.
change of interactions not significantly different from the average value (p¼0.86 with a Mann Whitney U test).
We have also studied domains with different binding specificities as defined by their number of observed physical interactions. Using the iPfam [36] database, we were able to assign plausible binding interfaces to roughly 20% of human interactome (see Materials and Methods). We then searched for proteins that had multiple interactions occurring through the same domain, and we compared this group to another having proteins with a similar number of interactions through more than one domain (see Figure S2). Given the same number of interactions, proteins that preferentially bind through one domain (more promiscuous) have on average a higher rate of change of interactions than proteins interacting through multiple domains. For protein hubs having 10 to 50 interactions, the rate is 2.2 times higher for the promiscuous domains (p-value ¼ 0.0089 with a Mann Whitney U test) than the more selective domains with the same average number of interactions.
We conclude from these results that the specificity, as defined by the number of binding surfaces or physical
interactions, of a binding domain is a strong determinant of the rate of change of interactions, with more promiscuous binding correlating with higher rates of evolution.
Human Proteins Related to Immune Response, Transport, and Localization Have Likely Been Under Positive Selection for Change of Their Interactions in the Recent Evolutionary Past
The results above suggest that specificity, as defined here, determines link dynamics, affecting the rate at which proteins might explore possible beneficiary interactions and remove deleterious ones. Innovation explored in this way is grounds for natural selection to act upon during evolution. It is then plausible that proteins belonging to different functional classes might have different rates of change of interactions due to differential selection pressures. To study this, we have binned human proteins according to Gene Ontology bio-logical processes [37] (see Materials and Methods) and have, for each biological process, calculated the average number of interactions and the rate of change (see Figure 3). To reduce the number of functions and increase the reliability of the
Table 3.Specificity of Protein Binding Is an Important Factor Determining the Rate of Change of Interactions
Proteins Selected Average for Proteome Selective Domains Peptide-Binding Domains Promiscuous Domains
Number of Interactions 5.17 5.92 11.26 11.48
Rate 6.2131006 6.35
31006 1.23
31005 1.81
31005
Ratio to average rate 1.02 1.98 2.92
p-Value Mann U Test 0.866 0.015 5.76731008
We separated human proteins that likely originated before the split withM. musculusinto three groups: proteins having domains with five or fewer physical contacts with other domains in the iPfam structural database—likely to be more selective domains; proteins having domains with 15 or more structural contacts with other domains in the iPfam structural database— likely to be more promiscuous domains; and proteins containing well-known peptide binding domains (SH3, SH2, Protein kinase, WW, and PDZ). We counted the average number of interactions of these proteins (with other proteins originating before the split) with the reference species, and we calculated the rate of change of interactions. We compared these values with the values obtained with all proteins originating before the split with the reference species.
doi:10.1371/journal.pcbi.0030025.t003
Figure 3.Biological Process Can Determine Link Dynamics Independently of the Number of Interaction Partners
We have binned proteins according to the biological processes, defined in Gene Ontology, and calculated for each bin the average number of interactions and average rate of change of interactions (see Materials and Methods). The black line represents the expected rate of change for proteins with increasing numbers of interactions.
calculated rates, we have considered only GO processes with at least 150 proteins present in the current human interactome (excluding yeast two-hybrid interactions). We compared the values obtained with the expected rates for proteins with increasing average connectivity (black line in Figure 3).
Most groups of proteins had average rates of change that were not much different than groups of proteins with a similar connectivity. Within these groups we could distin-guish between processes that have proteins with similar or lower-than-average rates (such as metabolism) and biological processes that have above-average rates (such as intracellular signaling, phosphorylation, regulation of cellular processes, and regulation of apoptosis). These results confirm the suggestion of Kunin et al. [38] that the functional role of proteins poses constraints on the evolution of new inter-actions. We suggest this is due to differential usage of protein binding specificity in the different cellular processes.
More interestingly, we found some biological processes (immune response, transport and localization, cell adhesion, and response to stress/stimulus) that showed higher link dynamics than one would expect from their average number of interactions. On Table 4 we list the biological processes that have a rate significantly higher (p-value , 0.05 with a Mann Whitney U test) than expected from their average connectivity.
We redid this analysis removing GO annotations inferred electronically. Although roughly 50% of the annotations were lost, most of the results remain qualitatively the same (unpublished data). Importantly, we still see GO functions that have a rate significantly higher than expected from their average connectivity (organismal physiological process, de-fense response, immune response, and response to biotic stimuli). We hypothesize that the groups of proteins deviating from the linear preferential turnover have been under particularly strong positive selection for the change of their interactions.
Discussion
In the seminal work of King and Wilson [39] (‘‘Evolution at two levels in humans and chimpanzees’’), it was proposed that, given the small differences observed between the
proteins in both species, the most likely mechanism that could account for the differences between humans and chimpanzees would be changes in gene expression. In fact, in the 30 years following, a considerable amount of evidence has surfaced to support this view (for a review see [40]). However, as we have shown above, it is quite possible that in the time since the divergence of these two species, a significant change in protein interactions could have taken place, and, therefore, changes in protein interaction net-works can have a similar important role in species evolution.
Calculation of the Rate of Change and Potential Caveats
Extending on the work of Wagner [13,30] forS. cerevisiae,we have shown here that the interactomes of several eukaryotic species have high rates of change of their interactions. According to our calculations, 100 to 1,000 interactions might change every My in eukaryotic interactomes. Estimating that in the current interactomes proteins have on average four to ten interactions, then the link turnover would change 0.5% to 3% of the interactions every My. This estimate clearly points to an important effect of link dynamics in the evolution of cellular interactions.
Some caveats to our estimated rate should be noted. Namely, we have focused our attention on the evolution of protein interactions of single gene duplicates. The effects of single gene duplication could be considerably different from large segment or whole-genome duplication events [41]. If a protein that is part of a complex duplicates, the changes in gene dosage might unbalance the complex stoichiometry and cause a reduction in fitness to the species [42]. On the contrary, if the whole complex is duplicated, as would occur in a full-genome duplication event, the balance between the complex components would be maintained. We can speculate that a single-gene duplicate might have a stronger pressure to diverge in its interactions to avoid a gene imbalance effect, when compared with proteins originated from a full-complex duplication. However, it is also known that living systems have mechanisms to guarantee the right expression level when dealing with important complexes. A good example is the case of tubulin where the stability of the mRNA depends on the existence of unpairedaorbsubunits [43]. In fact, it is almost impossible to keep the right stoichiometry in a complex simply due to noise fluctuations, unless there are
Table 4.Biological Processes with Above-Average Rate of Change of Interactions
Biological Process Number of Proteins Rate of Change of Interactions p-Value Mann U Test
Protein transport 272 1.12E-05 0.000627
Establishment of localization 705 8.78E-06 0.000731
Intracellular transport 284 1.01E-05 0.000755
Response to external stimulus 171 1.34E-05 0.001371
Organismal physiological process 619 8.62E-06 0.001461
Response to other organism 211 1.31E-05 0.004489
Response to pest, pathogen, or parasite 206 1.29E-05 0.005542
Response to biotic stimulus 375 1.30E-05 0.011637
Defense response 350 1.28E-05 0.016926
Immune response 327 1.25E-05 0.027447
We have binned proteins according to the biological processes defined in Gene Ontology and selected bins with an average rate that was significantly higher than the expected rate for groups of proteins with the same average number of interactions.
mechanisms that control possible imbalances. Thus, although it is intuitive that whole-genome duplication could exert less pressure for divergence, this does not necessarily need to be true.
Also, it has been proposed that duplicate genes pass through a period of relaxed selection after gene duplication [21] possibly accompanied by a relaxation in the selection for maintenance of their interactions. As a result of this, the link dynamics are likely higher for recently duplicated genes than for proteins with established functions. However, experimen-tal studies estimated that 69% to 84% of interactions between ancient proteins have diverged when comparingS. cerevisiae with C. elegans [22]. The authors tested 216 interactions that were known fromS. cerevisiaeamong 282C. elegansproteins (that are conserved inS. cerevisiae). Of these, 35 interactions were experimentally observed inC. elegans. We can estimate that approximately 53106 interactions have changed per protein pair per My among these ancient proteins. This is roughly half of what we proposed as an estimate for the rate of change for eukaryotic interactomes, but it considers only removal of interactions and not addition. Due to the reasons mentioned above, we think that the rate that we have calculated might be an overestimate of the rate for the whole interactome, but currently available data suggests that even among ancient proteins there is considerable change of their interactions.
Other studies also point to the importance of change of interactions after gene duplication. In studies ofS. cerevisiae complexes, it was observed that 7% to 20% of those complexes arose by duplication [44,45]. However, in most of the instances (67% to 90%), only partial duplication was observed. Detailed studies of some of the duplicated com-plexes have shown that even in the case where general function and localization is maintained, it is possible that the specific activity of the complex has changed. These results suggest that, at least in the case of protein complexes, there is a very significant gain and loss of single interactions that can lead to the formation of new complexes with different specificities.
Binding Properties and Function Determine the Rate of Change
In a recent review [34], Neduva and Russell postulated that linear motifs might act as ‘‘evolutionary interactions switches.’’ The authors claimed that, due to binding to a linear peptide stretch and due to the small number of determinants for binding, a random mutation in the proteome can easily create or destroy such binding sites. We have shown that specificity of binding is a key factor determining the evolvability of the interaction networks. More promiscuous domains, such as peptide binding domains and domains able to interact with common structural elements, are more likely to change interactions faster over a given evolutionary period. This implies that some biological processes where these binding domains are involved (such as signal transduction) will also have a higher link turnover than others (such as metabolism). In fact, proteins related to intracellular signaling cascades are two times more likely to interact with recently duplicated proteins than proteins involved in primary metabolism. If protein properties impact on how they add and lose interactions, then the power law distribution observed in protein interaction networks is in
part determined by the cell’s use of different degrees of binding specificity.
We reported that proteins involved in the immune response, responses to external stimuli, transport, establish-ment of localization, and organismal physiological processes show signs of such positive selection for new interactions. Interestingly, most of these biological processes are known to have an excess of proteins under positive selection as shown by sequence studies [46,47]. Our results suggest that positive selection for sequence change in proteins is propagated to faster rates of change at the network level. Alternatively, it is possible that the preferential fixation of duplicated proteins involved in these biological functions might partly explain this observation.
Link Dynamics and Cellular Evolution
This study opens up interesting questions regarding the evolution of cellular functions. Some challenges faced by the cells require the interaction of several components to integrate information and provide a solution. One example would be the decision to divide or differentiate given a set of external conditions. It could be said that these challenges require a network solution as opposed to some metabolic problems, such as adapting an enzyme to do a required metabolic step.
In network challenges as defined above, selection forces would not restrain the exact binary interactions, but rather the functional complexes arising from them. It is plausible that the fast link dynamics are then advantageous to the cell, given that it allows for exploration of different network conformations from where innovation might arise.
If there is indeed a fast turnover of interactions that are material for selection to act upon, then we expect to see convergent network motifs that are optimal for solving particular cellular problems. An example of what might be an optimal network solution is the coupling of slow and fast positive feedbacks in cell decision processes [48].
If fast link dynamics is important for the cell to search for optimal solutions to network problems, then is it also likely that the rate of change itself might be under constraint and therefore under natural selection. Hence, during cellular evolution, the selection of different degrees of specificity is not only important for the functional role of the proteins but it also has direct consequences with regard to the evolvability of the whole cellular network.
Further work on protein interaction maps will help us understand to what extent evolvability constrains the differ-ential usage of protein domains in cellular networks. As was the case for comparative genomics, the availability of more and complete interactomes for different species will vastly increase our understanding of how the cell’s complexity arises from the interactions of its components and evolves to cope with changing environments.
Materials and Methods
Estimating protein time of origin.For each protein ofS. cerevisiae,
D. melanogaster, C elegans,andH. sapiens,we have established a likely
best blast hit between two species, then these proteins are likely orthologs.
We established putative orthologs between S. cerevisiae and the
following species:S. bayanus, Candida glabrata, Kluyveromyces lactis, Asphis
gossypii, C. albicans, Debaryomyces hansenii, Yarrowiya lipolytica, Neurospora
crassa, Schizosaccharomyces pombe. For D. melanogaster, we used as
reference speciesD. pseudoobscura, Anolpheles gambiae,C. elegans,and
S. cerevisiae. For H. sapiens proteins we have looked for putative
orthologs in Mus musculus, Fugu rubripes, D. melanogaster, and S.
cerevisiae. For C. elegans proteins, we have searched for putative
orthologs inC. briggsae,D. melanogaster,andS. cerevisiae.
We considered that proteins with no apparent ortholog in any of the reference species likely originated after the divergence of the
most recently diverged reference species.S. cerevisiaeproteins with no
putative ortholog in any of the reference species most likely
originated after the divergence ofS. cerevisiaeand S. bayanus, ;20
My ago [50].D. melanogasterproteins with no apparent ortholog are
younger than the split with D. pseudoobscura(;40 My ago) [51].C.
elegansproteins with no apparent ortholog are younger than the split
with C. briggsae (;100 My ago) [52]. H. sapiens proteins with no
apparent ortholog is younger than the split withM. musculus(;70 My
ago) [53].
Calculating the rate of change of interactions. The interactomes
used forC. elegans,S. cerevisiae,andD. melanogasterwere extracted from
BIND (http://bind.ca [54]), including only direct protein–protein interactions. To create the human interactome used here, we added protein interactions from two recent studies of yeast two-hybrid studies [3,4] to the literature-derived interactions compiled in the human protein reference database (taking only direct protein– protein interactions) [2].
We considered that an interaction was inherited in the process of duplication when an interaction to a recently duplicated protein was also observed with its closest homolog. Removing these interactions we were left with protein interactions that were either gained in the copy we are considering or were inherited by duplication and subsequently lost in the homolog. Either of these cases represents an event of interaction change that occurred after the gene duplication event.
The rate of change of interactions can be calculated by: rate¼
changed interactions/(possible protein pairs * divergence time).
Designating the recently duplicated proteins as Pnew and proteins
originated before the split with the most recently diverged reference
species as Pold, then: changed interactions¼changed interactions
among Pnewþchanged interactions between Pnewand Pold. Possible
protein pairs¼Pnew* Poldþ(Pnew* (Pnew1)/2). Divergence time¼
divergence time of the most recently diverged reference species (see above).
Preferential interaction change, protein domains, and biological processes.To determine if the number of interaction partners of a protein correlates with the rate of change of interactions, we have
binned all proteins in Poldaccording to the number of interactions to
other proteins in Pold. We considered bins of proteins with i to iþ5
interactions, with i ranging from one to 20. For each of these bins,
Pold(bin), the rate of change of interactions was considered to be: rate
of change (bin) ¼changed interactions between Pnew and Pold(bin)/
(Pold(bin)3Pnew3divergence time).
We observed a very strong preferential turnover in all species such that proteins with a higher degree of connectivity have a higher rate of change. For proteins with k interactions, the rate of change, r, can be calculated by:
rðH:sapiensÞ¼93107k93107
rðD:melanogasterÞ¼43106k23106
rðC:elegansÞ¼43106k73107
rðS:cerevisiaeÞ¼33106k231006
rðC:elegansÞ¼43106k73106
To determine which domains correlated with higher rates of change
of interactions, we binned proteins in Poldaccording to the protein
domains defined by Interpro [55]. For each protein domain, we
retrieved all proteins in Poldwhere this domain was observed and
calculated the rate of change of interactions as above. To select protein domains that conferred an above-average rate in most
species, we selected bins with at least 20 proteins (to increase the reliability of the calculated rate) and with a rate greater than average in at least three of the four species. There are 96 protein domains that are represented by 20 or more proteins in at least three species. Of these, eight have an above average rate of change in at least three of the four species studied. The effect of both constrains (number of proteins and average rate) is detailed in Table S2.
To study protein domains with different binding specificity, we binned proteins containing domains with increasing number of interactions with other domains (extracted from the iPfam database) and calculated for each bin the rate of change. We considered bins of
proteins in Pold having proteins domains with i to i þ10 iPfam
interactions with i ranging from one to 15. We calculated the rate of
change(bin)as above.
We have used the iPfam database to search for plausible binding interfaces in all human interactions derived from the human protein reference database. We could assign a possible binding interface to
;20% of the human interactome. We then built two groups of
proteins according to the number of binding interactions per domain. We selected a group of proteins that had three or more interactions through one domain (likely more promiscuous domains), and a second group of proteins that interacted with three or more partners via multiple domains (likely more selective domains). We
then further subdivided the two groups into bins protein with i to iþ
5 interactions with i ranging from five to 15 and calculated the rate
(bin)as above (see Figure S1).
To study the different biological processes, we have binned
proteins in Pold according to the biological processes defined in
Gene Ontology [37] (downloaded from http://www.geneontology.org on 29 January 2006). For each Gene Ontology biological process, we have selected all proteins defined as participating in that biological process or any of its GO term children processes. For all such bins of proteins, we have calculated the rate of change of interactions as above.
Supporting Information
Figure S1. Dependence of the Calculated Rate of Change and
Fraction of Conserved Interactions After Duplication on Network Size
(A,B) Sampling of S. cerevisiae interactome. (C,D) Sampling of D.
melanogaster interactome. (E,F) Sampling of H. sapiens interactome.
(G,H) Sampling ofC. elegansinteractome.
(A,C,E,G) Sampling was done by randomly removing interactions. Any protein with no interaction is no longer considered as part of interactome.
(B,D,F,H) Sampling was done by randomly removing proteins and their interactions. Any protein with no interaction is no longer
considered as part of interactome. Filled squares (&), rate of change of
interactions. Open squares (&), fraction of interactions conserved
after duplication.
Found at doi:10.1371/journal.pcbi.0030025.sg001 (48 KB PDF).
Figure S2.Specificity of Binding Can Determine the Rate Change of Interactions in Groups of Proteins with the Same Connectivity (A) We binned all proteins according to the number of interactions with proteins originated before the split with the reference species and calculated the rates of change of interactions with recently duplicated proteins.
(B) We mapped the most likely interacting domains in the human interactome using the database of interacting motifs. We selected two
groups of proteins: blue circles (), proteins having three or more
interactions through at least two or more domains; red circles (), proteins having three or more interactions through the same domain. We binned both groups according to the number of interactions occurring in the full interactome with proteins originated before the split with the reference species and calculated the rates of change of interactions with recently duplicated proteins.
Found at doi:10.1371/journal.pcbi.0030025.sg002 (36 KB PDF).
Table S1.The Estimated Rate Calculated Is Robust to Variation in Accuracy of the Datasets Used
estimated rate of change of interactions calculated with the yeast two-hybrid method (including human high-throughput studies) was only marginally higher than those observed with the other two datasets (obtained exclusively from literature-derived protein interactions). Found at doi:10.1371/journal.pcbi.0030025.st001 (31 KB DOC).
Table S2.Impact of Constraining the List of Domains by Represen-tation in the Difference Species and by the Average Rate of Change To increase the reliability of the rate of change for each domain, we have selected only domains that were represented in most species by at least 20 domains. Of all Interpro domains, 96 observe this condition. Of these 96 domains, eight have an above average rate of change for at least three species studied. We can say that these eight domains consistently contribute to the fast rate of change in most species.
Found at doi:10.1371/journal.pcbi.0030025.st002 (26 KB DOC).
Acknowledgments
We are grateful to Martin Lercher, Ignacio Enrique Sanchez, Mark Isalan, Caroline Lemerle, and Silvia Santos for useful criticism and discussion. Pedro Beltrao is supported by a grant from Fundac¸a˜o para a Cieˆncia e Tecnologia through the Graduate Programme in Areas of Basic and Applied Biology.
Author contributions.PB and LS analyzed the data and wrote the paper. PB contributed reagents/materials/analysis tools.
Funding.The authors received no specific funding for this study. Competing interests.The authors have declared that no competing interests exist.
References
1. Walhout AJ, Sordella R, Lu X, Hartley JL, Temple GF, et al. (2000) Protein interaction mapping in C. elegans using proteins involved in vulval development. Science 287: 116–122.
2. Peri S, Navarro JD, Amanchy R, Kristiansen TZ, Jonnalagadda CK, et al. (2003) Development of human protein reference database as an initial platform for approaching systems biology in humans. Genome Res 13: 2363–2371.
3. Stelzl U, Worm U, Lalowski M, Haenig C, Brembeck FH, et al. (2005) A human protein–protein interaction network: A resource for annotating the proteome. Cell 122: 957–968.
4. Rual JF, Venkatesan K, Hao T, Hirozane-Kishikawa T, Dricot A, et al. (2005) Towards a proteome-scale map of the human protein–protein interaction network. Nature 437: 1173–1178.
5. Giot L, Bader JS, Brouwer C, Chaudhuri A, Kuang B, et al. (2003) A protein interaction map ofDrosophila melanogaster. Science 302: 1727–1736. 6. Ho Y, Gruhler A, Heilbut A, Bader GD, Moore L, et al. (2002) Systematic
identification of protein complexes in Saccharomyces cerevisiae by mass spectrometry. Nature 415: 180–183.
7. Gavin AC, Bosche M, Krause R, Grandi P, Marzioch M, et al. (2002) Functional organization of the yeast proteome by systematic analysis of protein complexes. Nature 415: 141–147.
8. Uetz P, Giot L, Cagney G, Mansfield TA, Judson RS, et al. (2000) A comprehensive analysis of protein–protein interactions in Saccharomyces cerevisiae. Nature 403: 623–627.
9. Ito T, Chiba T, Ozawa R, Yoshida M, Hattori M, et al. (2001) A comprehensive two-hybrid analysis to explore the yeast protein inter-actome. Proc Natl Acad Sci U S A 98: 4569–4574.
10. Fraser HB, Hirsh AE, Steinmetz LM, Scharfe C, Feldman MW (2002) Evolutionary rate in the protein interaction network. Science 296: 750–752. 11. Eisenberg E, Levanon EY (2003) Preferential attachment in the protein
network evolution. Phys Rev Lett 91: 138701.
12. Berg J, Lassig M, Wagner A (2004) Structure and evolution of protein interaction networks: A statistical model for link dynamics and gene duplications. BMC Evol Biol 4: 51.
13. Wagner A (2001) The yeast protein interaction network evolves rapidly and contains few redundant duplicate genes. Mol Biol Evol 18: 1283–1292. 14. Yeger-Lotem E, Sattath S, Kashtan N, Itzkovitz S, Milo R, et al. (2004)
Network motifs in integrated cellular networks of transcription–regulation and protein–protein interaction. Proc Natl Acad Sci U S A 101: 5934–5939. 15. Jeong H, Mason SP, Barabasi AL, Oltvai ZN (2001) Lethality and centrality
in protein networks. Nature 411: 41–42.
16. Qin H, Lu HH, Wu WB, Li WH (2003) Evolution of the yeast protein interaction network. Proc Natl Acad Sci U S A 100: 12820–12824. 17. Dujon B, Sherman D, Fischer G, Durrens P, Casaregola S, et al. (2004)
Genome evolution in yeasts. Nature 430: 35–44.
18. Dietrich FS, Voegeli S, Brachat S, Lerch A, Gates K, et al. (2004) TheAshbya gossypiigenome as a tool for mapping the ancientSaccharomyces cerevisiae genome. Science 304: 304–307.
19. Kellis M, Birren BW, Lander ES (2004) Proof and evolutionary analysis of ancient genome duplication in the yeastSaccharomyces cerevisiae. Nature 428: 617–624.
20. Gao LZ, Innan H (2004) Very low gene duplication rate in the yeast genome. Science 306: 1367–1370.
21. Lynch M, Conery JS (2000) The evolutionary fate and consequences of duplicate genes. Science 290: 1151–1155.
22. Matthews LR, Vaglio P, Reboul J, Ge H, Davis BP, et al. (2001) Identification of potential interaction networks using sequence-based searches for conserved protein–protein interactions or‘‘interologs.’’Genome Res 11: 2120–2126.
23. Yu H, Luscombe NM, Lu HX, Zhu X, Xia Y, et al. (2004) Annotation transfer between genomes: Protein–protein interologs and protein–DNA regulogs. Genome Res 14: 1107–1118.
24. Cesareni G, Ceol A, Gavrila C, Palazzi LM, Persico M, et al. (2005) Comparative interactomics. FEBS Lett 579: 1828–1833.
25. Gandhi TK, Zhong J, Mathivanan S, Karthick L, Chandrika KN, et al. (2006)
Analysis of the human protein interactome and comparison with yeast, worm and fly interaction datasets. Nat Genet 38: 285–293.
26. Kelley BP, Yuan B, Lewitter F, Sharan R, Stockwell BR, et al. (2004) PathBLAST: A tool for alignment of protein interaction networks. Nucleic Acids Res 32: W83–W88.
27. Sharan R, Suthram S, Kelley RM, Kuhn T, McCuine S, et al. (2005) Conserved patterns of protein interaction in multiple species. Proc Natl Acad Sci U S A 102: 1974–1979.
28. Flannick J, Novak A, Srinivasan BS, McAdams HH, Batzoglou S (2006) Graemlin: General and robust alignment of multiple large interaction networks. Genome Res 16: 1169–1181.
29. Hedges SB (2002) The origin and evolution of model organisms. Nat Rev Genet 3: 838–849.
30. Wagner A (2003) How the global structure of protein interaction networks evolves. Proc Biol Sci 270: 457–466.
31. Barabasi AL, Albert R (1999) Emergence of scaling in random networks. Science 286: 509–512.
32. Albert R, Jeong H, Barabasi AL (2000) Error and attack tolerance of complex networks. Nature 406: 378–382.
33. Mintseris J, Weng Z (2005) Structure, function, and evolution of transient and obligate protein–protein interactions. Proc Natl Acad Sci U S A 102: 10930–10935.
34. Neduva V, Russell RB (2005) Linear motifs: Evolutionary interaction switches. FEBS Lett 579: 3342–3345.
35. Cesareni G, Gimona M, Sudol M, Yaffe Meditors (2004) Modular protein domains. Weinheim: Wiley InterScience. 524 p.
36. Finn RD, Marshall M, Bateman A (2005) iPfam: Visualization of protein– protein interactions in PDB at domain and amino acid resolutions. Bioinformatics 21: 410–412.
37. Ashburner M, Ball CA, Blake JA, Botstein D, Butler H, et al. (2000) Gene ontology: Tool for the unification of biology. The Gene Ontology Consortium. Nat Genet 25: 25–29.
38. Kunin V, Pereira-Leal JB, Ouzounis CA (2004) Functional evolution of the yeast protein interaction network. Mol Biol Evol 21: 1171–1176. 39. King MC, Wilson AC (1975) Evolution at two levels in humans and
chimpanzees. Science 188: 107–116.
40. Carroll SB (2005) Evolution at two levels: On genes and form. PLoS Biol 3: e245.
41. Conant GC, Wolfe KH (2006) Functional partitioning of yeast co-expression networks after genome duplication. PLoS Biol 4: e109. 42. Papp B, Pal C, Hurst LD (2003) Dosage sensitivity and the evolution of gene
families in yeast. Nature 424: 194–197.
43. Cleveland DW, Lopata MA, Sherline P, Kirschner MW (1981) Unpolymer-ized tubulin modulates the level of tubulin mRNAs. Cell 25: 537–546. 44. Pereira-Leal JB, Levy ED, Teichmann SA (2006) The origins and evolution
of functional modules: Lessons from protein complexes. Philos Trans R Soc Lond B Biol Sci 361: 507–517.
45. Pereira-Leal JB, Teichmann SA (2005) Novel specificities emerge by stepwise duplication of functional modules. Genome Res 15: 552–559. 46. Clark AG, Glanowski S, Nielsen R, Thomas PD, Kejariwal A, et al. (2003)
Inferring nonneutral evolution from human–chimp–mouse orthologous gene trios. Science 302: 1960–1963.
47. Nielsen R, Bustamante C, Clark AG, Glanowski S, Sackton TB, et al. (2005) A scan for positively selected genes in the genomes of humans and chimpanzees. PLoS Biol 3: e170.
48. Brandman O, Ferrell JE Jr, Li R, Meyer T (2005) Interlinked fast and slow positive feedback loops drive reliable cell decisions. Science 310: 496–498. 49. O’Brien KP, Remm M, Sonnhammer EL (2005) Inparanoid: A comprehen-sive database of eukaryotic orthologs. Nucleic Acids Res 33: D476–D480. 50. Kellis M, Patterson N, Endrizzi M, Birren B, Lander ES (2003) Sequencing
and comparison of yeast species to identify genes and regulatory elements. Nature 423: 241–254.
52. Coghlan A, Wolfe KH (2002) Fourfold faster rate of genome rearrangement in nematodes than inDrosophila. Genome Res 12: 857–867.
53. Murphy WJ, Eizirik E, O’Brien SJ, Madsen O, Scally M, et al. (2001) Resolution of the early placental mammal radiation using Bayesian phylogenetics. Science 294: 2348–2351.
54. Alfarano C, Andrade CE, Anthony K, Bahroos N, Bajec M, et al. (2005) The
Biomolecular Interaction Network Database and related tools 2005 update. Nucleic Acids Res 33: D418–D424.
55. Mulder NJ, Apweiler R, Attwood TK, Bairoch A, Bateman A, et al. (2005) InterPro, progress and status in 2005. Nucleic Acids Res 33: D201–D205. 56. Lemmon MA (2003) Phosphoinositide recognition domains. Traffic 4: 201–