www.biogeosciences.net/12/4361/2015/ doi:10.5194/bg-12-4361-2015
© Author(s) 2015. CC Attribution 3.0 License.
High methane emissions dominated annual greenhouse gas
balances 30 years after bog rewetting
M. Vanselow-Algan1, S. R. Schmidt2, M. Greven1, C. Fiencke1, L. Kutzbach1, and E.-M. Pfeiffer1
1University of Hamburg, Center for Earth System Research and Sustainability, Institute of Soil Science, Hamburg, Germany 2University of Hamburg, Biocenter Klein Flottbek, Applied Plant Ecology, Hamburg, Germany
Correspondence to:M. Vanselow-Algan ([email protected])
Received: 16 December 2014 – Published in Biogeosciences Discuss.: 10 February 2015 Accepted: 1 July 2015 – Published: 28 July 2015
Abstract.Natural peatlands are important carbon sinks and sources of methane (CH4). In contrast, drained peatlands turn from a carbon sink to a carbon source and potentially emit nitrous oxide (N2O). Rewetting of peatlands thus potentially implies climate change mitigation. However, data about the time span that is needed for the re-establishment of the car-bon sink function by restoration are scarce. We therefore investigated the annual greenhouse gas (GHG) balances of three differently vegetated sites of a bog ecosystem 30 years after rewetting. All three vegetation communities turned out to be sources of carbon dioxide (CO2) ranging between 0.6±1.43 t CO2ha−2yr−1 (Sphagnum-dominated vegeta-tion) and 3.09±3.86 t CO2ha−2yr−1(vegetation dominated
by heath). While accounting for the different global warming potential (GWP) of CO2, CH4 and N2O, the annual GHG balance was calculated. Emissions ranged between 25 and 53 t CO2-eq ha−1yr−1 and were dominated by large emis-sions of CH4(22–51 t CO2-eq ha−1yr−1), with highest rates found at purple moor grass(Molinia caerulea)stands. These are to our knowledge the highest CH4 emissions so far ported for bog ecosystems in temperate Europe. As the re-stored area was subject to large fluctuations in the water ta-ble, we assume that the high CH4emission rates were caused by a combination of both the temporal inundation of the eas-ily decomposable plant litter of purple moor grass and the plant-mediated transport through its tissues. In addition, as a result of the land use history, mixed soil material due to peat extraction and refilling can serve as an explanation. With re-gards to the long time span passed since rewetting, we note that the initial increase in CH4emissions due to rewetting as described in the literature is not inevitably limited to a short-term period.
1 Introduction
Covering only 3 % of the Earth’s land surface, peatlands store as much carbon as all terrestrial biomass and twice as much as all global forest biomass (Parish et al., 2008). Today, merely 1 % of the former peatlands areas in western Europe still has living mire vegetation and accumulates peat (Koster and Favier, 2005). An area of 80 million ha of peatlands have been destroyed worldwide, mainly due to drainage for agri-culture and forestry, and due to peat mining for fuel and hor-ticulture (Joosten and Clarke, 2002). While growing mires have a cooling effect on the climate by acting as a carbon sink, degraded peatlands are a major and growing source of the greenhouse gases (GHG) carbon dioxide (CO2)and ni-trous oxide (N2O; Joosten et al., 2012).
1998; Tuittila et al., 2000; Waddington and Day, 2007; Wil-son et al., 2009; Cooper et al., 2014). Flooding of peat soils for restoration should be avoided as inundation leads to huge CH4emissions especially if fresh plant litter is available (Au-gustin and Joosten, 2007; Drösler et al., 2008; Hahn-Schöfl et al., 2011). Although these high CH4emissions are gener-ally assumed to be a transient phenomenon of limited dura-tion (Morison, 2012; Joosten et al., 2012; Artz et al., 2013; Cooper et al., 2014), no information exists on the length of this time span after rewetting (Augustin and Joosten, 2007). Nevertheless, the term “short-term” is often used in grey lit-erature (Trepel, 2008; Morison, 2012). Moreover, there is high uncertainty about the magnitude of CH4fluxes in peat-lands (Joabsson et al., 1999). However, it is generally agreed that vascular plants stimulate CH4 emissions by allowing the gas to bypass the oxygenated upper soil layer moving through the plant tissues (Joabsson et al., 1999; Kutzbach et al., 2004; Lai, 2009). This plant-mediated transport can rep-resent between 30 and almost 100 % of the total methane flux (Bhullar et al., 2013). Plants that provide such a shortcut be-tween the root zone and the atmosphere are referred to as “shunt” species (Joosten et al., 2012). Many studies linked the increase of CH4 emissions post-restoration to the colo-nization of the rewetted area byEriophorumspecies (Tuittila et al., 2000; Waddington and Day, 2007; Green and Baird, 2012; Cooper et al., 2014).
In the future, restoration and management of peatlands will be more complex and challenging due to climate change (Erwin, 2009; Grand-Clement et al., 2013). Thus, extensive knowledge of peat soil processes will help in the adapta-tion of management practices and in turn in stabilizaadapta-tion of ecosystem functions of peatlands against new environmental threats. However, data about the C balance of restored and abandoned peatlands is scarce on national and global scales and is urgently needed (Yli-Petäys et al., 2007; Artz et al., 2013). As most studies focus on the boreal region or are con-ducted mainly at recently rewetted sites (Beyer and Höper, 2015), research on the mid- and long-term effect of rewet-ting is essential, especially in temperate peatlands.
We studied the CO2 and GHG balances of three differ-ent plant communities at a regenerating mined area and of the active peat extraction site within the same ombrotrophic peatland in northern Germany. Our main goal was to inves-tigate if restoration succeeded in creating a CO2sink and to estimate the GHG mitigation potential of restoring the indus-trial peat extraction site after abandonment. We hypothesized that the restored site acted as a CO2sink with varying magni-tude depending on plant community. Likewise, we expected that higher CH4emissions were related to high abundance of vascular plant species and thus varied between the three plant communities. On the other hand, no significant N2O fluxes were expected on the vegetated sites. Testing theses hypotheses could provide recommendations for site-specific management actions, because peat mining of the study area will be ceased in a few years.
2 Material and methods 2.1 Study area Himmelmoor
The Himmelmoor (Quickborn, Germany; 53◦44′20′′N,
9◦50′58′′E) is located approximately 20 km northwest of
Hamburg in Schleswig-Holstein. The mean annual precipita-tion measured at the climate staprecipita-tion in Quickborn is 838 mm, and the mean air temperature is 9.0◦C (long-term average
from 1981 to 2010, data source: Deutscher Wetterdienst). Climatically, there was 821 mm of precipitation and an aver-age temperature of 9.6◦C during study year 2011, very close
to the long-term average. We therefore consider our measure-ments as representative for the present climatic conditions.
With an extent of about 6 km2, the Himmelmoor is one of the largest raised bogs in Schleswig-Holstein. Peat formation by terrestrialization started after the last ice age 10.020±100
years before present and the total peat thickness reached a maximum of 10 m (Pfeiffer, 1998; Grube et al., 2010). The original ombrotrophic peat bog was altered by peat drainage and cutting began in the 18th century. Commercial peat min-ing started in 1871 (Averdieck, 1957) and persists to this day. According to the peat mining company, a volume of 38 000 m3of peat was harvested in the study year 2011 over an area of 70 ha of the former 130 ha extraction site (K. Cz-erwonka, personal communication, 2013). Peat mining will cease in 2016 due to the exhaustion of usable peat resources, and restoration will take place.
2.2 Measurement sites
Measurements were done on the bare and deeply drained ac-tive peat extraction site and on a restored and vegetated part in the northwestern Himmelmoor. All soils are classified as Fibric Ombric Histosol, while for the peat extraction site, the suffix qualifier Drainic applies in addition (IUSS, 2006). The restored site was formerly used by hand block-cutting for fuel. Before cutting the drained black peat, the upper rooted layer called Bunkerde (Poschlod, 1988) was removed and used for filling up cut-over areas as described in Koster and Favier (2005). In the 1960s the site was abandoned and vege-tation development started, mainly from whole plants or gen-erative and vegetative propagules in theBunkerde.
moss cover was determined using pointintercept sampling as described in Jonasson (1988), with the following categories:
Sphagnummosses, other mosses, liverworts and bare peat.
GHG fluxes were measured at each of the four sites in four replicates (plots). Therefore, PVC frames (60 cm×60 cm)
with a soil insertion depth of about 50 cm were permanently installed blockwise. Positions were selected based on vegeta-tion and microtopography with the intenvegeta-tion of representing the whole site. All plots of the vegetated site were equipped with wooden boardwalks to minimize soil gas disturbances during flux measurements. Boardwalks were oriented north-wards of the plots to avoid shading. Several micrometeo-rological variables were continuously monitored at a cen-tral point of the restored site, including air temperature and air pressure, photosynthetically active radiation (PAR), wind speed and wind direction (all at 2 m height) and precipitation. Water table depth and soil temperature (10 cm depth) were measured at each site except for the peat extraction site.
2.3 Chamber design and flux measurement procedure GHG flux measurements were done using closed chambers. Their design conforms to the latest recommendations for chamber design made by Pihlatie et al. (2013). CO2fluxes were measured with a transparent, climate-controlled cham-ber system connected to an infrared gas analyzer (IRGA, LI-840, LI-COR inc.) as described by Schneider et al. (Schnei-der et al., 2011). Additionally, the chamber was equipped with a PAR sensor inside. Measurements were done for 3 min, recording CO2 concentration, PAR and chamber air temperature every second. To gain a wide spectrum of dif-ferent light conditions for modeling, the transparent cham-ber was shaded in two intensities with black gauze (Elsgaard et al., 2012; Görres et al., 2014). After the first measure-ment with the transparent chamber, a second measuremeasure-ment was performed while shading the chamber with one layer of gauze (PAR approx. 50 %) and a third measurement was done with two layers (PAR approx 30 %). Subsequently, the cham-ber was darkened in a fourth measurement with an opaque cover (PAR=0) to estimate ecosystem respiration (Reco).
Between each measurement the chamber was removed and ventilated to obtain ambient CO2concentrations within the chamber. If vegetation exceeded chamber height, a trans-parent polycarbonate elongation of 60 cm height was used, which was shaded and darkened correspondingly. Measure-ments were generally conducted between 10:00 and 14:00 local time when PAR reached the maximum, and the mea-suring order of the sites was randomized. CO2flux measure-ments were performed year-round from August 2010 until January 2012. Measurement intervals depended on vegeta-tion growth with higher frequency in summer than in winter (at least twice a month up to twice a week). To compare day and night respiratory fluxes, nighttime measurements were taken three times during the night of 30–31 August 2011 (around 21:00, 00:00 and 05:00). CH4 and N2O flux
mea-surements were performed over a 1-year period from April 2011 until March 2012. Measurements were carried out ev-ery 2 weeks (except December 2011: once per month) for CH4 and monthly for N2O as first results showed no sig-nificant N2O fluxes. CH4was measured at all four replicate plots, N2O only at three. Nighttime measurements were per-formed during the night of 30 to 31 August 2011 around mid-night. CH4and N2O flux measurements were done using alu-minum chambers (60 cm×60 cm×32 cm; an elongation of
60 cm was used if needed) which were equipped with a fan, a pressure vent, a temperature sensor and a sampling port. Two circular openings (4 cm diameter) at the front side were open while placing the chamber on the collar and closed af-terwards to reduce initial pressure shocks (Schneider et al., 2009). During the closure time of 20 min, six samples were taken from the chamber headspace with 60 mL plastic sy-ringes connected to the sampling port via three-way stop-cocks.
CH4samples were analyzed subsequently in the lab using a gas chromatograph (GC) equipped with a flame ionization detector (HP 5890 Packard Series II). Syringes were directly connected via a loop. Analyses were done within 4 days af-ter sampling, and each sample was analyzed twice. Two stan-dard gases were used for calibration (1.7 and 200 ppm CH4), injected in triplicates before and after samples of three plots. N2O was measured at a GC provided with an electron cap-ture detector (Agilent Technologies 7890A). In the field, a sample volume of 20 mL was injected into an air-filled sep-tum vial, from where it was then taken with a microliter sy-ringe and injected into the GC. The GC was calibrated daily with three standard gases (0.3, 0.9 and 1.5 ppm N2O) being injected in triplicates before measurement. Since the samples were diluted by injecting them into the air-filled vials, stan-dards were treated similarly to have the appropriate concen-tration. As this procedure might cause a decrease in accuracy, it was tested with a standard gas. There was no decrease in reproducibility in comparison to a standard gas that was in-jected directly into the GC: the coefficient of variation was 0.01 in both cases (N =10).
2.4 Flux calculation
The GHG flux rates were calculated from the change in gas concentration as a function of time during chamber clo-sure. Gross primary production (GPP) was calculated as the difference between the directly following measurements with transparent and dark chambers, respectively. According to the micrometeorological sign convention, positive values represent fluxes to the atmosphere and negative values up-takes by the ecosystem.
mea-surement were discarded and the flux rate was calculated att=10 s from the remaining 160 CO2 concentration data
points applying a water vapor dilution correction. Each sin-gle flux curve was reviewed for abnormalities such as abrupt changes in slope due to, e.g., changes in PAR derived from cloud movement. If possible, the flux was recalculated by using only a part of the 160 s interval with constant condi-tions (minimum 40 s). Flux calculacondi-tions with outlying resid-uals were checked for mistakes, e.g., in data preparation, and were discarded from the data set if the mistake could not be eliminated. The standard deviation of the residuals of most of the data (98 %) was lower than 0.55 ppm and had a mean of 0.42±0.06 ppm, which is remarkably low as the noise of
the IRGA is specified to be < 1 ppm. Upward concave flux curves, which are not explainable by diffusion theory were calculated using linear regression as executed by Schneider et al. (2011). It was shown that this procedure achieves more robust and less biased flux estimates (Schäfer, 2012; Görres et al., 2014).
Flux calculation of each CH4and N2O chamber measure-ment was done with an updated version of the MATLAB® routine of Forbrich et al. (2010). Each single flux curve was reviewed for abnormalities such as ebullition and discarded from data set if necessary. Linear or nonlinear regression was used depending on the model performances according to the Akaike information criterion. As only six concentration mea-surements were available for flux calculation, we used the Akaike information criterion with small sample correction (AICc), as proposed by Forbrich et al. (2010). According to AICc, the majority of CH4and N2O fluxes curves was better explained by linear than by exponential regression (74 and 98 %, respectively).
2.5 Flux modeling
Net ecosystem exchange (NEE), Reco and GPP were mod-eled over a complete year (2011). Modeling of GPP and Reco was based on ambient PAR and air temperature, respectively, which were measured half-hourly at the meteorological sta-tion. Each single plot (N=16) was modeled separately to
analyze the differences between and within the sites. Values of the four plots per site were later averaged, thus standard deviations shown here display the spatial variability of flux estimates. As day and night fluxes of CO2, CH4 and N2O were not statistically different, modeling was only based on daytime data.
GPP was modeled with a rectangular hyperbolic light re-sponse curve as described in Elsgaard et al. (2012) using PAR values from inside the chamber (GPP 1 model, Table 1). Ap-plying this curve obtains light saturation points (Pmax) for a certain period of the year (1 week up to 1 month depending on measurement interval and season). Gap filling between these intervals was done using linear interpolation. If GPP 1 could not explain the data appropriately, a linear model was used instead (GPP 2, Table 1). In wintertime when GPP
ranged around zero, neither of the two models could be fitted and mean values were used instead.
To estimate annual Reco fluxes, we used air and soil temperature as explanatory variables and tested two differ-ent models (Table 1), using all respiratory flux data of the study year for each plot. Comparing the qualifying parame-terRadjusted2 of the model results showed that the respiratory fluxes were better explained by air than by soil temperature and that Reco 1 model achieved better results than Reco 2 model. The annual Reco fluxes of the industrial extraction site were estimated using linear regression, as both models resulted in low Radjusted2 values ranging between 0.03 and 0.33.
Methane fluxes did not show a soil temperature or water table depth dependency. Annual fluxes were thus not mod-eled with the classical model of Saarnio et al. (1997) as in-tended, but calculated with linear interpolation, as done for the annual N2O flux rates.
2.6 Calculation of the GHG budget
For the calculation of the GHG budget, the fluxes of CH4 and N2O were converted in CO2equivalent according to their global warming potentials on a 100-year timescale including climate–carbon feedbacks: CH4=34 and N2O=298 (IPCC,
2013). The C loss due to peat mining was also estimated in CO2equivalent. The calculation was based on the amount of peat harvested in the study year relative to bulk density and C content of the peat, measured within the upper three soil horizons.
3 Results 3.1 Water table
The four sites displayed differences in water table depth throughout the year (Fig. 1). TheSphagnumsite had the high-est water table followed by the heath and the purple moor grass site with an annual mean for 2011 of 1.2,−0.8 and −2.7 cm, respectively. The lowest water table was recorded
at the drained active industrial extraction site with a mini-mum of 55 cm under the soil surface and a mean of−23 cm
for a 12-month period from April 2011 to March 2012. The industrial extraction site faces a great range of water table amplitude. In contrast, the variation in the water table depth of the three vegetated sites was much less, but soil surfaces were often inundated especially in the winter half of the year.
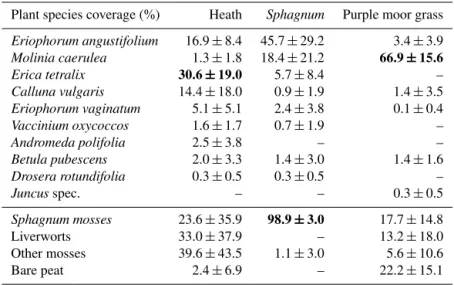
3.2 Vegetation
The vegetation analysis showed clear differences in species coverage between the three defined sites (Table 2). The heath site was dominated by ericaceous shrubs (49 % cumulative coverage ofErica tetralix,Calluna vulgaris,Vaccinium
Table 1.Two model approaches for gross primary production (GPP) as a function of photosynthetically active radiance (PAR) and two temperature-driven ecosystem respiration (Reco) models, wheret=air or soil temperature, respectively, anda,bandcare fitting parameters.
Model title Model formula Remarks
GPP 1 GPP= PmaxαPAR
Pmax+αPAR Rectangular hyperbolic function (Schäfer, 2012; Elsgaard et al., 2012).
Pmax=maximum potential photosynthetic rate,
α=initial light response efficiency. GPP 2 GPP=a+bPAR Linear model,aandbare fitting parameters.
Reco 1 Reco= a
1+be−kt Simple logistic function (Richards, 1959; Rodeghiero and Cescatti, 2005; Schäfer, 2012). Reco 2 Reco=aebt Two-parameter exponential function
(Schneider et al., 2009; Schäfer, 2012)
A S O N D J F M A M J J A S O N D J F M A
-60 -55 -50 -45 -40 -35 -30 -25 -20 -15 -10 -5 0 5 10 n o d a ta a v a ila b le n o d a ta a v a ila b le no data available 2011 Heath Sphagnum Purple moor grass Industrial extraction W a te r le v e l (c m ) 0 5 10 15 20 25 30 P re c ip it a ti o n ( m m ) 2012 2010
Figure 1. Mean daily water table and daily precipitation at four different bog sites over the whole measurement period from July 2010 until April 2012. No data available for the industrial extraction site before April 2011. Negative values indicate water levels below soil surface and positive values indicate inundation.
99 % coverage ofSphagnummosses (mainlyS. cuspidatum
andS. fimbriatum)and the purple moor grass site was
dom-inated by the perennial deciduous grass Molinia caerulea
(67 % coverage). Sites additionally differed in the number of vascular plant species decreasing in the following order: heath >Sphagnum > purple moor grass with in total nine, eight and six species, respectively.
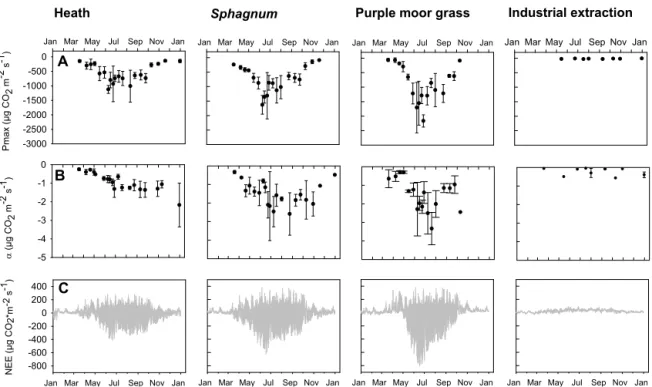
3.3 NEE model
The results of the modeled Reco (Fig. 2) and the modeled GPP were summed up resulting in modeled net ecosystem exchange (NEE; Fig. 3). The temporal dynamics between the sites were quite similar for the heath and the Sphag-numsite. However, theSphagnumsite displayed some more pronounced peaks in photosynthesis. The purple moor grass site had a steep increase in photosynthesis in May and was very productive in summertime, while photosynthesis at the two other vegetated sites began earlier and with a slower
in-Reco
(µg
CO
2
m
-2 s -1) 0 200 400 600 800
R2 adj. = 0.72 R2 adj. = 0.78 R2 adj. = 0.81 R2 adj. = 0.75
R2 adj. = 0.67 R2 adj. = 0.75 R2 adj. = 0.82 R2 adj. = 0.73
Heath Sphagnum
Air temperature (°C)
0 5 10 15 20 25 30
0 200 400 600 800
R2 adj. = 0.67 R2 adj. = 0.75 R2 adj. = 0.72 R2 adj. = 0.69
0 5 10 15 20 25 30
R2 adj. = 0.72 R2 adj. = 0.67 R2 adj. = 0.52 R2 adj. = 0.46
Industrial extraction Purple moor grass
Figure 2.Measured ecosystem respiration (Reco) as a function of air temperature. Points indicate fluxes±standard error of the flux calculation. The replicate plots of each site are shown in differ-ent colors. Lines represdiffer-ent the fits to raw data using Reco 1 model. For the industrial extraction site a linear regression was used. The goodness-of-fit is indicated (Radjusted2 ).
crease. Before the steep increase in photosynthesis at the pur-ple moor grass site, respiratory fluxes predominated and in-creased from March until May. The industrial extraction site was characterized by comparatively low respiratory fluxes.
3.4 CO2budget
Table 2.Average coverage of vascular plant species according to Londo (1976) at the three rewetted bog sites in 2011. Coverage of the moss layer and bare peat areas were estimated using pointintercept sampling (Jonasson, 1988). Values refer to means of 7–8 replicates±SD. Numbers in bold print indicate eponymous species for site denotation.Sphagnumspecies were mainlyS. cuspidatumandS. fimbriatum. A dash indicates that the species was not found.
Plant species coverage (%) Heath Sphagnum Purple moor grass
Eriophorum angustifolium 16.9±8.4 45.7±29.2 3.4±3.9
Molinia caerulea 1.3±1.8 18.4±21.2 66.9±15.6
Erica tetralix 30.6±19.0 5.7±8.4 –
Calluna vulgaris 14.4±18.0 0.9±1.9 1.4±3.5
Eriophorum vaginatum 5.1±5.1 2.4±3.8 0.1±0.4
Vaccinium oxycoccos 1.6±1.7 0.7±1.9 –
Andromeda polifolia 2.5±3.8 – –
Betula pubescens 2.0±3.3 1.4±3.0 1.4±1.6
Drosera rotundifolia 0.3±0.5 0.3±0.5 –
Juncusspec. – – 0.3±0.5
Sphagnum mosses 23.6±35.9 98.9±3.0 17.7±14.8
Liverworts 33.0±37.9 – 13.2±18.0
Other mosses 39.6±43.5 1.1±3.0 5.6±10.6
Bare peat 2.4±6.9 – 22.2±15.1
Table 3.Mean annual CH4and N2O fluxes±SD at four different bog sites. Values refer to means of four replicates±SD.
Site CH4(µg m−2s−1) N2O (µg m−2s−1)
Heath 2.02±0.41 −0.0008±0.0038
Sphagnum 3.16±2.20 0.0017±0.0021
Purple moor grass 4.71±3.32 −0.0013±0.0038 Industrial extraction 0.01±0.02 0.0165±0.0086
59.56±142.58 g m2yr−1, respectively. These differences in
NEE between the sites were closely approximating signifi-cance (ANOVA,p=0.055).
3.5 CH4and N2O fluxes
CH4 emissions showed no seasonal trend and were not dependent on water level or soil temperature (data not shown). However, CH4fluxes differed significantly among sites (ANOVA,p< 0.00): CH4fluxes of the industrial extrac-tion site ranged around zero, while the vegetated sites acted as CH4sources. CH4emissions increased in the following or-der (Table 3): heath <Sphagnum< purple moor grass. N2O fluxes were significantly different between the industrial ex-traction site and the vegetated sites (ANOVA, p=0.002).
Significant emission of N2O were only measured at the in-dustrial extraction site at summertime, resulting in mean an-nual emissions of 0.0165±0.0086 µg m−2s−1. N2O fluxes
of the rewetted sites were very low, ranging around zero and varying between small uptakes and emissions throughout the whole year.
3.6 Greenhouse gas balance
CH4 and N2O fluxes were calculated into CO2 equivalent (CO2-eq) and summed with the CO2fluxes as a GHG bud-get (Table 4). We found that all sites were significant sources of greenhouse gases. The GHG balance of the rewetted sites was dominated by CH4emissions, accounting for 88–98 % of the total GHG CO2-eq emissions. The portion of N2O was negligible there, while it played with about 21 % of the GHG balance a significant role at the industrial extraction site (1.55±0.81 t CO2-eq ha−1yr−1). The uncertainty of the GHG budget was high due to high spatial variability between the replicates. Nevertheless, differences between the sites were statistically different (p < 0.05, Kruskal–Wallis one way ANOVA). The highest GHG emissions were detected at the purple moor grass site (53.05±35.72 t CO2-eq ha−1
yr−1), whereas the lowest GHG emissions were present at the industrial extraction site (8.9±1.1 t CO2-eq ha−1 yr−1). However, the GHG balance of the industrial extraction site is not complete without considering the amount of mined peat. Including these C losses and assuming their release as CO2, the GHG balance of the industrial extraction site was considerably higher than those of the vegetated sites (123±7 t CO2-eq ha−1yr−1).
4 Discussion
Heath
Jan Mar May Jul Sep Nov Jan
NE
E
(µg
CO
2*m
-2 s -1)
-800 -600 -400 -200 0 200 400
Sphagnum
Jan Mar May Jul Sep Nov Jan
Purple moor grass
Jan Mar May Jul Sep Nov Jan
Industrial extraction
Jan Mar May Jul Sep Nov Jan
C
Jan Mar May Jul Sep Nov Jan
P
m
ax
(µg
CO
2
m
-2 s -1)
-3000 -2500 -2000 -1500 -1000 -500
0 A
Jan Mar May Jul Sep Nov Jan Jan Mar May Jul Sep Nov Jan Jan Mar May Jul Sep Nov Jan
(µg
CO
2
m
-2 s -1)
-5 -4 -3 -2 -1 0
B
Figure 3.Model parameters for gross primary production (GPP 1 model) in 2011:(a)maximum photosynthetic activity (Pmax) and(b)values for the initial light response efficiency (α). Points indicate means of four replicate plots±SD.(c)Mean modeled net ecosystem exchange (NEE) in 2011. Positive values represent emissions and negative values uptakes.
-4000 -3000 -2000 -1000 0 1000 2000 3000 4000
CO
2
(g
m
-2 y
r-1
)
Industrial extraction Sphagnum
Heath Purple moor grass
GPP NEE Reco
GPP
Reco NEE RecoNEE RecoNEE
GPP
GPP
Figure 4.Annual CO2budgets of four different bog sites in 2011. GPP: gross primary production, Reco: ecosystem respiration and NEE: net ecosystem exchange. Values represent means of the model results of four replicates (plots) at each site±SD. Positive values represent emissions and negative values uptakes.
Sphagnum mosses with sedges (Sphagnumsite) and nearly
monospecific stands of the perennial deciduous grass M.
caerulea(purple moor grass site). We assume the differences
in vegetation composition to be a result of the different wa-ter table levels. As the lowest wawa-ter table position was de-tected at the purple moor grass site, the combination of both the relatively drier surface and the appearance of the non-typical bog plant resulted in significant differences in GHG fluxes compared to the other two vegetated sites. Here, the highest CH4 fluxes were measured, as well as the highest GPP and highest maximum photosynthetic activity. The fast growth ofM. caerulealeaves and their autumn senescence can explain the annual dynamics of the modeled NEE at the purple moor grass site. This grass performs no
photosynthe-sis in wintertime except at green basal internodes (Jefferies, 1915). Thus, photosynthesis steeply increases with spring-time growth and abruptly stops with the dieback of its leaves in fall. By contrast, photosynthesis was detected in winter-time at theSphagnumand the heath site as they were domi-nated by evergreen plants.
All three vegetation communities established at the re-stored study site turned out to be sources of CO2. Thus, restoration failed to re-establish the CO2 sink function af-ter 30 years, in contrast to what was hypothesized. However,
theSphagnumsite had the lowest CO2emissions ranges and,
Table 4.Greenhouse gas (GHG) budgets of four bog sites. The GHG budget of the active industrial extraction site is composed of measured fluxes on site and the C loss due to peat mining in 2011, assuming its emission as CO2. Values represent means of four (CO2and CH4)or three (N2O) replicates±SD.
Site CO2 CH4 N2O Sum
(tCO2-eq ha−1yr−1)
Heath 3.09±3.86 21.61±4.44 −0.07±0.36 24.63±5.89
Sphagnum 0.60±1.43 33.87±23.63 0.16±0.20 34.62±23.68
Purple moor grass 2.47±3.30 50.45±35.56 0.12±0.36 53.05±35.72
Industrial extraction
On site 7.30±0.67∗ 0.07±0.22 1.55±0.81 8.93±1.07
Peat mining 114.02±6.70 114.02±6.70
Total 122.95±6.78
∗Three replicates.
13 t CO2ha−1yr−1 (Drösler et al., 2008). Rewetting of the industrial extraction site provides a CO2mitigation potential between 422 and 671 g CO2m−2yr−1(peat extraction not in-cluded) calculated from the CO2budgets of the three rewet-ted sites. This is in total 295 to 470 t CO2yr−1for the whole site (70 ha), depending on which of the three vegetation com-munities establishes. However, restoring a cut-over peatland requires special techniques as mostSphagnumspecies can-not re-establish spontaneously and re-vegetation is gener-ally slow due to no viable propagules and unfavorable con-ditions for plant growth and seed germination (Quinty and Rochefort, 2003; Triisberg et al., 2011; D’Astous et al., 2013).
The GHG budget of the restored site is dominated by CH4 fluxes (up to 98 %). While the magnitude of the modeled CO2 balances is similar to data reported in other studies as de-scribed above, the magnitude of the CH4fluxes is very high. To our knowledge, the maximum rates reported for Euro-pean bogs are: approximately 17 t CO2-eq ha−1yr−1, which was measured in the Bavarian Alpine foreland on a nat-ural bog site with Sphagnum–Scheuchzeria palustris hol-lows (Drösler, 2005) and 24 t CO2-eq ha−1yr−1measured in
E.vaginatum-colonized infilled ditches of a blanked bog in
Wales (Cooper et al., 2014). In the present study, we found annual CH4fluxes of 22, 34 and 51 t CO2-eq ha−1yr−1. We hypothesize that the large fluctuations in water level, which are typical for degraded peatlands (Schouwenaars, 1993; Tuittila et al., 1999), might explain these high CH4emissions as fresh belowground or aboveground plant litter is inundated episodically and undergoes anoxic fermentation (Augustin and Joosten, 2007; Paul and Alewell, 2013). This applies es-pecially for the purple moor grass site although it features the lowest water level of the three vegetated sites: here, CH4 fluxes were higher than at the Sphagnumand the heath site (2.3 and 1.5 times, respectively). We suggest that this is due to the large amounts of litter produced byM. caerulea, which is easily decomposable in comparison to other plants present
at the study site (van Breemen, 1998). Like we found here, Bohdalkova et al. (2013) observed the highest CH4emissions at the site with the lowest water level and suggested this to be the result of the invasion of easily degradable vascu-lar plants. Likewise, Hahn-Schöfl et al. (2011) explained ex-tremely high CH4emissions in a German fen with the inun-dation of reed canary grass (Phalaris arundinacea). Another likely explanation for the huge CH4fluxes from the purple moor grass site is the presence of aerenchyma (Jaiswal et al., 2000), through whichM. caeruleacan act as gas conduit. It hence allows CH4 to bypass the oxidized surface soil, and consequently reduces CH4 oxidation. Although the flux of CH4through the plant tissues is lower inM. caerulea com-pared to E. angustifolium(Bhullar et al., 2013), the chim-ney effect might be increased by the high cover of this grass species at the purple moor grass site. Thus, it was shown that in some plots CH4emissions coincided with high coverage of aerenchymatous plant species. The composition of plant communities is therefore the most important driver for CH4 fluxes at the study sites, as reported by other authors (Samar-itani et al., 2010; Couwenberg et al., 2011; Bohdalkova et al., 2013).
drainage ditches blocked with heather bales and colonized by aerenchymatous species as hotspots for CH4emissions. However, it must be kept in mind that the heather bales in Cooper et al. (2014) were recently incorporated, while in the present study the incorporation of fresh plant material into the soil is several decades past and can therefore only play a minor role in explaining the high methane emissions found here.
These findings are important for a large area of exploited peatlands, because the peat extraction method applied here was long the traditional way of peat cutting (Koster and Favier, 2005). It is therefore essential that more attention is paid to monitoring and management of areas with a hand-cutting history. In terms of CH4mitigation and climate pro-tection, an active reduction ofM. caeruleastands, by for ex-ample sod cutting or grazing, could help to establish target species communities instead (Jacquemart et al., 2003; Reid et al., 2009; Keddy, 2010; Meuser, 2012), and hence reduce CH4emissions at the study site. Avoiding water table fluctua-tions is additionally important to impede inundation of fresh plant litter as a substrate for methanogenesis (Hahn-Schöfl et al., 2011). The installation of overflows as management measure could stabilize the water table level (Maitland and Morgan, 1997; Quinty and Rochefort, 2003).
5 Conclusions
We found large differences in GHG fluxes between the three vegetation communities. Differentiation between plant com-munities for estimation and upscaling of GHG budgets is therefore imperative. The particular land use history of this degenerated peat site, in combination with inundation due to water tables fluctuations and a high cover of aerenchyma-tous plants seem to form favorable conditions for both, high methanogenesis and efficient soil atmosphere CH4transport. This results in extremely high CH4emissions and high GHG budgets in comparison to other bog ecosystems in Europe. The annual GHG emissions are at least twice as high as the rates of the industrial extraction site, although 30 years passed since rewetting. We therefore state that the initial in-crease in CH4emissions due to rewetting was not limited to a short-term period at our study site, as described in literature. We raise here the question if the emergence of high methane fluxes is, on the contrary, permanent in severely damaged rewetted peatlands, as it is not possible to fully reestablish ecosystem functions.
Acknowledgements. We wish to acknowledge the support of the
peat company manager in the Himmelmoor, Klaus Czerwonka, and the committed field and lab assistance of Birgit Grabellus, Math-ias Schwarzer, Stephanie Langer and Kira Kalinski. We appreciate the technical support from Christian Wille and Peter Schreiber during the planning and preparation stages of this study. This work was carried out within the research project KLIMZUG-Nord,
which was funded by the German Federal Ministry of Education and Research (grant no. 01LR0805D). L. Kutzbach was supported through the Cluster of Excellence “CliSAP” (EXC177) at the University of Hamburg funded through the German Research Foundation.
Edited by: X. Wang
References
Artz, R. R. E., Chapman, S. J., Saunders, M., Evans, C. D., and Matthews, R. B.: Comment on “Soil CO2, CH4and N2O fluxes from an afforested lowland raised peat bog in Scotland: impli-cations for drainage and restoration” by Yamulki et al. (2013), Biogeosciences, 10, 7623–7630, doi:10.5194/bg-10-7623-2013, 2013.
Augustin, J. and Joosten, H.: Peatland rewetting and the greenhouse effect, International Mire Conservation Group Newsletter, 3, 29– 30, 2007.
Averdieck, F.-R.: Zur Geschichte der Moore und Waelder Hol-steins: ein Beitrag zur Frage der Rekurrenzflaechen, Nova Acta Leopolina, 130, 27–34, 1957 (in German).
Beyer, C. and Höper, H.: Greenhouse gas exchange of rewetted bog peat extraction sites and aSphagnumcultivation site in north-west Germany, Biogeosciences, 12, 2101–2117, doi:10.5194/bg-12-2101-2015, 2015.
Bhullar, G. S., Edwards, P. J., and Olde Venterink, H.: Variation in the plant-mediated methane transport and its importance for methane emission from intact wetland peat mesocosms, J. Plant Ecol., 6, 298–304, doi:10.1093/jpe/rts045, 2013.
Bohdalkova, L., Curik, J., Kubena, A. A., and Buzek, F.: Dynam-ics of methane fluxes from two peat bogs in the Ore Mountains, Czech Republic, Plant Soil Environ., 59, 14–21, 2013.
Cooper, M. D. A., Evans, C. D., Zielinski, P., Levy, P. E., Gray, A., Peacock, M., Norris, D., Fenner, N., and Freeman, C.: Infilled Ditches are Hotspots of Landscape Methane Flux Following Peatland Re-wetting, Ecosystems, 17, 1227–1241, doi:10.1007/s10021-014-9791-3, 2014.
Couwenberg, J.: Methane emissions from peat soils (organic soils, histosols), Facts, MRV-ability, emission factors, Wetlands Inter-national, Wageningen, the Netherlands, 14 pp., 2009.
Couwenberg, J., Augustin, J., Michaelis, D., Wichtmann, W., and Joosten, H.: Entwicklung von Grundsätzen für eine Bewertung von Niedermooren hinsichtlich ihrer Klimarelevanz, DUENE e.V., Greifswald, 33 pp., 2008 (in German).
Couwenberg, J., Thiele, A., Tanneberger, F., Augustin, J., Bärisch, S., Dubovik, D., Liashchynskaya, N., Michaelis, D., Minke, M., Skuratovich, A., and Joosten, H.: Assessing greenhouse gas emissions from peatlands using vegetation as a proxy, Hydrobi-ologia, 674, 67–89, doi:10.1007/s10750-011-0729-x, 2011. D’Astous, A., Poulin, M., Aubin, I., and Rochefort, L.:
Using functional diversity as an indicator of restora-tion success of a cut-over bog, Ecol. Eng., 61, 519–526, doi:10.1016/j.ecoleng.2012.09.002, 2013.
Drösler, M., Freibauer, F., Christensen, T., and Friborg, T.: Obser-vations and Status of Peatland Greenhouse Gas Emissions in Europe, The Continental-Scale Greenhouse Gas Balance of Eu-rope, in: Ecological Studies, edited by: Dolman, R. V. H. and Freibauer, A., Springer Science & Business Media, New York, 243–261, 2008.
Drösler, M., Adelmann, W., Augustin, J., Bergmann, L., Beyer, M., Gibels, M., Förster, C., Freibauer, A., Höper, H., Petschow, U., Hahn-Schöfl, M., Kantelhardt, J., Liebersbach, H., Schägner, J.-P., Schaller, L., Sommer, M., Thuille, A., and Wehrhahn, M.: Kli-maschutz durch Moorschutz, in: KliKli-maschutz und Anpassung an die Klimafolgen, edited by: Mahammadzadeh, M., Biebeler, H., and Hubertus B., Institut der deutschen Wirschaft Köln Medien GmbH, Köln, 89–97, 2009 (in German).
Elsgaard, L., Görres, C.-M., Hoffmann, C. C., Blicher-Mathiesen, G., Schelde, K., and Petersen, S. O.: Net ecosystem exchange of CO2and carbon balance for eight temperate organic soils un-der agricultural management, Agr. Ecosyst. Environ., 162, 52– 67, doi:10.1016/j.agee.2012.09.001, 2012.
Erwin, K.: Wetlands and global climate change: the role of wetland restoration in a changing world, Wetl. Ecol. Manag., 17, 71–84, 2009.
Forbrich, I., Kutzbach, L., Hormann, A., and Wilmking, M.: A com-parison of linear and exponential regression for estimating dif-fusive CH4 fluxes by closed-chambers in peatlands, Soil Biol. Biochem., 42, 507–515, 2010.
Freibauer, A., Drösler, M., Gensior, A., and Schulze, E.-D.: Das Potenzial von Wäldern und Mooren für den Klimaschutz in Deutschland und auf globaler Ebene, Natur und Landschaft, 84, 20–25, 2009 (in German).
Görres, C. M., Kutzbach, L., and Elsgaard, L.: Comparative mod-eling of annual CO2 flux of temperate peat soils under perma-nent grassland management, Agr. Ecosyst. Environ., 186, 64–76, doi:10.1016/j.agee.2014.01.014, 2014.
Grand-Clement, E., Anderson, K., Smith, D., Luscombe, D., Gatis, N., Ross, M., and Brazier, R. E.: Evaluating ecosystem goods and services after restoration of marginal upland peatlands in South-West England, J. App. Ecol., 50, 324–334, doi:10.1111/1365-2664.12039, 2013.
Green, S. and Baird, A.: A mesocosm study of the role of the sedge Eriophorum angustifolium in the efflux of methane including that due to episodic ebullition from peatlands, Plant Soil, 351, 207– 218, doi:10.1007/s11104-011-0945-1, 2012.
Grube, A., Fuest, T., and Menzel, P.: Geology of the Himmelmoor (bog) near Quickborn (Schleswig-Holstein) – Zur Geologie des Himmelmoores bei Quickborn (Schleswig-Holstein), Telma, 40, 19–32, 2010.
Hahn-Schöfl, M., Zak, D., Minke, M., Gelbrecht, J., Augustin, J., and Freibauer, A.: Organic sediment formed during inunda-tion of a degraded fen grassland emits large fluxes of CH4and CO2, Biogeosciences, 8, 1539–1550, doi:10.5194/bg-8-1539-2011, 2011.
IPCC: Climate Change 2013: The Physical Science Basis, Contri-bution of Working Group I to the Fifth Assessment Report of the Intergovernmental Panel on Climate Change, edited by: Stocker, T. F., Qin, D., Plattner, G.-K., Tignor, M., Allen, S. K., Boschung, J., Nauels, A., Xia, Y., Bex, V., and Midgley, P. M., Cambridge University Press, Cambridge, United Kingdom and New York, USA, 1535 pp., 2013.
IUSS: World Reference Base for Soil Resources 2006, World Soil Resources Reports No. 103, FAO, Rome, 128 pp., 2006. Jacquemart, A.-L., Champluvier, D., and De Sloover, J.: A test
of mowing and soil-removal restoration techniques in wet heaths of the High Ardenne, Belgium, Wetlands, 23, 376–385, doi:10.1672/0277-5212(2003)023[0376:atomas]2.0.co;2, 2003. Jaiswal, V. S.; Rai, A. K.; Jaiswal, U., and Singh, J. S. (Eds.): The
changing scenario in plant sciences, Allied Publishers Ltd., New Dehli, 2000.
Jefferies, T. A.: Ecology of the Purple Heath Grass (Molinia Caerulea), J. Ecol., 3, 93–109, doi:10.2307/2962376, 1915. Joabsson, A., Christensen, T. R., and Wallén, B.: Vascular plant
con-trols on methane emissions from northern peatforming wetlands, Trends Ecol. Evol., 14, 385–388, 1999.
Jonasson, S.: Evaluation of the Point Intercept Method for the Estimation of Plant Biomass, Oikos, 52, 101–106, doi:10.2307/3565988, 1988.
Joosten, H.: Moorschutz in Europa, Restauration und Klimarele-vanz, in: Moore in der Regionalentwicklung, BUND Landesver-band Niedersachsen, Wagenfeld/Ströhen, 35–43, 2006 (in Ger-man).
Joosten, H. and Clarke, D.: Wise Use of Mires and Peatlands, In-ternational Mire Conservation Group and InIn-ternational Peat So-ciety, Saarijärvi, Finland, 304 pp., 2002.
Joosten, H., Tapio-Biström, M.-L., and Tol, S.: Peatlands-Guidance For Climate Change Mitigation Through Conservation, Rehabil-itation and Sustainable Use, Mitigation of Climate Change in Agriculture, Volume 5, FAO and Wetlands International, Rome, Italy, 2012.
Keddy, P. A.: Wetland ecology: principles and conservation, Cam-bridge University Press, New York, 516 pp., 2010.
Komulainen, V.-M., Nykänen, H., Martikainen, P. J., and Laine, J.: Short-term effect of restoration on vegetation change and methane emissions from peatlands drained for forestry in south-ern Finland, Can. J. Forest Res., 28, 402–411, doi:10.1139/x98-011, 1998.
Koster, E. A. and Favier, T.: Peatlands past and present, in: The physical geography of Western Europe, edited by: Koster, E. A., Oxford University Press, Oxford New York, 161–182, 2005. Kutzbach, L., Wagner, D., and Pfeiffer, E. M.: Effect of microrelief
and vegetation on methane emission from wet polygonal tundra, Lena Delta, Northern Siberia, Biogeochemistry, 69, 341–362, 2004.
Kutzbach, L., Schneider, J., Sachs, T., Giebels, M., Nykänen, H., Shurpali, N. J., Martikainen, P. J., Alm, J., and Wilmk-ing, M.: CO2 flux determination by closed-chamber methods can be seriously biased by inappropriate application of lin-ear regression, Biogeosciences, 4, 1005–1025, doi:10.5194/bg-4-1005-2007, 2007.
Lai, D. Y. F.: Methane Dynamics in Northern Peatlands: A Review, Pedosphere, 19, 409–421, doi:10.1016/S1002-0160(09)00003-4, 2009.
Londo, G.: The decimal scale for releves of permanent quadrats, Vegetatio, 33, 61–64, doi:10.1007/bf00055300, 1976.
Meuser, H.: Soil Remediation and Rehabilitation: Treatment of Contaminated and Disturbed Land, Springer, Dordrecht, 408 pp., 2012.
Morison, J. I. L.: Afforested peatland restoration, ClimateXchange, Centre of Expertise on Climate Change, Edinburgh, Scotland, 12 pp., 2012.
Parish, F., A., S., Charman, D., Joosten, H., Minayeva, T., Silvius, M. and Stringer, L. (Eds.): Assessment on peatlands, biodiversity and climate change: main report, Global Environment Centre and Wetlands International, Kuala Lumpur, 179 pp., 2008.
Paul, S. and Alewell, C.: Moorregeneration als Klimaschutzmass-nahme: eine Recherche zur neuen Kyoto-Aktivität Wetland Drainage and Rewetting, Bundesamt für Umwelt (BAFU), Abt. Klima. Bern, Schweiz, 45 pp., 2013 (in German).
Pfeiffer, E. M.: Methanfreisetzung aus hydromorphen Böden ver-schiedener naturnaher und genutzter Feuchtgebiete (Marsch, Moor, Tundra, Reisanbau), Hamburger Bodenkundliche Ar-beiten, Hamburg, Germany, 208 pp., 1998 (in German). Pihlatie, M. K., Christiansen, J. R., Aaltonen, H., Korhonen, J. F.
J., Nordbo, A., Rasilo, T., Benanti, G., Giebels, M., Helmy, M., Sheehy, J., Jones, S., Juszczak, R., Klefoth, R., Lobo-do-Vale, R., Rosa, A. P., Schreiber, P., Serca, D., Vicca, S., Wolf, B., and Pumpanen, J.: Comparison of static chambers to measure CH4 emissions from soils, Agr. Forest Meteorol., 171–172, 124–136, doi:10.1016/j.agrformet.2012.11.008, 2013.
Poschlod, P.: Vegetation development of former peat mining areas in the high moors of the bavarian alpine foothills West Germany, Tuexenia, 8, 31–54, 1988.
Quinty, F. and Rochefort, L.: Peatland Restoration Guide, sec-ond edition, Canadian Sphagnum Peat Moss Association and New Brunswick Department of Natural Resources and Energy, Québec, 106 pp., 2003.
Reid, N., McEvoy, P. M., and Preston, J. S.: Efficacy of sod re-moval in regenerating fen vegetation for the conservation of the marsh fritillary butterflyEuphydryas aurinia, Montiaghs Moss Nature Reserve, County Antrim, Northern Ireland, Conservation Evidence, 6, 31–38, 2009.
Richards, F. J.: A Flexible Growth Function for Empirical Use, J. Exp. Bot., 10, 290–301, doi:10.1093/jxb/10.2.290, 1959. Rodeghiero, M. and Cescatti, A.: Main determinants of forest soil
respiration along an elevation/temperature gradient in the Italian Alps, Glob. Change Biol., 11, 1024–1041, doi:10.1111/j.1365-2486.2005.00963.x, 2005.
Saarnio, S., Alm, J., Silvola, J., Lohila, A., Nykanen, H., and Mar-tikainen, P. J.: Seasonal variation in CH4 emissions and produc-tion and oxidaproduc-tion potentials at microsites on an oligotrophic pine fen, Oecologia, 110, 414–422, 1997.
Samaritani, E., Siegenthaler, A., Yli-Petäys, M., Buttler, A., Christin, P.-A., and Mitchell, E. A. D.: Seasonal Net Ecosystem Carbon Exchange of a Regenerating Cutaway Bog: How Long Does it Take to Restore the C-Sequestration Function?, Restor. Ecol., 19, 480–489, doi:10.1111/j.1526-100X.2010.00662.x, 2010.
Schäfer, C.-M.: Net ecosystem exchange of carbon dioxide and mi-crobial methane dynamics in temperate grasslands on peat, PhD thesis, Department of Agroecology, University of Aarhus, Den-mark, 168 pp., 2012.
Schneider, J., Kutzbach, L., Schulz, S., and Wilmking, M.: Overesti-mation of CO2respiration fluxes by the closed chamber method in low-turbulence nighttime conditions, J. Geophys. Res., 114, G03005, doi:10.1029/2008jg000909, 2009.
Schneider, J., Kutzbach, L., and Wilmking, M.: Carbon dioxide exchange fluxes of a boreal peatland over a complete grow-ing season, Komi Republic, NW Russia, Biogeochemistry, 1–29, doi:10.1007/s10533-011-9684-x, 2011.
Schouwenaars, J. M.: Hydrological differences between bogs and bog-relicts and consequences for bog restoration, Hydrobiologia, 265, 217–224, 1993.
Trepel, M.: Zur Bedeutung von Mooren in der Klimadebatte, in: Jahresbericht 2007/2008, Landesamt für Natur und Umwelt des Landes Schleswig-Holstein, Flintbek, 61–74, 2008 (in German). Triisberg, T., Karofeld, E., and Paal, J.: Re-vegetation of block-cut and milled peatlands: an Estonian example, Mires and Peat, 8, 1–14, 2011.
Tuittila, E. S., Komulainen, V. M., Vasander, H., and Laine, J.: Re-stored cut-away peatland as a sink for atmospheric CO2, Oecolo-gia, 120, 563–574, 1999.
Tuittila, E.-S., Komulainen, V.-M., Vasander, H., Nykänen, H., Mar-tikainen, P. J., and Laine, J.: Methane dynamics of a restored cut-away peatland, Glob. Change Biol., 6, 569–581, 10.1046/j.1365-2486.2000.00341.x, 2000.
van Breemen, N.: Plant-induced soil changes: processes and feed-backs, the Netherlands, Kluver Academic Publishers, 264 pp., 1998.
Waddington, J. M. and Day, S. M.: Methane emissions from a peatland following restoration, J. Geophys Res., 112, G03018, doi:10.1029/2007jg000400, 2007.
Wilson, D., Alm, J., Laine, J., Byrne, K. A., Farrell, E. P., and Tuit-tila, E. S.: Rewetting of Cutaway Peatlands: Are We Re-Creating Hot Spots of Methane Emissions?, Restor. Ecol., 17, 796–806, doi:10.1111/j.1526-100X.2008.00416.x, 2009.