Submitted 30 October 2015 Accepted 19 November 2015 Published8 December 2015 Corresponding author Patrick D. Schloss, [email protected]
Academic editor A. Murat Eren
Additional Information and Declarations can be found on page 19
DOI10.7717/peerj.1487
Copyright
2015 Westcott and Schloss
Distributed under
Creative Commons CC-BY 4.0 OPEN ACCESS
De novo clustering methods outperform
reference-based methods for assigning
16S rRNA gene sequences to operational
taxonomic units
Sarah L. Westcott and Patrick D. Schloss
Department of Microbiology and Immunology, University of Michigan—Ann Arbor, Ann Arbor, MI, United States
ABSTRACT
Background.16S rRNA gene sequences are routinely assigned to operational taxonomic units (OTUs) that are then used to analyze complex microbial
communities. A number of methods have been employed to carry out the assignment of 16S rRNA gene sequences to OTUs leading to confusion over which method is optimal. A recent study suggested that a clustering method should be selected based on its ability to generate stable OTU assignments that do not change as additional sequences are added to the dataset. In contrast, we contend that the quality of the OTU assignments, the ability of the method to properly represent the distances between the sequences, is more important.
Methods.Our analysis implemented sixde novoclustering algorithms including the single linkage, complete linkage, average linkage, abundance-based greedy clustering, distance-based greedy clustering, and Swarm and the open and closed-reference methods. Using two previously published datasets we used the Matthew’s Correlation Coefficient (MCC) to assess the stability and quality of OTU assignments.
Results. The stability of OTU assignments did not reflect the quality of the assignments. Depending on the dataset being analyzed, the average linkage and the distance and abundance-based greedy clustering methods generated OTUs that were more likely to represent the actual distances between sequences than the open and closed-reference methods. We also demonstrated that for the greedy algorithms VSEARCH produced assignments that were comparable to those produced by USEARCH making VSEARCH a viable free and open source alternative to USEARCH. Further interrogation of the reference-based methods indicated that when USEARCH or VSEARCH were used to identify the closest reference, the OTU assignments were sensitive to the order of the reference sequences because the reference sequences can be identical over the region being considered. More troubling was the observation that while both USEARCH and VSEARCH have a high level of sensitivity to detect reference sequences, the specificity of those matches was poor relative to the true best match.
assignments needs to be assessed for multiple methods to identify the optimal clustering method for a particular dataset.
Subjects Computational Biology, Ecology, Microbiology
Keywords 16S rRNA gene sequences, OTU, Next generation sequencing, Bioinformatics, Microbial ecology, Microbiome, Culture-independent, mothur, QIIME
INTRODUCTION
The ability to affordably generate millions of 16S rRNA gene sequences has allowed microbial ecologists to thoroughly characterize the microbial community composition of hundreds of samples. To simplify the complexity of these large datasets, it is helpful to cluster sequences into meaningful bins. These bins, commonly known as operational tax-onomic units (OTUs), are used to compare the biodiversity contained within and between different samples (Schloss & Westcott, 2011). Such comparisons have enabled researchers to characterize the microbiota associated with the human body (e.g.,Huttenhower et al., 2012), soil (e.g.,Shade et al., 2013), aquatic ecosystems (e.g.,Gilbert et al., 2011), and numerous other environments. Within the field of microbial ecology, a convention has emerged where sequences are clustered into OTUs using a threshold of 97% similarity or a distance of 3%. One advantage of the OTU-based approach is that the definition of the bins is operational and can be changed to suit the needs of the particular project. However, with the dissemination of clustering methods within software such as mothur (Schloss et al., 2009), QIIME (Caporaso et al., 2010), and other tools (Sun et al., 2009;Edgar, 2010;Edgar, 2013;Cai & Sun, 2011;Mah´e et al., 2014), it is important to understand how different clustering methods implement this conventional OTU threshold. Furthermore, it is necessary to understand how the selected method affects the precision and accuracy of assigning sequences to OTUs. Broadly speaking, three approaches have been developed to assign sequences to OTUs.
alternative to this approach is to use a classifier to assign a taxonomy to each sequence so that sequences can be clustered at a desired level within the Linnean taxonomic hierarchy (Schloss & Westcott, 2011). The strengths of the reference-based methods include their speed, potential for trivial parallelization, ability to compare OTU assignments across studies, and the hope that as databases improve, the OTU assignments will also improve.
The second approach has been referred to as distance-based (Schloss & Westcott, 2011) orde novoclustering (Navas-Molina et al., 2013). In this approach, the distance between sequences is used to cluster sequences into OTUs rather than the distance to a reference database. In contrast to the efficiency of closed-reference clustering, the computational cost of hierarchicalde novoclustering methods scales quadratically with the number of unique sequences. The expansion in sequencing throughput combined with sequencing errors inflates the number of unique sequences resulting in the need for large amounts of memory and time to cluster the sequences. If error rates can be reduced through stringent quality control measures, then these problems can be overcome (Kozich et al., 2013). As an alternative, heuristics have been developed to approximate the clustering of hierarchical methods (Sun et al., 2009;Edgar, 2010;Mah´e et al., 2014). Two related heuristics implemented in USEARCH were recently described: distance-based greedy clustering (DGC) and abundance-based greedy clustering (AGC) (Edgar, 2010;He et al., 2015). These greedy methods cluster sequences within a defined similarity threshold of an index sequence or create a new index sequence. If a sequence is more similar than the defined threshold, it is assigned to the closest centroid based (i.e., DGC) or the most abundant centroid (i.e., AGC). One critique ofde novoapproaches is that OTU assignments are sensitive to the input order of the sequences (Mah´e et al., 2014;He et al., 2015). Whether the differences in assignments is meaningful is unclear and the variation in results could represent equally valid clustering of the data. The strength of de novoclustering is its independence of references for carrying out the clustering step. For this reason,de novoclustering has been preferred across the field. After clustering, the classification of each sequence can be used to obtain a consensus classification for the OTU (Schloss & Westcott, 2011).
of this approach is that it lends itself nicely to parallelization since each taxonomic group is seen as being independent and can be processed separately. Such an approach would overcome the difficulty of mixing OTU definitions between the closed-reference andde novoapproaches; however, it would still suffer from the problems associated with database quality and classification error.
The growth in options for assigning sequences using each of these three broad approaches has been considerable. It has been difficult to objectively assess the quality of OTU assignments. Some have focused on the time and memory required to process a dataset (Sun et al., 2009;Cai & Sun, 2011;Mah´e et al., 2014;Rideout et al., 2014). These are valid parameters to assess when judging a clustering method, but have little to say about the quality of the OTU assignments. Others have attempted to judge the quality of a method by its ability to generate data that parallels classification data (White et al., 2010;Sun et al., 2011;Cai & Sun, 2011). This approach is problematic because bacterial taxonomy often reflects historical biases amongst bacterial systematicists. Furthermore, it is well known that the rates of evolution across lineages are not the same (Wang et al., 2007;Schloss, 2010). A related approach has used clustering of mock community data to evaluate methods (Huse et al., 2010;Barriuso, Valverde & Mellado, 2011;Bonder et al., 2012;Chen et al., 2013;
Edgar, 2013;Mah´e et al., 2014;May et al., 2014). Yet these approaches ignore the effects of sequencing errors that tend to accumulate with sequencing depth and represent highly idealized communities that lack the phylogenetic diversity of real microbial communities (Schloss, Gevers & Westcott, 2011;Kozich et al., 2013). Others have assessed the quality of clustering based on their ability to generate the same OTUs generated by other methods (Rideout et al., 2014;Schmidt, Rodrigues & Mering, 2014b). This is problematic because it does not solve the fundamental question of which method is optimal. The concept of ecological consistency as a metric of quality asserts that sequences that cluster into the same OTU should share similar ecological affiliations (Koeppel & Wu, 2013;Preheim et al., 2013;Schmidt, Rodrigues & Mering, 2014a). Although this is an intriguing approach and is a quantitative metric, it is unclear how the metric would be objectively validated. We recently proposed an approach for evaluating OTU assignments using the distances between pairs of sequences (Schloss & Westcott, 2011). We were able to synthesize the relationship between OTU assignments and the distances between sequences using the Matthew’s correlation coefficient (MCC;Matthews, 1975). MCC can be interpreted as representing the correlation between the observed and expected classifications and can vary between−1.0 and 1.0. The strength of the MCC, as implemented bySchloss & Westcott (2011), is that it is an objective approach to assessing the quality of the OTU assignments that can be calculated for any set of OTU assignments where there is a distance matrix and a specific threshold without relying on an external reference.
of poor quality. In the current analysis, we assessed the quality and stability of the various clustering methods. Building on our previous analysis of clustering methods, our hypothe-sis was that the methods praised by the He study for their stability actually suffered a lack of quality. In addition, we assess these parameters in light of sequence quality using the origi-nal 454 dataset and a larger and more modern dataset generated using the MiSeq platform.
METHODS
454 FLX-generated Roesch Canadian soil dataset
After obtaining the 16S rRNA gene fragments from GenBank (accessions
EF308591–EF361836), we followed the methods outlined by the He study by removing any sequence that contained an ambiguous base, was identified as being a chimera, and fell outside a defined sequence length. Although they reported observing a total of 50,542 sequences that were represented by 13,293 unique sequences, we obtained a total of 50,946 sequences that were represented by 13,393 unique sequences. Similar to the He study, we randomly sampled, without replacement, 20, 40, 60, and 80% of the sequences from the full data set. The random sampling was repeated 30 times. The order of the sequences in the full dataset was randomly permuted without replacement to generate an additional 30 datasets. To perform the hierarchical clustering methods and to generate a distance matrix we followed the approach of the He study by calculating distances based on pairwise global alignments using thepairwise.distcommand in mothur using the default Needleman-Wunsch alignment method and parameters. It should be noted that this approach has been strongly discouraged (Schloss, 2012). Execution of the hierarchical clustering methods was performed as described in the original He study using mothur (v.1.37) and using the QIIME (v.1.9.1) parameter profiles provided in the supplementary material from the He study for the greedy and reference-based clustering methods.
MiSeq-generated Murine gut microbiota dataset
Analysis of reference database
We utilized the 97% OTUs greengenes reference sequence and taxonomy data (v.13.8) that accompanies the QIIME installation. Because the greengenes reference alignment does a poor job of representing the secondary structure of the 16S rRNA gene (Schloss, 2010), we realigned the FASTA sequences to a SILVA reference alignment to identify the V4 region of the sequences.
Calculation of Matthew’s Correlation Coefficient (MCC)
The MCC was calculated by two approaches in this study using only the dereplicated sequence lists. First, we calculated the MCC to determine the stability of OTU assignments following the approach of the He study. We assumed that the clusters obtained from the 30 randomized full datasets were correct. We counted the number of sequence pairs that were in the same OTU for the subsetted dataset and the full dataset (i.e., true positives; TP), that were in different OTUs for the subsetted dataset and the full dataset (i.e., true negatives; TN), that were in the same OTU for the subsetted dataset and different OTUs in the full dataset (i.e., false positives; FP), and that were in different OTUs for the subsetted dataset and the same OTU in the full dataset (i.e., false negatives; FN). For each set of 30 random subsamplings of the dataset, we counted these parameters against the 30 randomizations of the full dataset. This gave 900 comparisons for each fraction of sequences being used in the analysis. The Matthew’s correlation coefficient was then calculated as:
MCC=√ TP×TN−FP×FN
(TP+FP)(TP+FN)(TN+FP)(TN+FN).
Second, we calculated the MCC to determine the quality of the clusterings as previously described (Schloss & Westcott, 2011). Briefly, we compared the OTU assignments for pairs of sequences to the distance matrix that was calculated between all pairs of aligned sequences. For each dataset that was clustered, those pairs of sequences that were in the same OTU and had a distance less than 3% were TPs, those that were in different OTUs and had a distance greater than 3% were TNs, those that were in the same OTU and had a distance greater than 3% were FPs, and those that were in different OTUs and had a distance less than 3% were FNs. The MCC was counted for each dataset using the formula above as implemented in thesens.speccommand in mothur. To judge the quality of the Swarm-generated OTU assignments we calculated the MCC value using thresholds incremented by 1% between 0 and 5% and selected the threshold that provided the optimal MCC value.
Software availability
A reproducible workflow including all scripts and this manuscript as a literate program-ming document are available athttps://github.com/SchlossLab/Schloss Cluster PeerJ 2015. The workflow utilized QIIME (v.1.9.1;Caporaso et al., 2010), mothur (v.1.37.0;
neighbor (FN) in mothur; we have used the terminology from the He study to minimize confusion. The knitr (v.1.10.5;Xie, 2013), Rcpp (v. 0.11.6;Eddelbuettel, 2013), rentrez (v. 1.0.0;Winter, Chamberlain & Guangchun, 2015), and jsonlite (v. 0.9.16;Ooms, 2014) packages were used within R.
RESULTS AND DISCUSSION
Summary and replication of He study
We obtained the Canadian soil dataset fromRoesch et al. (2007)and processed the sequences as described by He and colleagues. Using these data, we reconsidered three of the more critical analyses performed in the He study.
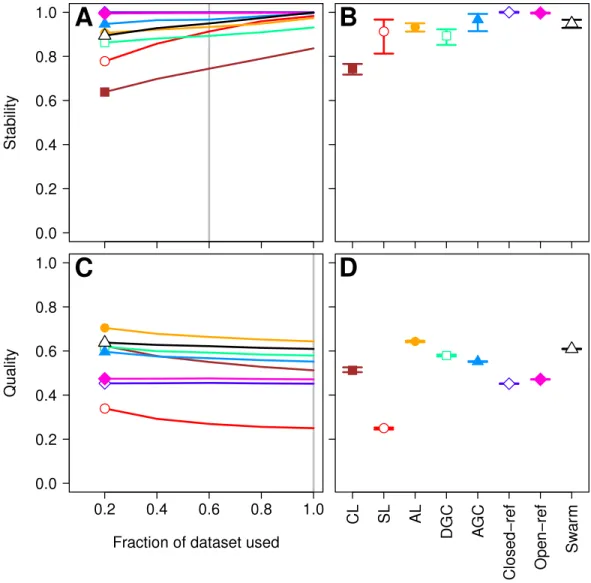
Figure 1 Comparison of the stability (A, B) and quality (C, D) ofde novo and reference-based
clustering methods using the Canadian soil dataset.The average stability of the OTUs was determined by calculating the MCC with respect to the OTU assignments for the full dataset using varying sized subsamples. The quality of the OTUs was determined by calculating the MCC with respect to the distances between the sequences using varying sized subsamples. Thirty randomizations were performed for each fraction of the dataset and the average and 95% confidence interval are presented when using 60% of the data. The vertical gray lines in A and C indicates the fraction of the dataset represented in B and D, respectively. The color and shape of the plotting symbol is the same between the different panels and is described along thex-axis of panel D. The optimum threshold for the Swarm-generated assignments was 3%.
Figure 2 The clustering methods varied in their ability to generate the same number of OTUs using a subset of the data as were observed when the full dataset was rarefied.The subsetted data are depicted by closed circles and the data from the rarefied full dataset is depicted by the open circles.
other methods produced similar numbers of OTUs than expected when comparing the subsetted data to the rarefied data. Our results support those of these previous studies (Fig. 2). It was clear that inter-method differences were generally more pronounced than the differences observed between rarefying from the full dataset and from clustering the subsetted data. The number of OTUs observed was largest using the CL method, followed by the open-reference method. The AL, AGC, and DGC methods all provided comparable numbers of OTUs. Finally, the closed-reference and SL methods generated the fewest OTUs.
communities based on their unstable OTUs would yield differences. Furthermore, thede novoand open-reference approaches do not consistently label the OTUs that sequences belong to when the clustering methods are run multiple times with different random number seeds. To overcome this, the authors selected representative sequences from each OTU and used those representative sequences to link OTU assignments between the different sized sequence sets. It was not surprising that the only analysis that did not provide a significantp-value was for the closed-reference analysis, which is the only analysis that provides consistent OTU labels. Finally, the authors built offof this analysis to count the number of OTUs that were differentially represented between the subsetted and full datasets by each method. This entire analysis assumed that the OTUs generated using the full dataset were correct, which was an unsubstantiated assumption since the authors did not assess the quality of the OTU assignments.
This re-analysis of the He study raised five complementary questions. First, how do the various methods vary in the quality of their OTU assignments? Second, how generalizable are these results to modern datasets generated using a large number of sequences that were deeply sequenced? Third, how does the stability and quality of OTU assignments generated by new methods compare to those analyzed in the He study? Fourth, are there open-source alternatives to USEARCH that perform just as well? Finally, although the stability of reference-based methods did not appear to be impacted by the input order of the sequences to be assigned to OTUs, is the stability of reference-based methods impacted by the order of the reference sequences? In the remainder of the ‘Results and Discussion’ we address each of these questions.
How do the various methods vary in the quality of their OTU assignments?
amount of variation between runs of the method with a different ordering of the input sequences. This indicates that although there may be variation between executions of the same method, they produced OTU assignments that were of equal quality. Revisiting the concept of stability, we question the value of obtaining stable OTUs when the full dataset is not optimally assigned to OTUs. Our analysis indicates that the most optimal method for assigning the Canadian soils sequences to OTUs using a 97% threshold was the AL method.
How generalizable are these results to modern datasets generated using a large number of sequences that were deeply sequenced? Three factors make the Canadian soil dataset less than desirable to evaluate clustering methods. First, it was one of the earliest 16S rRNA gene sequence datasets published using the 454 FLX platform. Developments in sequencing technology now permit the sequencing of millions of sequences for a study. In addition, because the original Phred quality scores and flowgram data are not available, it was not possible for us to adequately remove sequencing errors (Schloss, Gevers & Westcott, 2011). The large number of sequencing errors that one would expect to remain in the dataset are likely to negatively affect the performance of all of the clustering methods. Second, the dataset used in the He study covered the V9 region of the 16S rRNA gene. For a variety of reasons, this region is not well represented in databases, including the reference database used by the closed and open-reference methods. Of the 99,322 sequences in the default QIIME database, only 48,824 fully cover the V9 region. In contrast, 99,310 of the sequences fully covered the V4 region. Inadequate coverage of the V9 region would adversely affect the ability of the reference-based methods to assign sequences to OTUs. Third, our previous analysis has shown that the V9 region evolves at a rate much slower than the rest of the gene (Schloss, 2010). With these points in mind, we compared the clustering assignment for each of these methods using a time series experiment that was obtained using mouse feces (Schloss et al., 2012;Kozich et al., 2013). The MiSeq platform was used to generate 2,825,000 sequences from the V4 region of the 16S rRNA gene of 360 samples. Parallel sequencing of a mock community indicated that the sequencing error rate was approximately 0.02% (Kozich et al., 2013). Although no dataset is perfect for exhaustively testing these clustering methods, this dataset was useful for demonstrating several points. First, when using 60% of the data, the stability relationships amongst the different methods were similar to what we observed using the Canadian soil dataset (Figs. 3Aand3B). With the exception of the clusters generated using CL, the methods all performed very well with stabilities greater than 0.91. Second, the MCC values calculated relative to the distances between sequences were generally higher than was observed for the Canadian soil dataset for all of the methods except the CL and SL methods. Surprisingly, the MCC values for the DGC (0.77) and AGC (0.76) methods were comparable to the AL method (0.76;Figs. 3Cand3D). This result suggests that the optimal method is likely to be database-dependent.
Figure 3 Comparison of the stability (A, B) and quality (C, D) ofde novo and reference-based
clustering methods using the murine dataset.The average stability of the OTUs was determined by calculating the MCC with respect to the OTU assignments for the full dataset using varying sized subsamples. The quality of the OTUs was determined by calculating the MCC with respect to the distances between the sequences using varying sized subsamples. Thirty randomizations were performed for each fraction of the dataset and the average and 95% confidence interval are presented when using 60% of the data. The vertical gray lines in A and C indicates the fraction of the dataset represented in B and D, respectively. The color and shape of the plotting symbol is the same between the different panels and is described along thex-axis of panel D. The optimum threshold for the Swarm-generated assignments was 2%.
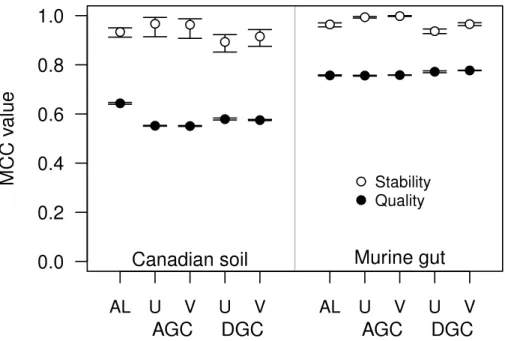
Figure 4 The stability and quality of USEARCH and VSEARCH OTUs generated by the AGC and DGC methods were similar.The stability of the OTUs was determined by calculating the MCC for OTUs calculated using 60% of the data relative to the OTU assignments for the full dataset. The quality of the OTUs was determined by calculating the MCC of the OTUs calculated using the full dataset with respect to the distances between the sequences. The error bars represent the 95% confidence interval across the 30 randomizations.
How does the stability and quality of OTU assignments generated by new methods compare to those analyzed in the He study?
mouse dataset and even larger datasets suggests that it is not necessary to sacrifice OTU assignment quality for speed (e.g.,Schubert, Sinani & Schloss, 2015;Zackular et al., 2015).
Are there open-source alternatives to USEARCH that perform just as well?
For some datasets the AGC and DGC methods appear to perform as well or better than the hierarchical clustering methods. As originally described in the He study, the AGC and DGC methods utilized the USEARCH program and the DGC method is used for clustering in UPARSE (Edgar, 2010;Edgar, 2013). The source code for USEARCH is not publicly available and only the 32-bit executables are available for free to academic users. Access for non-academic users and those needing the 64-bit version is available commercially from the developer. An alternative to USEARCH is VSEARCH, which is being developed in parallel to USEARCH as an open-source alternative. One subtle difference between the two programs is that USEARCH employs a heuristic to generate candidate alignments whereas VSEARCH generates the actual global alignments. The VSEARCH developers claim that this difference enhances the sensitivity of VSEARCH relative to USEARCH. Using the two datasets, we determined whether the AGC and DGC methods, as implemented by the two programs, yielded OTU assignments of similar quality. In general the overall trends that we observed with the USEARCH-version of AGC and DGC were also observed with the VSEARCH-version of the methods (Fig. 4). When we compared the two implementations of the AGC and DGC methods, the OTUs generated by the VSEARCH-version of the methods were as stable or more stable than the USEARCH-version when using 60% of the datasets. In addition, the MCC values for the entire datasets, calculated relative to the distance matrix, were virtually indistinguishable. These results are a strong indication that VSEARCH is a suitable and possibly better option for executing the AGC and DGC methods.
Is the stability of reference-based methods impacted by the order of the reference sequences?
Figure 5 The number of closed-reference OTUs observed in the murine dataset when using USEARCH, VSEARCH, and without a heuristic.In addition to the default ordering of the references provided with the QIIME package, the reference sequences were randomized 30 times; the order of the murine dataset was not randomized. Regardless of whether the default or randomized ordering was used, the number of OTUs generated using VSEARCH did not differ. The non-heuristic approach calculated the exact distance between the murine sequences and the reference sequences and assigned the sequences to the reference with the smallest distance.
although heuristic approaches may be fast, they do a poor job of mapping reads to the correct reference sequence relative to non-heuristic approaches.
We also observed that regardless of whether we used USEARCH or VSEARCH, the reference OTU labels that were assigned to each OTU differed between randomizations. When we used USEARCH to perform closed-reference clustering, an average of 57.38% of the labels were shared between pairs of the 30 randomizations (range=56.14–59.55%). If we instead used VSEARCH an average of 56.23% of the labels were shared between pairs of the 30 randomizations (range=53.48–59.12%). To better understand this result, we further analyzed QIIME’s reference database. We hypothesized that within a given region there would be sequences that were more than 97% similar and possibly identical to each other. When a sequence was used to search the randomized databases, it would encounter a different reference sequence as the first match with each randomization. Among the 99,310 reference sequences that fully overlap the V4 region, there were 7,785 pairs of sequences that were more than 97% similar to each other over the full length of the 16S rRNA gene. When the extracted V4 sequences were dereplicated, we identified 88,347 unique sequences. Among these dereplicated V4 sequences there were 311,430 pairs of sequences that were more than 97% similar to each other. The presence of duplicate and highly similar V4 reference sequences explains the lack of labeling stability when using either USEARCH or VSEARCH to carry out the closed-reference method. We suspect that the reference database was designed to only include sequences that were at most 97% similar to each other as a way to overcome the limitations of the USEARCH search heuristic.
reference sequences conflicted for 3,637 (19.86%). Together, these results demonstrate some of the considerable problems with the reference-based clustering of sequences.
CONCLUSIONS
It is worth noting that the analysis from the Roesch study that motivated the He study is not typical of microbial ecology studies. First, their analysis was based on a single soil sample. Researchers generally have dozens or hundreds of samples that are pooled and clustered together to enable comparison across samples. Second, all of the sequence data from these datasets is usually pooled for a single analysis. Rarely would a researcher rarefy their data prior to clustering since it can be more efficiently done after all of the data are assigned to OTUs. Third, the CL method used in the original Roesch study has since been shown to not generate optimal OTUs (Schloss & Westcott, 2011). As for the approach used in the He study, the value of identifying stable OTUs is unclear. Although there is concern that running the methods multiple times yields different clusterings, we have shown that there is little variation in their quality. This suggests that the different clusterings by the same method are equally good. Greater emphasis should be placed on obtaining an optimal balance between splitting similar sequences into separate OTUs and merging disparate sequences into the same OTU.
The approach of the current study quantified the effects of merging and splitting OTUs by using an objective metric. Through the use of the pairwise distances between sequences, we were able to use the MCC to demonstrate that, in general, the AL method was consistently the optimal method for each dataset, but that Swarm, AGC, and DGC sometimes perform as well as AL. At least for the murine dataset, Swarm also could be among the methods that performed poorly. It is impossible to obtain a clustering with no false positives or false negatives and the optimal method may vary by dataset. With this in mind, researchers are encouraged to calculate and report their MCC values and to use these values to justify using methods other than the AL. As an alternative to the He study’s method of measuring stability, we propose using the variation in the quality of the clustering of the full dataset. Given the tight 95% confidence intervals shown in Figs. 1Dand3D, with the exception of CL, it is clear that this variation is quite small. This indicates that although the order of the sequences being clustered can affect the actual cluster assignments, the quality of those different clusterings is not meaningfully different.
a sequence curation pipeline including denoising, alignment, trimming to a consistent region of the 16S rRNA gene, and chimera checking are critical to making proper inferences (Schloss, Gevers & Westcott, 2011;Schloss, 2012;Kozich et al., 2013).
We have assessed the ability of reference-based clustering methods to capture the actual distance between the sequences in a dataset in parallel withde novomethods. Several stud-ies have lauded both the open and closed-reference approaches for generating reproducible clusterings (Navas-Molina et al., 2013;Rideout et al., 2014;He et al., 2015), yet we have shown that both reference-based approaches did a poor job of representing the distance between the sequences compared to thede novoapproaches. Although the OTU assign-ments are reproducible and stable across a range of library sizes, the reference-based OTU assignments are a poor representation of the data. We also observed that the assignments were not actually reproducible when the order of the reference sequences was randomized. When USEARCH was used, the actual number of sequences that mapped to the reference changed depended on the order of the reference. Perhaps most alarming was that the default order of the database provided the worst MCC of any of the randomizations we attempted. This has the potential to introduce a systematic bias rather than a random error. Even when we used VSEARCH to perform closed-reference clustering and were able to obtain consistent clusterings, we observed that the labels on the OTUs differed between randomizations. Because the OTU labels are frequently used to identify representative sequences for those OTUs, variation in labels, often representing different taxonomic groups, will have a detrimental effect on the interpretation of downstream analyses.
Because the open-reference method is a hybrid of the closed-reference and DGC methods, it is also negatively affected by the various problems using USEARCH. An added problem with the open-reference method is that the two phases of the method employ different thresholds to define its OTUs. In the closed-reference step, sequences must be within a threshold of a reference to be in the same OTU. This means that in the worst case scenario two sequences that are 97% similar to a reference, and are joined into the same OTU, may only be 94% similar to each other. In the DGC step, the goal is to approximate the AL method which requires that, on average, the sequences within an OTU are, on average, 97% similar to each other. The end result of the open-reference approach is that sequences that are similar to previously observed sequences are clustered with one threshold while those that are not similar to previously observed sequences are clustered with a different threshold.
execute the method. The rapid expansion in sequencing throughput has been likened to the Red Queen in Lewis Carroll’sThrough the Looking-Glasswho must run in place to keep up with her changing surroundings (Schloss et al., 2009). Microbial ecologists must continue to refine clustering methods to better handle the size of their growing datasets, but they must also take steps to improve the quality of the underlying data. Ultimately, objective standards must be applied to assess the quality of the data and the quality of OTU clustering.
ADDITIONAL INFORMATION AND DECLARATIONS
Funding
This study was supported by grants from the NIH (R01GM099514 and P30DK034933). The funders had no role in study design, data collection and analysis, decision to publish, or preparation of the manuscript.
Grant Disclosures
The following grant information was disclosed by the authors: NIH: R01GM099514, P30DK034933.
Competing Interests
The authors declare there are no competing interests.
Author Contributions
• Sarah L. Westcott conceived and designed the experiments, performed the experiments, analyzed the data, contributed reagents/materials/analysis tools, reviewed drafts of the paper.
• Patrick D. Schloss conceived and designed the experiments, performed the experiments, analyzed the data, contributed reagents/materials/analysis tools, wrote the paper, prepared figures and/or tables, reviewed drafts of the paper.
Data Availability
The following information was supplied regarding data availability:
The complete data analysis pipeline is available athttps://github.com/SchlossLab/ Schloss Cluster PeerJ 2015.
REFERENCES
Anderson MJ. 2001.A new method for non-parametric multivariate analysis of variance.Austral Ecology26:32–46DOI 10.1111/j.1442-9993.2001.01070.pp.x.
Barriuso J, Valverde JR, Mellado RP. 2011.Estimation of bacterial diversity using next generation sequencing of 16S rDNA: a comparison of different workflows.BMC Bioinformatics
12:473DOI 10.1186/1471-2105-12-473.
Cai Y, Sun Y. 2011.ESPRIT-tree: hierarchical clustering analysis of millions of 16S rRNA pyrosequences in quasilinear computational time.Nucleic Acids Research39:e95–e95
DOI 10.1093/nar/gkr349.
Caporaso JG, Kuczynski J, Stombaugh J, Bittinger K, Bushman FD, Costello EK, Fierer N, Pe˜na AG, Goodrich JK, Gordon JI, Huttley GA, Kelley ST, Knights D, Koenig JE, Ley RE, Lozupone CA, McDonald D, Muegge BD, Pirrung M, Reeder J, Sevinsky JR, Turnbaugh PJ, Walters WA, Widmann J, Yatsunenko T, Zaneveld J, Knight R. 2010.QIIME allows analysis of high-throughput community sequencing data.Nature Methods7:335–336
DOI 10.1038/nmeth.f.303.
Chen W, Zhang CK, Cheng Y, Zhang S, Zhao H. 2013.A comparison of methods for clustering 16S rRNA sequences into OTUs.PLoS ONE8:e70837DOI 10.1371/journal.pone.0070837. Eddelbuettel D. 2013.Seamless R and C++ integration with Rcpp. New York: Springer.
Edgar RC. 2010.Search and clustering orders of magnitude faster than BLAST.Bioinformatics 26:2460–2461DOI 10.1093/bioinformatics/btq461.
Edgar RC. 2013.UPARSE: Highly accurate OTU sequences from microbial amplicon reads.Nature Methods10:996–998DOI 10.1038/nmeth.2604.
Edgar RC, Haas BJ, Clemente JC, Quince C, Knight R. 2011.UCHIME improves sensitivity and speed of chimera detection.Bioinformatics27:2194–2200DOI 10.1093/bioinformatics/btr381. Gilbert JA, Steele JA, Caporaso JG, Steinbr¨uck L, Reeder J, Temperton B, Huse S, McHardy AC,
Knight R, Joint I, Somerfield P, Fuhrman JA, Field D. 2011.Defining seasonal marine microbial community dynamics.The ISME Journal6:298–308DOI 10.1038/ismej.2011.107. Hamady M, Lozupone C, Knight R. 2009.Fast UniFrac: facilitating high-throughput phylogenetic
analyses of microbial communities including analysis of pyrosequencing and PhyloChip data. The ISME Journal4:17–27DOI 10.1038/ismej.2009.97.
He Y, Caporaso JG, Jiang X-T, Sheng H-F, Huse SM, Rideout JR, Edgar RC, Kopylova E, Walters WA, Knight R, Zhou H-W. 2015.Stability of operational taxonomic units: an important but neglected property for analyzing microbial diversity.Microbiome 3:20DOI 10.1186/s40168-015-0081-x.
Huse SM, Welch DM, Morrison HG, Sogin ML. 2010.Ironing out the wrinkles in the rare biosphere through improved OTU clustering.Environmental Microbiology12:1889–1898
DOI 10.1111/j.1462-2920.2010.02193.x.
Huttenhower C, Gevers D, Knight R, Abubucker S, Badger JH, Chinwalla AT, Creasy HH, Earl AM, FitzGerald MG, Fulton RS, Giglio MG, Hallsworth-Pepin K, Lobos EA, Madupu R, Magrini V, Martin JC, Mitreva M, Muzny DM, Sodergren EJ, Versalovic J, Wollam AM, Worley KC, Wortman JR, Young SK, Zeng Q, Aagaard KM, Abolude OO, Allen-Vercoe E, Alm EJ, Alvarado L, Andersen GL, Anderson S, Appelbaum E, Arachchi HM, Armitage G, Arze CA, Ayvaz T, Baker CC, Begg L, Belachew T, Bhonagiri V, Bihan M, Blaser MJ, Bloom T, Bonazzi V, Brooks JP, Buck GA, Buhay CJ, Busam DA, Campbell JL, Canon SR, Cantarel BL, Chain PSG, Chen I-MA, Chen L, Chhibba S, Chu K, Ciulla DM, Clemente JC, Clifton SW, Conlan S, Crabtree J, Cutting MA, Davidovics NJ, Davis CC, DeSantis TZ, Deal C, Delehaunty KD, Dewhirst FE, Deych E, Ding Y, Dooling DJ, Dugan SP, Dunne WM, Durkin AS, Edgar RC, Erlich RL, Farmer CN, Farrell RM, Faust K, Feldgarden M, Felix VM, Fisher S, Fodor AA, Forney LJ, Foster L, Francesco VD, Friedman J, Friedrich DC,
Kells C, King NB, Knights D, Kong HH, Koren O, Koren S, Kota KC, Kovar CL, Kyrpides NC, Rosa PSL, Lee SL, Lemon KP, Lennon N, Lewis CM, Lewis L, Ley RE, Li K, Liolios K,
Liu B, Liu Y, Lo C-C, Lozupone CA, Lunsford RD, Madden T, Mahurkar AA, Mannon PJ, Mardis ER, Markowitz VM, Mavromatis K, McCorrison JM, McDonald D, McEwen J, McGuire AL, McInnes P, Mehta T, Mihindukulasuriya KA, Miller JR, Minx PJ, Newsham I, Nusbaum C, O’Laughlin M, Orvis J, Pagani I, Palaniappan K, Patel SM, Pearson M, Peterson J, Podar M, Pohl C, Pollard KS, Pop M, Priest ME, Proctor LM, Qin X, Raes J, Ravel J, Reid JG, Rho M, Rhodes R, Riehle KP, Rivera MC, Rodriguez-Mueller B, Rogers Y-H, Ross MC, Russ C, Sanka RK, Sankar P, Sathirapongsasuti JF, Schloss JA, Schloss PD, Schmidt TM, Scholz M, Schriml L, Schubert AM, Segata N, Segre JA, Shannon WD,
Sharp RR, Sharpton TJ, Shenoy N et al.2012.Structure, function and diversity of the healthy human microbiome.Nature486:207–214DOI 10.1038/nature11234.
Kim M, Morrison M, Yu Z. 2011.Evaluation of different partial 16S rRNA gene sequence regions for phylogenetic analysis of microbiomes.Journal of Microbiological Methods84:81–87
DOI 10.1016/j.mimet.2010.10.020.
Koeppel AF, Wu M. 2013.Surprisingly extensive mixed phylogenetic and ecological signals among bacterial operational taxonomic units. Nucleic Acids Research41:5175–5188
DOI 10.1093/nar/gkt241.
Kozich JJ, Westcott SL, Baxter NT, Highlander SK, Schloss PD. 2013.Development of a dual-index sequencing strategy and curation pipeline for analyzing amplicon sequence data on the MiSeq Illumina sequencing platform.Applied and Environmental Microbiology 79:5112–5120DOI 10.1128/AEM.01043-13.
Langille MGI, Zaneveld J, Caporaso JG, McDonald D, Knights D, Reyes JA, Clemente JC, Burkepile DE, Thurber RLV, Knight R, Beiko RG, Huttenhower C. 2013.Predictive functional profiling of microbial communities using 16S rRNA marker gene sequences. Nature
Biotechnology31:814–821DOI 10.1038/nbt.2676.
Mah´e F, Rognes T, Quince C, De Vargas C, Dunthorn M. 2014.Swarm: robust and fast clustering method for amplicon-based studies.PeerJ2:e593DOI 10.7717/peerj.593.
Matthews B. 1975.Comparison of the predicted and observed secondary structure of t4 phage lysozyme.Biochimica et Biophysica Acta (BBA)—Protein Structure405:442–451
DOI 10.1016/0005-2795(75)90109-9.
May A, Abeln S, Crielaard W, Heringa J, Brandt BW. 2014.Unraveling the outcome of 16S rDNA-based taxonomy analysis through mock data and simulations. Bioinformatics 30:1530–1538DOI 10.1093/bioinformatics/btu085.
Navas-Molina JA, Peralta-S´anchez JM, Gonz´alez A, McMurdie PJ, V´azquez-Baeza Y, Xu Z, Ursell LK, Lauber C, Zhou H, Song SJ, Huntley J, Ackermann GL, Berg-Lyons D, Holmes S, Caporaso JG, Knight R. 2013.Advancing our understanding of the human microbiome using QIIME. In:Methods in enzymology. Amsterdam: Elsevier BV, 371–444.
Ooms J. 2014.The jsonlite package: a practical and consistent mapping between JSON data and R objects. ArXiv preprint.arXiv:403.2805.
Preheim SP, Perrotta AR, Martin-Platero AM, Gupta A, Alm EJ. 2013.Distribution-based clustering: using ecology to refine the operational taxonomic unit.Applied and Environmental Microbiology79:6593–6603DOI 10.1128/AEM.00342-13.
R Core Team. 2015.R: a language and environment for statistical computing. Vienna: R Foundation for Statistical Computing.Available athttps://www.R-project.org/.
Rideout JR, He Y, Navas-Molina JA, Walters WA, Ursell LK, Gibbons SM, Chase J, McDonald D, Gonzalez A, Robbins-Pianka A, Clemente JC, Gilbert JA, Huse SM, Zhou H-W, Knight R, Caporaso JG. 2014.Subsampled open-reference clustering creates consistent, comprehensive OTU definitions and scales to billions of sequences.PeerJ2:e545DOI 10.7717/peerj.545. Roesch LFW, Fulthorpe RR, Riva A, Casella G, Hadwin AKM, Kent AD, Daroub SH,
Camargo FAO, Farmerie WG, Triplett EW. 2007.Pyrosequencing enumerates and contrasts soil microbial diversity.The ISME Journal1:283–290DOI 10.1038/ismej.2007.53.
Rognes T, Mah´e F, Flouri T, McDonald D. 2015.Vsearch: VSEARCH 1.4.0
DOI 10.5281/zenodo.31443.
Schloss PD. 2010.The effects of alignment quality, distance calculation method, sequence filtering, and region on the analysis of 16S rRNA gene-based studies.PLoS Computational Biology 6:e1000844DOI 10.1371/journal.pcbi.1000844.
Schloss PD. 2012.Secondary structure improves OTU assignments of 16S rRNA gene sequences. The ISME Journal7:457–460DOI 10.1038/ismej.2012.102.
Schloss PD, Gevers D, Westcott SL. 2011.Reducing the effects of PCR amplification and sequencing artifacts on 16S rRNA-based studies.PLoS ONE6:e27310
DOI 10.1371/journal.pone.0027310.
Schloss PD, Westcott SL. 2011.Assessing and improving methods used in operational taxonomic unit-based approaches for 16S rRNA gene sequence analysis.Applied and Environmental Microbiology77:3219–3226DOI 10.1128/AEM.02810-10.
Schloss PD, Schubert AM, Zackular JP, Iverson KD, Young VB, Petrosino JF. 2012. Stabilization of the murine gut microbiome following weaning.Gut Microbes3:383–393
DOI 10.4161/gmic.21008.
Schloss PD, Westcott SL, Ryabin T, Hall JR, Hartmann M, Hollister EB, Lesniewski RA, Oakley BB, Parks DH, Robinson CJ, Sahl JW, Stres B, Thallinger GG, Horn DJV, Weber CF. 2009.Introducing mothur: open-source, platform-independent, community-supported software for describing and comparing microbial communities.Applied and Environmental Microbiology75:7537–7541DOI 10.1128/AEM.01541-09.
Schmidt TSB, Rodrigues JFM, Von Mering C. 2014a.Ecological consistency of SSU rRNA-based operational taxonomic units at a global scale.PLoS Computational Biology10:e1003594
DOI 10.1371/journal.pcbi.1003594.
Schmidt TSB, Rodrigues JFM, Von Mering C. 2014b.Limits to robustness and reproducibility in the demarcation of operational taxonomic units.Environmental Microbiology17:1689–1706
DOI 10.1111/1462-2920.12610.
Schubert AM, Sinani H, Schloss PD. 2015.Antibiotic-induced alterations of the murine gut microbiota and subsequent effects on colonization resistance againstClostridium difficile.mBio 6:e00974–15DOI 10.1128/mbio.00974-15.
Shade A, Klimowicz AK, Spear RN, Linske M, Donato JJ, Hogan CS, McManus PS,
Handelsman J. 2013.Streptomycin application has no detectable effect on bacterial community structure in apple orchard soil. Applied and Environmental Microbiology79:6617–6625
DOI 10.1128/AEM.02017-13.
Sun Y, Cai Y, Huse SM, Knight R, Farmerie WG, Wang X, Mai V. 2011.A large-scale benchmark study of existing algorithms for taxonomy-independent microbial community analysis.Briefings in Bioinformatics13:107–121DOI 10.1093/bib/bbr009.
Wang Q, Garrity GM, Tiedje JM, Cole JR. 2007.Naive bayesian classifier for rapid assignment of rRNA sequences into the new bacterial taxonomy.Applied and Environmental Microbiology 73:5261–5267DOI 10.1128/AEM.00062-07.
White JR, Navlakha S, Nagarajan N, Ghodsi M-R, Kingsford C, Pop M. 2010.Alignment and clustering of phylogenetic markers—implications for microbial diversity studies.BMC Bioinformatics11:152DOI 10.1186/1471-2105-11-152.
Winter D, Chamberlain S, Guangchun H. 2015.Rentrez 1.0.0. Zenodo
DOI 10.5281/zenodo.32420.
Xie Y. 2013.Dynamic documents with R and knitr. Boca Raton: Chapman; Hall/CRC.