www.atmos-chem-phys.org/acp/5/2519/ SRef-ID: 1680-7324/acp/2005-5-2519 European Geosciences Union
Chemistry
and Physics
Assessment of the reduction methods used to develop chemical
schemes: building of a new chemical scheme for VOC oxidation
suited to three-dimensional multiscale HO
x
-NO
x
-VOC chemistry
simulations
S. Szopa1,*, B. Aumont1, and S. Madronich2
1Laboratoire Interuniversitaire des Syst`emes Atmosph´eriques UMR CNRS 7583, Universit´e Paris 7 et Paris 12, 94 010 Cr´eteil
Cedex, France
2National Center for Atmospheric Research Atmospheric Chemistry Division, P.O. Box 3000, Boulder, Colorado 80307, USA *now at: Laboratoire des Sciences du Climat et de l’Environnement UMR CNRS/CEA 1572, L’Orme des Merisiers-bat.701,
91 191 Gif-sur-Yvette, France
Received: 22 November 2004 – Published in Atmos. Chem. Phys. Discuss.: 11 February 2005 Revised: 27 May 2005 – Accepted: 5 September 2005 – Published: 22 September 2005
Abstract. The objective of this work was to develop and assess an automatic procedure to generate reduced chemical schemes for the atmospheric photooxidation of volatile or-ganic carbon (VOC) compounds. The procedure is based on (i) the development of a tool for writing the fully explicit schemes for VOC oxidation (see companion paper Aumont et al., 2005), (ii) the application of several commonly used reduction methods to the fully explicit scheme, and (iii) the assessment of resulting errors based on direct comparison be-tween the reduced and full schemes.
The reference scheme included seventy emitted VOCs chosen to be representative of both anthropogenic and bio-genic emissions, and their atmospheric degradation chem-istry required more than two million reactions among 350 000 species. Three methods were applied to reduce the size of the reference chemical scheme: (i) use of operators, based on the redundancy of the reaction sequences involved in the VOC oxidation, (ii) grouping of primary species hav-ing similar reactivities into surrogate species and (iii) group-ing of some secondary products into surrogate species. The number of species in the final reduced scheme is 147, this being small enough for practical inclusion in current three-dimensional models. Comparisons between the fully explicit and reduced schemes, carried out with a box model for sev-eral typical tropospheric conditions, showed that the reduced chemical scheme accurately predicts ozone concentrations and some other aspects of oxidant chemistry for both pol-luted and clean tropospheric conditions.
Correspondence to:S. Szopa ([email protected])
1 Introduction
The atmospheric oxidation of volatile organic compounds (VOCs) modifies the concentrations of key trace species (e.g. CH4, CO, O3and OH) and has impacts throughout the
atmosphere. At urban and regional scales, VOC oxidation drives the production of high ozone concentrations close to anthropogenic activities. Globally, the reactivity of the CO-NOx-VOC system controls the abundance of ozone and OH
and plays direct and indirect roles in radiative forcing and therefore climate.
Recent studies have shown the interactions of chemistry occurring at different scales. Variations of the background ozone concentrations can significantly impact the ozone val-ues observed at regional scale (Fiore et al., 2002; Li et al., 2002; L¨angmann and Bauer, 2002). Furthermore, reactive species (esp. radicals and NOx) can form reservoir species
near their sources, then be redistributed over large geo-graphic scales by convective and advective transport. Alkyl nitrates and peroxyacetyl nitrates (PANs) may be particularly effective in supplying NOxto the remote troposphere, with
consequences for the net production of O3on hemispheric or
even global scales (Moxim et al., 1996). Similarly, hydroper-oxydes, ketones or aldehydes could be a significant source of radicals in the free troposphere (Wennberg et al., 1998; M¨uller and Brasseur, 1999; Prather and Jacob, 1997).
The chemical schemes used in three-dimensional chemistry-transport models (3-D CTMs) attempt to repre-sent the HOx/NOx/VOC chemistry both locally where high
concentrations of precursors VOC and NOxmay exist, and
very low. Chemical schemes must then be suited to these different chemical regimes, and must represent the formation of, and release from, reservoir species that connect these scales.
The atmospheric chemistry of VOCs involves many hun-dreds of initially emitted anthropogenic or natural com-pounds, as well as many thousands (or more) of potentially important intermediate partly oxidized species. Representa-tion of the fully explicit VOC chemistry in chemistry trans-port models (CTMs) is not currently practical due to lim-ited computer resources, so that reduced chemical schemes must be employed that contain typically only a few hun-dred species, e.g. 33 species for the Carbon Bond Mechanism CBM IV (Gery et al., 1989), 64 species for RACM (Stock-well et al., 1997), and 62 species for SAPRC99 (Carter, 2000). The methods for developing these schemes have in-cluded, for example, use of surrogates or lumped species to represent a family of compounds, and truncation of some peroxy radicals reactions. The accuracy of some reduction methods may depend on the particular case under consid-eration, in particular the chemical regime characterizing the relative importance of the different reactions involved dur-ing VOC oxidation. Consequently, the reduction of fully ex-plicit VOC chemistry to a smaller mechanism often limits the validity of the smaller mechanism to a specific chemical regime, e.g., highly polluted, or pristine remote, but not both. The objective of this work was to develop and assess an automatic procedure to generate reduced chemical schemes for the atmospheric photooxidation of VOCs under vari-ous chemical regimes, from NOxlimited to NOx saturated
regimes. The study focuses on the Ox/NOx/HOxchemistry
and the reduction of the VOC oxidation schemes for that par-ticular system. Attention was given to including the chem-istry of secondary organics to the extent that it influences the HOx, NOx, and Ox cycles. However, other aspects of
organic photooxidation, such as the specific identity of com-pounds that could contribute to secondary organic aerosols formation, or to cloud chemistry, are not emphasized here.
A novel aspect of this work is the use of a highly detailed explicit reference scheme, developed by an automatic chem-ical generator code (described in a companion paper – Au-mont et al., 2005), both as the initial scheme to which the re-ductions are applied, and as a benchmark for evaluating the accuracy of the reductions. The reduction methods were also automated, allowing fast updates of the schemes, modifica-tions of reduction hypothesis, and “tagging” of some specific reactions to identify and quantify individual chemical pro-cesses.
This paper first describes briefly the reference chemical scheme (Sect. 2) and the various scenarios used to com-pare explicit and reduced schemes (Sect. 3). Secondly, the automatic procedures used to reduce the number of species and reactions in the chemical schemes are described (Sect. 4), and the biases induced by the reductions are as-sessed (Sects. 5 and 6). The final reduced scheme, consisting
of 472 reactions among 147 species, is given in Appendix A (see supplemental material: http://www.atmos-chem-phys. org/acp/5/2519/acp-5-2519-sp.zip).
2 The reference scheme
As described in the companion paper (Aumont et al., 2005), the generator is a computer program that calculates and writes the fully explicit atmospheric degradation mechanism and associated kinetics for an initially specified organic com-pound, down to the ultimate products CO2and H2O.
Reac-tion pathways (the products) and kinetic data are taken from laboratory measurements when available, or otherwise are computed from structure-activity relations (SARs) derived by analogy with known reactions, based on data published before 2003 as described by Laval-Szopa (2003). An impor-tant advantage of the generator method is that as new lab-oratory data become available, the generator code is easily updated and a revised mechanism, fully consistent with the new information, is re-generated.
The inorganic chemistry and the chemistry of one-carbon species are relatively well known and do not require new estimation of products or rate constant. This chemistry is added manually to the schemes from the generator, and is taken from the SAPRC99 mechanism updated with new data where available (Sander et al., 2000; Atkinson et al., 1999).
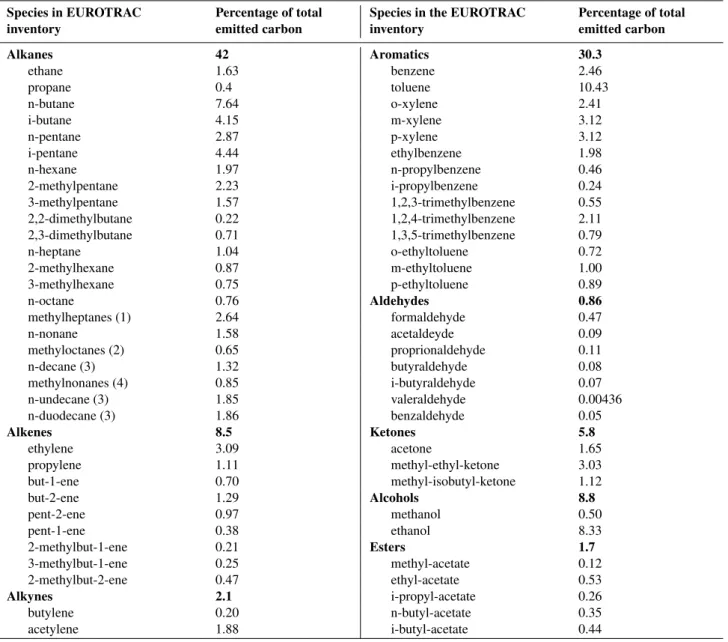
The reference scheme cannot include the oxidation scheme for the whole set of VOC that are emitted into the atmosphere (the size of such schemes would be unmanage-able). A subset of primary species, representative of both anthropogenic and biogenic emissions must thus be first se-lected. This subset must be sufficiently large in order that the conclusions ultimately reached can be extended and gen-eralized to other primary compounds not specifically con-sidered here. The primary anthropogenic species retained here are those selected in the EUROTRAC-2 protocol for in-tercomparison of multiphase tropospheric chemical schemes (Poppe et al., 2001). The VOC emission partitioning in this protocol is based upon the inventory developed by Derwent and Jenkin (1991). Modifications were made to keep only species containing less than ten carbon atoms. The sions of longer carbon chain species were added to the emis-sions of species having the closest structure (i.e., n-nonane for n-alkanes having ten or more carbon atoms, and methyl-octanes for methyl-nonanes). To maintain carbon conser-vation, the emissions of species havingmcarbons (m≥10) was multiplied by m/9. In total, emissions of 64 anthro-pogenic emitted VOC were considered (Table 1), plus bio-genic emission of isoprene,α-pinene and limonene. The ref-erence chemical scheme was then built using the generator for this set of primary VOCs.
Table 1.Anthropogenic VOC speciation at emission used in the CMD-EUROTRAC-2 protocol (Poppe et al., 2001).
Species in EUROTRAC Percentage of total Species in the EUROTRAC Percentage of total
inventory emitted carbon inventory emitted carbon
Alkanes 42 Aromatics 30.3
ethane 1.63 benzene 2.46
propane 0.4 toluene 10.43
n-butane 7.64 o-xylene 2.41
i-butane 4.15 m-xylene 3.12
n-pentane 2.87 p-xylene 3.12
i-pentane 4.44 ethylbenzene 1.98 n-hexane 1.97 n-propylbenzene 0.46 2-methylpentane 2.23 i-propylbenzene 0.24 3-methylpentane 1.57 1,2,3-trimethylbenzene 0.55 2,2-dimethylbutane 0.22 1,2,4-trimethylbenzene 2.11 2,3-dimethylbutane 0.71 1,3,5-trimethylbenzene 0.79 n-heptane 1.04 o-ethyltoluene 0.72 2-methylhexane 0.87 m-ethyltoluene 1.00 3-methylhexane 0.75 p-ethyltoluene 0.89
n-octane 0.76 Aldehydes 0.86
methylheptanes (1) 2.64 formaldehyde 0.47
n-nonane 1.58 acetaldeyde 0.09
methyloctanes (2) 0.65 proprionaldehyde 0.11 n-decane (3) 1.32 butyraldehyde 0.08 methylnonanes (4) 0.85 i-butyraldehyde 0.07 n-undecane (3) 1.85 valeraldehyde 0.00436 n-duodecane (3) 1.86 benzaldehyde 0.05
Alkenes 8.5 Ketones 5.8
ethylene 3.09 acetone 1.65
propylene 1.11 methyl-ethyl-ketone 3.03 but-1-ene 0.70 methyl-isobutyl-ketone 1.12
but-2-ene 1.29 Alcohols 8.8
pent-2-ene 0.97 methanol 0.50
pent-1-ene 0.38 ethanol 8.33
2-methylbut-1-ene 0.21 Esters 1.7
3-methylbut-1-ene 0.25 methyl-acetate 0.12 2-methylbut-2-ene 0.47 ethyl-acetate 0.53
Alkynes 2.1 i-propyl-acetate 0.26
butylene 0.20 n-butyl-acetate 0.35 acetylene 1.88 i-butyl-acetate 0.44
(1) equally split between 2-methylheptane, 3-methylheptane and 4-methylheptane; (2) equally split between 2-methyloctane, 3-methyloctane and 4-methyloctane; (3) emission assigned to n-nonane; (4) emission assigned to methyl-octanes
unique representations in the generator code. Although a new version of the generator capable of treating cyclic species is under development, here the relatively few initial reactions for cyclic species were written manually using the schemes developed by Carter (2000). The non-cyclic secondary prod-ucts from these reactions were then handled automatically by the generator.
The fully explicit description of the oxidation schemes for the 64 emitted VOC considered here would lead to a chemi-cal scheme with approximately 4×10¹⁰species and 4×10¹¹ reactions, based on Eq. (1) of Aumont et al. (2005) (see Fig. 1). The solution of this fully explicit scheme would
be problematic even in a zero-dimensional (box model) con-text. Therefore, an automated pre-reduction was applied using the generator code (note that this pre-reduction is a requirement unique to our generator scheme, while the re-ductions discussed in Sect. 4 are “usual” rere-ductions used in common chemical schemes). The pre-reduction was carried out by replacing some secondary species by isomers already treated during the writing of the scheme. Every secondary species produced after three generation of non-radical prod-ucts (VOCprim→VOCsec→VOCthird) was compared with
Level 3: surrogates for secondary species Pre-reduction: reference
chemical scheme
Level 1: counter for RO2 permutation limited to 3
Level 2a: operator method
Level 2b: surrogates for primary species Fully explicit
chemical scheme
operator + surrogates for primary species
359 660 species 2 270 159 reactions
345 391 species 1 798 480 reactions
1 350 species 5 616 reactions
84 742 species 439 681 reactions
530 species 1 934 reactions
147 species 472 reactions ≈ 4×10¹⁰ species
≈ 4×10¹¹ reactions
Fig. 1.Number of species and reactions in the schemes at different levels of reduction. Numbers for the fully explicit chemical scheme are estimated values.
the list was done if (i) it bears the same number of carbon atoms (ii) it contains the same functional groups and (iii) the positions of functional groups in the two species do not in-duce a particular reactivity for the molecule or its products (for example, a C-C=C-CO- structure cannot be replaced by a C=C-C-CO- structure, as these two isomers have dis-tinct behaviour due to electron delocalization). The loss of accuracy from this pre-reduction was tested by comparing pre-reduced schemes with fully explicit schemes for hexane and for isoprene. The simulations were run over 5 days un-der four different NOxconditions (three cases in which the
NOx level was respectively kept to a fixed value of 1ppb,
100 ppt and 10ppt and one case in which NOxevolved freely
from an initial value of 1 ppb). For both hexane and iso-prene, correlation coefficients were found to be greater than 0.9999 on the 1:1 line for O3, NOx, H2O2, OH and HO2
when using this pre-reduction. For partly oxidized organic compounds, comparisons were made on a functional group basis. No significant differences between the explicit and pre-reduced mechanisms were observed during the first three simulated days and in all cases considered. However, a slight bias arose in the representation of some functional groups after three days (typically lesser than a few %). Concen-tration timeseries for the various functional groups are pro-vided in Appendix B (http://www.atmos-chem-phys.org/acp/ 5/2519/acp-5-2519-sp.zip). After this pre-reduction, the ref-erence scheme describes the oxidation of the 67 primary VOC through more than 2 million reactions among 350 000 species.
3 Scenarios
The effect of the reductions was tested using five scenar-ios representing various environmental conditions. Simula-tions were conducted for both summer and winter condiSimula-tions.
A two-layer box model was used to represent some verti-cal mixing, while still allowing practiverti-cal computation of the chemistry with both the explicit and the reduced chemical schemes.
3.1 Moderately and highly polluted scenarios
Two scenarios represent typical urban and polluted rural ar-eas. The general conditions for these two scenarios are sim-ilar to those described by Aumont et al. (2003). Compounds are exchanged between the two layers (representing the con-tinental boundary layer and the residual layer above it) dur-ing the diurnal variation of the boundary layer height. The top of the lower layer varies from 150 m during the night to 1000 m in the afternoon for the summer conditions, and from 150 to 500 m for the winter conditions. The top of the upper layer is fixed at 2000 and 1000 m for the summer and winter scenarios, respectively. Initial conditions for both layers are from Sillman et al. (1990) and represent typical rural concen-trations. The residence time (or the flushing time) of the air inside the box is 6 h for the urban scenario and 36 h for the polluted rural scenarios, incoming air having concentrations equal to initial concentrations. The anthropogenic emissions of NOxand VOC are based on Sillman et al. (1990) and Bey
et al. (2001), and correspond to averaged values for typical urban and rural areas. The speciation of hydrocarbon emis-sions is based on the inventory provided by Derwent and Jenkin (1991), as discussed above (see Table 1). Diurnal vari-ations of anthropogenic NOx and VOC emissions were
pa-rameterized according to Hough (1986), as described in Bey et al. (2001). Biogenic emissions of NOxand VOC (isoprene
con-sidered for SO2, O3, H2O2, NO2, NO and HNO3. We used
the categories 1 (mid summer with lush vegetation) and 3 (late autumn after frost, no snow) provided by Wesely (1989) to estimate the deposition velocities for the summer and win-ter scenarios, respectively. Actinic fluxes were computed us-ing the TUV model (Madronich and Flocke, 1998) in which we introduced the optical properties of aerosol mixtures rec-ommended by the World Climate Research Program (1986). Photolysis rates were calculated for 45◦N under cloud-free conditions for a typical winter and summer day. Simulations were run over five days, corresponding to the time required to reach two nearly identical successive diurnal cycles for key species (e.g. O3, NOx, H2O2, OH, HO2). The 24 h diurnal
profiles presented below are given for the fifth day.
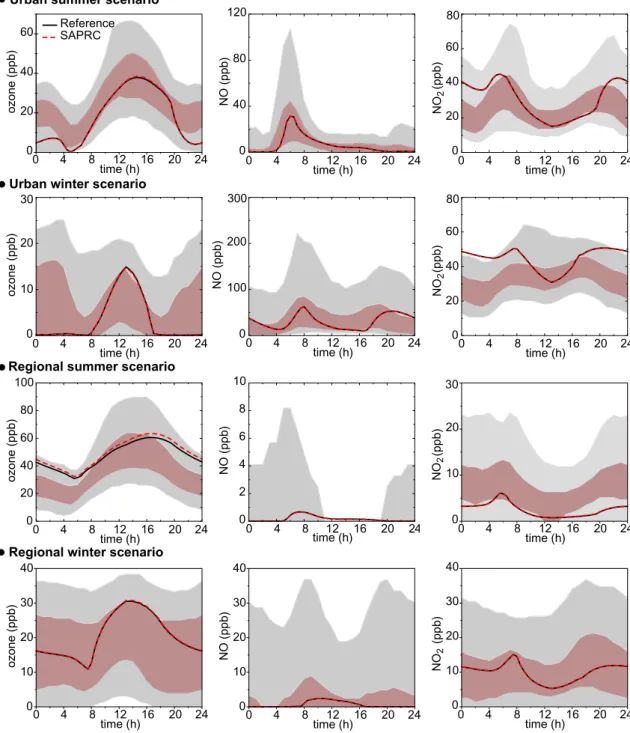
Figure 2 shows the simulations obtained with the reference model for the urban and regional scenarios. These results are compared with those obtained using the SAPRC99 scheme (Carter, 2000), but with the same inorganic chemistry as the reference scheme (see Aumont et al., 2005). Also shown are typical diurnal profiles measured by the Paris air qual-ity network (data available at http://www.airparif.asso.fr) at two locations: “Paris 18”, an urban station away from ma-jor traffic influence, was chosen to be representative of the urban background atmosphere; and “Rambouillet”, a rural station located 30 km south/west of Paris that can experience high ozone concentrations during summertime, was chosen to be representative of the regional scenario. Figure 2 shows very good agreement between the simulated concentrations with SAPRC99 and the reference scheme, and the compar-ison with measurements indicates that the chosen scenarios are reasonably representative of urban and regional condi-tions.
3.2 Free relaxation of air masses
Three other scenarios were built to test chemical schemes under low-NOx conditions. In order to begin the
simula-tions with a VOC speciation representative of an aged air mass, these relaxation scenarios were initialized with the re-sults from the moderately polluted scenario described above. Specifically, initial concentrations are taken at noon on the fifth day of the moderately polluted scenario. Two scenar-ios, summer and winter, were considered for relaxation of air masses in the boundary layer. Neither emissions nor ad-vection nor variation of the mixing height are considered in these scenarios. However, deposition was considered for SO2, O3, H2O2, NO2, NO and HNO3. Deposition
veloc-ities were computed with surface category 9, “water, both salt and fresh” (Wesely, 1989). Finally, another scenario was constructed for low pressure (540 mbar), low tempera-ture (256 K) and low water vapor concentration. These val-ues were taken from the US Standard Atmosphere 1976 for typical air mass at 5 km. No deposition is considered for this scenario.
4 Reduction methods
Various reduction methods have been used historically for the development of simplified chemical schemes for 3-D chemistry transport models (e.g. the commonly used Car-bon Bond, RACM, and SAPRC99). These methods gener-ally involve the replacement of a subset of chemicgener-ally similar species by a single, either explicit or generic species (surro-gate or lumping methods), and by the introduction of pseudo-species (counters or operators) to drive chemical transforma-tions which control the overall reactivity (e.g. radical propa-gation vs. termination) or the production of oxidants (e.g. NO →NO2conversions). These reductions have typically been
applied manually to an initially more complete – but still not fully explicit – scheme. With the development of very large explicit mechanisms, such as the MCM (Jenkin et al., 2003) and the automatically generated mechanism used here, there is a need for a reduction methodology that can be automated for computer-based systematic reductions starting from these reference schemes. Furthermore, it is likely that a fully ex-plicit scheme is a better benchmark for evaluating the accu-racy of the reduced mechanism over a wide range of condi-tions.
The reduction methods tested in this work were automated to allow fast writing of reduced schemes and to facilitate modifications with future updates. The different levels of re-duction are summarized on the Fig. 1. A short description of the methods is given below. More details concerning the reductions are given by Laval-Szopa (2003).
4.1 Counter species for peroxy radical chemistry
Organic peroxy radicals (RO2) are among the most important
and ubiquitous radical species formed in the atmospheric ox-idation of both the initial hydrocarbons and the subsequent non-radical organic intermediates. The number of RO2
rad-icals is quite large in explicit schemes, being comparable to, and frequently larger than, the number of non-radical VOCs. Peroxy radicals react among themselves (RO2+R′O2, the
so-called permutation reactions), so that an explicit mechanism containingnperoxy radicals will includen(n+1)/2 permu-tation reactions. Furthermore, many of these reactions have multiple product pathways, so that the total number of per-mutation reactions can be exceedingly large. Madronich and Calvert (1990) noted that if the RO2’s can be subdivided into
a small numbermof reactivity classes (m=4 in their case), a counter-based scheme that conserves both reaction rates and product identities can be used instead of the full set of per-mutation reactions. The number of reactions in their counter scheme increases linearly (m×n) rather than quadratically withn. Here, we use a similar counter method but with dif-ferent numbers of reactivity classes.
0 20 40 60
ozone (ppb)
Reference SAPRC
0 40 80 120
NO (ppb)
0 20 40 60
(ppb)
0 10 20
ozone (ppb)
0 100 200
NO (ppb)
0 20 40 60
(ppb)
0 20 40 60 80 100
ozone (ppb)
0 4 8 12 16 20 24
time (h) 0
2 4 6 8 10
NO (ppb)
0 10 20
(ppb)
0 10 20 30 40
ozone (ppb)
0 10 20 30 40
NO (ppb)
0 10 20 30 40
NO
2
(ppb)
80
300 80
30
Urban summer scenario
Urban winter scenario
Regional summer scenario
Regional winter scenario
30
NO
2
NO
2
NO
2
12 16 20 24
time (h)
0 4 8
12 16 20 24
time (h)
0 4 8
12 16 20 24
time (h)
0 4 8
12 16 20 24
time (h)
0 4 8
12 16 20 24
time (h)
0 4 8
12 16 20 24
time (h)
0 4 8
12 16 20 24
time (h)
0 4 8 12 16 20 24
time (h)
0 4 8
12 16 20 24
time (h)
0 4 8
12 16 20 24
time (h)
0 4 8
12 16 20 24
time (h)
0 4 8
Fig. 2.Simulated mixing ratios of O3, NO and NO2for the highly and moderately polluted scenarios simulated with the reference scheme (black line) and the SAPRC99 scheme (long dashed red line). The shaded areas are measurements (respectively in a Paris urban station and in a rural station in the suburbs of Paris, averaged over the years 1993–2001). The pale gray zones represent the 5 and 95 percentiles. The dark zones represent the 25 and 75 percentiles. In the regional winter scenario for NO, the 5, 25, and most 75 percentiles are below the detection limit (2.5 ppb) and are therefore not shown.
classes of peroxy radicals were tested for conditions similar to those described by Madronich and Calvert (1990) for the marine boundary layer. The effect of this simplification was tested by comparing the results obtained with those simulated when using all nine reactivity classes. A good agreement was
found when using only 3 different reactivity classes instead of 9 in the explicit chemical scheme. These classes are:
1. Acyl-peroxys (RCOO2+RO2) which react rapidly
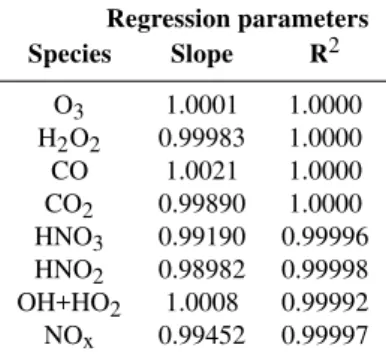
Table 2. Biases due to the reduction by decreasing the number of peroxy recombination reactivity: regression parameters for in-organic species.
Regression parameters Species Slope R2
O3 1.0001 1.0000 H2O2 0.99983 1.0000
CO 1.0021 1.0000 CO2 0.99890 1.0000
HNO3 0.99190 0.99996
HNO2 0.98982 0.99998
OH+HO2 1.0008 0.99992
NOx 0.99452 0.99997
radicals. A cross-reaction rate constant of 10−11 molecule−1cm3s−1is taken for all RCOO
2+RO2
reac-tions.
2. Peroxy radicals having self-reaction rate con-stant greater than 10−13 molecule−1cm3s−1 at 298 K are represented by a class of peroxy re-acting with a single self-reaction rate constant of 1.2×10⁻¹² molecule−1cm3s−1 at 298 K. This rate constant corresponds to that recommended by Lesclaux (1997) for the primary peroxy radical with a branching in the alpha-position.
3. Peroxy having a self-reactions rate constant less than 10−13molecule−1cm3s−1 at 298 K for which self-reactions and cross-self-reactions are neglected. The neglect of these reactions also led to a reduction in the number of species (see Fig. 1).
The regression parameters for key inorganic species and the deviations for organic functional groups, relative to the scheme involving nine classes of peroxys, are presented in the Tables 2 and 3. For inorganic species, the grouping of peroxy radical classes has no significant impact on the sim-ulated concentrations. For organic functions, maximums bi-ases due to this reduction never exceed a few percent. This reduction decreases significantly the number of reactions (by 20%) but induces only a slight decrease in the number of species (4%).
4.2 Operator species for peroxy radical chemistry
As stated in the previous section, the representation of VOC degradation requires a large number of peroxy radicals to describe the many possible different degradation pathways. The “chemical operator” method (Gery et al., 1989; Carter, 1990; Aumont et al., 1996) was developed to decrease the number of required peroxy radicals. In this approach, when
Table 3. Biases due to the reduction by decreasing the number of peroxy recombination reactivity: maximum relative deviations for the organic functions.
Function Maximum relative deviation (%) Hydroperoxyde −3.9
Alcohol 5.9
Aldehyde 1.2
Nitrate 2.3
Peroxy acid 3.5 Carboxylic Acid −3.8
a peroxy radical is formed, instead of being represented ex-plicitly, it is replaced by (i) the oxygenated products which would be ultimately formed under high NOx concentration
and (ii) some artificial species (called “chemical operators”) which are used to represent the net effects of the peroxy radical reactions on the NO consumption, NO2 formation,
HO2consumption and formation, and nitrate or
hydroperox-ide formation. This method relies on the following assump-tions: (1) the rate of the organic oxidation process is lim-ited by the initiation of the organic radical chain, and (2) the effect on inorganic budgets (NO to NO2 conversion, HO2
consumption and/or regeneration, NO consumption during formation of nitrate, etc.) are redundant for various VOCs despite their structural differences. With these two assump-tions, a generalized reaction can be written for each VOC, in which product yields represent the organic sequences up to the secondary non-radical organic products resulting from the oxidation of the parent VOC considered. In these general-ized reactions, chemical operators are used to drive inorganic transformations, such as NO to NO2conversion or HO2
rad-ical regeneration. Here, we automated the method and we modified the operator method to extend its accuracy to low NOxconditions.
Each oxidation of an organic compound is written by a global reaction as follows:
VOC +oxidant(or photon) →
a1VOCsec,1 + · · · +anVOCsec,n +
b1<peroxy1>+ · · · + bn<peroxyn> (R1)
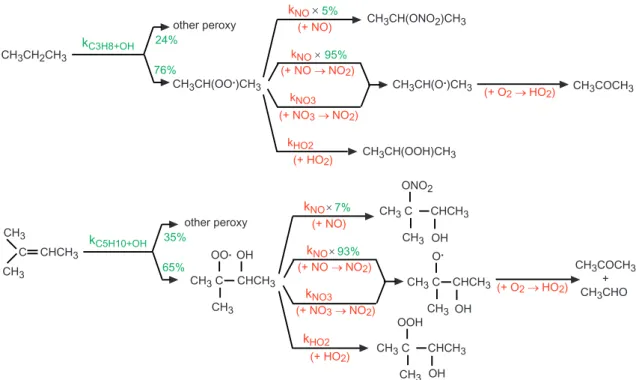
The various terms of the reaction are described below. The practical implementation of this method is illustrated in Figs. 3 and 4 for propane.
The left side of the reaction describes the initiation of the oxidation of each explicit non-radical VOC. This VOC could equally well be a primary (emitted) VOC or one formed by subsequent chemistry (secondary species). The inorganic ox-idant can be OH, O3, NO3or the oxidation can be initiated
by photolysis. VOCsec,1trough VOCsec,nrepresent the first
CH3CH2CH3
CH3CH(OO.)CH3
CH3CH(ONO2)CH3
CH3CH(O.)CH3
CH3CH(OOH)CH3
CH3COCH3 kC3H8+OH
other peroxy
kNO×5%
kNO×95% (+ NO → NO2)
(+ NO)
kNO3
(+ NO3→ NO2)
kHO2
(+ HO2)
(+ O2→ HO2) 24%
76%
C CH3
CH3
CHCH3
kC5H10+OH
other peroxy
35%
65%
CH3 C
CH3 CHCH3
CH3COCH3 + CH3CHO kNO×7%
kNO×93%
(+ NO → NO2) (+ NO)
kNO3
(+ NO3→ NO2)
kHO2
(+ HO2)
(+ O2→ HO2) OO.OH
CH3 C
CH3 CHCH3 ONO2
OH
CH3 C
CH3 CHCH3 O.
OH
CH3 C
CH3 CHCH3 OOH
OH
Fig. 3.Illustration of the similarities in the oxidation of two different VOCs. In green: kinetic elements differing in the two chains. In red: redundant elements in the two chains. For simplicity, peroxy permutation reactions are not shown in the figure.
by the oxidation of the VOC. They are explicit non-radical VOCs, formed by the major reaction pathways of the radicals produced from the original VOC. The<peroxy>operators and coefficientsa1–anandb1–bnare discussed below.
Reaction (R1) is intended to replace a large number of ex-plicit reaction pathways that transform the initial VOC to its first generation non-radical products. Multiple transforma-tion pathways are common, e.g. from OH attack at differ-ent positions of the initial VOC, as well as from branching of the subsequent reactions of peroxy and alkoxy radicals. With some assumptions, the yields of the first generation products can be estimated from the branching ratios of all the explicit reactions in each possible pathway. For exam-ple, Calvert and Madronich (1987) estimated (manually) the yields of the first generation products of many hydrocarbons, separately for high and low NOxconditions. Here, we take
advantage of the explicit generator code to write, for each initial VOC, all the possible reaction pathways. This allows us to identify unambiguously the first generation non-radical products (VOCsec,1trough VOCsec,n) and to calculate their
respective yieldsa1–an, also accounting for the possibility
that multiple pathways can lead to the same product. Be-cause this procedure is automated, products and yields are easily computed not only for initial hydrocarbons, but also for all of the intermediate non-radical VOCs. Two simplify-ing assumptions were made: all branchsimplify-ing ratios were com-puted at a fixed temperature (298 K), and branching ratios
for RO2reactions were computed assuming high NOx
condi-tions. These two assumptions are required to compute fixed
ai yields, i.e. not varying with physical or chemical
condi-tions. While the high NOxassumption may appear severe,
it should be noted that (i) high NOxis only assumed for the
derivation of the terms on the right side of Reaction (R1), not for the remainder of the chemical scheme; (ii) organic nitrate formation is treated separately; (iii) degradation of explicit organic peroxides would mostly lead to the same products as the high NOxscheme (although with some delay); and (iv)
formation of surrogate (but not explicit) organic peroxides is effected by the<peroxy>operator chemistry (see below). Thus, we anticipate that the reduced mechanism should re-main reasonably accurate even at low NOxconditions.
The peroxy operators (denoted<peroxy>) are mass-less peroxy-like radical species introduced to represent the effects of Reaction (R1) on radical and NOxbudgets, approximating
CH3CH2CH3 0.76 0.95 CH
(
3COCH3 + 0.95 <RO2> + 0.05 <NITR> + 0.24)
(VOC and <peroxy> from other channels)
secondary VOC produced assuming high NOx conditions
<peroxy> operators characterizing the organic radical chain
where - <RO2> is a chemical operator for NO to NO2 conversion and HO2 formation at the end of the chain
- <NITR> is a chemical operator for NO consumption and organic nitrate formation Global equation :
<peroxy> operator chemistry :
<RO2> + NO
<RO2> + NO3
<RO2> + HO2
NO2 + HO2
NO2 + HO2
Hydroper_RO2
<NITR> + NO
<NITR> + NO3
<NITR> + HO2
NITR
NO2 + HO2
Hydroper_NITR
where - Hydroper_RO2 and Hydroper_NITR are carbon-less surrogates hydroperoxides (see text) - NITR is a surrogate for organic nitrate
kNO
kNO3
kHO2
kNO
kNO3
kHO2
Fig. 4.Illustration of the peroxy operator approach for propane. The yields in the global equation are based on the branching ratio shown Fig. 3. For simplicity, figure does not show peroxy permutation reactions and reactions from other, minor, channels.
the many different explicit peroxy radicals arising from dif-ferent initial VOCs.
Construction of different<peroxy>types is made auto-matically from the previously generated explicit scheme, and is based on several criteria:
1. CH3O2radicals are treated explicitly.
2. Each explicit alkylperoxy radical is replaced by an oper-ator<NITR>to represent nitrate formation, and one or more operators to describe the NO→NO2conversion
path. The nitrate formation reaction is then represented as:
<NITR>+NO→NITR (R2)
where NITR is a surrogate species representing organic nitrates. In principle it is straightforward to retain de-tailed information about the nitrates formed, e.g. with the same number of carbon atoms as the explicit nitrate, using different nitrate operators (<NITR1>,
<NITR2>, etc.) to give different nitrate products (NITR1, NITR2, etc.). However this high detail is not retained in the final reduced scheme presented here, and only 3 different nitrate operators are used. Note that by producing nitrate from the<NITR>+NO reaction (in-stead of in Eq. R1), we ensure that this will occur only when sufficient NO is present. Operators for NO → NO2 conversions are further categorized according to
the co-product of the reaction with NO, as follows:
<RO2>+NO→NO2+HO2 (R3) <OHRO2>+NO→NO2+OH (R4)
<2NO2>+NO→NO2+NO2 (R5)
<NONO2>+NO→NO2 (R6)
<NONO2 C>+NO→NO2+CH3O2 (R7)
These distinctions ensure that the NOxand radical
bud-gets are kept similar to the original explicit scheme. 3. An additional distinction is made between radicals that
react rapidly or slowly in peroxy radical permutations (see Sect. 4.1). The<peroxy>operators defined by the Reactions (R3–R7) were therefore split into 2 classes to take this distinction into account.
4. In many cases, the Reaction (R3) is insufficient to rep-resent the number of NO→NO2conversions that
ulti-mately leads to HO2. For example, if the product of the <RO2>+NO reaction is a large alkoxy radical, its iso-merization can lead to new organic peroxy radical rather than immediately to HO2. The SAPRC99 scheme uses
a parallel treatment, wherein Reaction (R6) is added to the scheme to represent any additional peroxy forma-tion and the impact on the NOxbudget (see Fig. 5).
Un-der low NOxconditions, this parallel treatment induces
(i) an overestimation of NO→NO2conversions and of
HO2production, and (ii) an underestimations of organic
hydroperoxide formation. Here, the operator method was tailored to various conditions including low NOx
conditions, using additional peroxy operators in which a sequential treatment of successive RO2 formation is
introduced:
VOC1 + OH Peroxy3 Peroxy2 Peroxy1 VOC2 + HO2
HO2 HO2 HO2
hydroperoxyde3 hydroperoxyde2 hydroperoxyde1
Sequential treatment Parallel treatment
VOC1 + OH → VOC2 + <RO23>
<RO23> + NO → <RO22> + NO2 <RO23> + HO2 → hydroper3 <RO22> + NO → <RO21> + NO2
<RO22> + HO2 → hydroper2 <RO21> + NO → HO2 + NO2
<RO21> + HO2 → hydroper1
VOC1 + OH → VOC2 + <RO21> + 2 <NONO21> <RO21> + NO → HO2 + NO2
<RO21> + HO2 → hydroper
<NONO21> + NO → NO2 <NONO21> + HO2 → hydroper
Fig. 5.Schematic comparison of the parallel and sequential treatments in the operator method. For simplicity, formation of organic nitrates is not shown.
until, for n=1, the<RO2n−1>operator is replaced by HO2. Compared to the parallel approach, the
sequen-tial treatment provides a more accurate representation of the radical organic chains but requires an increased number of operators. In practice, we limit n≤3. When-ever a sequence includes the succesive production of more than three peroxy radicals, the first generations of NO/NO2 conversions are arbitrarily treated in parallel
and the last three generations are treated sequentially. The parallel treatment was also used for the pathways leading to nitrate formation.
5. Acylperoxy radicals are treated separately from alkyperoxy radicals. The explicit organic products writ-ten in the global Reaction (R1) are those arising from RC(=O)O2+NO reaction in the explicit scheme. The
as-sociated operator,<RO2 A>, converts NO to NO2and
produces the appropriate peroxy radical:
<RO2 A>+NO→NO2+<peroxy> (R9)
Nevertheless, in ambient air, the evolution of acyl per-oxy depends notably on the NO/NO2ratio, which
con-trols the formation of PAN-type species. The formation of PAN is given by the reaction:
<RO2 A>+NO2→PANs (R10)
where PANs is a carbon-less peroxy acyl nitrate surro-gate for PAN like compounds.
Finally, we note that the <peroxy>and <acylperoxy>
operators undergo all of the other reactions that explicit per-oxy radicals participate in. For example, for the<RO2n>
operator, additional reactions are:
<RO2n>+HO2→Hydroper RO2n (R11) <RO2n>+NO3→NO2+<RO2n−1> (R12)
<RO2n>+RO2count →c <RO2n−1> (R13)
where Hydroper RO2n are organic peroxide surrogates,
RO2countare the counter species for the RO2+RO2
permuta-tion reacpermuta-tions (see Sect. 4.1) andcis a branching ratio com-puted from the explicit scheme.
Additional surrogate non radical species were introduced to take into account the formation of organic functional-ities not generated by the RO2+NO reactions, like PANs
(e.g. R10), hydroperoxides (e.g. R11), acids, and peracids (e.g. the reactions of peroxyacyl with HO2). Although these
are zero-carbon species, they undergo chemical processing similar to their explicit analogs. For example, surrogate hy-droperoxides can react with OH or can be photodissociated and reform radical species (OH, HO2 or<RO2>) with the
rate constant corresponding to that of the attack of OH on the -OOH function, much like explicit organic hydroperoxides. The PAN-like species can regenerate NO2at the same rate as
peroxy acetyl nitrate by decomposition and photolysis. The coefficientsb1–bnare calculated on the same way as
a1–an, i.e. from the explicit reference mechanism by
mul-tiplication of branching ratios computed at 298 K and high NOx conditions (see coefficients in the Fig. 3 and 4 for the
chemistry are done automatically. The application of this method to the reference scheme results in a very strong de-crease of the number of species in the chemical scheme (1350 versus 3.6×10⁵) using approximately 40 different operators. 4.3 Surrogates for primary VOCs
A common reduction technique is based on replacing the ex-plicit primary VOC’s, which can be numerous near anthro-pogenic sources, by a much smaller number of “lumped” or “surrogate” species. Lumped species are used to represent the average behaviour of a group of compounds, e.g. the vir-tual species ALK L representing the average properties of larger alkanes, while surrogate species are explicit species assumed to represent selected similar compounds, e.g. propi-onaldehyde as a surrogate for all large aldehydes. Whether a lumping or surrogate approach is used, the choices are not unique, and each method can introduce substantial errors, e.g. mass conservation, differences in the temporal evolution of reactivity, and product yields. Here, we develop and test a surrogate scheme which yields good accuracy for predictions of O3, and is relatively simple to implement in 3-D models.
Primary species were grouped by their structure and reac-tivity with OH, as shown in Table 4. Each group is repre-sented in the reduced scheme by a single surrogate species from that group. Molecules were assigned to their group sur-rogate based on the following criteria:
1. The usual classification of the primary species as alkane, alkene, aromatic, aldehyde or ester. This group-ing accounts for major differences in the initial reaction pathways (OH and NO3abstraction or addition, O3
ad-dition, photolysis) and therefore also in the nature of secondary products.
2. The presence of neo or iso structure of the molecule. Iso structures, but not neo structures, are potentially strong sources of acetone, which may have a special signifi-cance in free tropospheric radical budgets (e.g. Jaegle et al., 2001).
3. Grouping of rate constants with OH falling within a factor of 2, with rate constant thresholds (see Table 4) taken from Middleton et al. (1990). This criterion dif-fers from others mainly in that only this coarse OH reac-tivity grouping is used, and no additional OH reacreac-tivity weighting is performed within a group. In-group reac-tivity weighting, e.g. as used by SAPRC99, RACM, in-troduces significant complications because the reaction kinetics and branching ratios must be adapted to each case (e.g. domain or length of simulation). The coarse grouping used here has the advantage that the chemistry (kinetics and branching ratios) of the species used as surrogate is fixed and does not depend on the burdens of the primary pollutants. It is unclear a priori whether the advantages of detailed weighting methods outweigh the
simplicity of our approach which uses a fixed chemical scheme. However, comparisons between the reduced and full scheme (see below) seem to justify our simpler approach.
4. For alkanes and aromatics, the mass of carbon is con-served by multiplying the emission of the real species by the ratio of the number of carbons in the real species to that in the surrogate species. An important issue in representing hydrocarbons is the number of potential NO to NO2conversions that can occur. For example for
alkanes, this is equal to the number of C-C+C-H bonds (e.g. Jenkin et al., 2002). Thus, conservation of carbon also partly ensures the correct number of NO→NO2
conversions.
5. For alkenes, esters, and aldehydes, the reactivity mainly comes from those functional groups. For these reasons, the number of emitted functional groups is conserved and any surplus of carbon is added to butane emissions. 6. Species containing 2 or 3 carbon atoms have low reac-tivity and the description of their chemistry does not re-quire many species. Therefore no surrogates were used for these species.
The assignment to surrogate species was performed man-ually for the 64 primary species selected for this study. Nev-ertheless, the procedure described above follows systematic rules which can readily be implemented into a computer al-gorithm to provide, for example, an interface between emis-sion inventories and the chemical scheme.
It should be noted that the species used as surrogates no longer have any physical meaning and must rather be seen has virtual entities (i.e. a parameter of the model) for which a straight comparison with measurement might be meaning-less. It would however still be appropriate to compare the modelled concentration of a surrogate with the measured sum of the explicit species that it represents. The number of species and reactions following this reduction is presented Fig. 1.
4.4 Surrogates for secondary VOC
A final reduction was achieved by replacing many secondary VOCs by fewer surrogate VOCs having similar reactivities. Compared to the primary VOCs discussed in the previous section, the selection of surrogates for secondary VOCs is more complex because of the presence of various functional groups (e.g. -OH for alcohols, -ONO2for nitrates, etc.), often
more than one per molecule. Our strategy was to retain the most reactive functional groups and to conserve carbon, both of which lend themselves to automated algorithms and thus did not require manual treatment. Other approaches are also possible and could be easily automated if based on consistent rules. Note that surrogate species are only used here for C>3
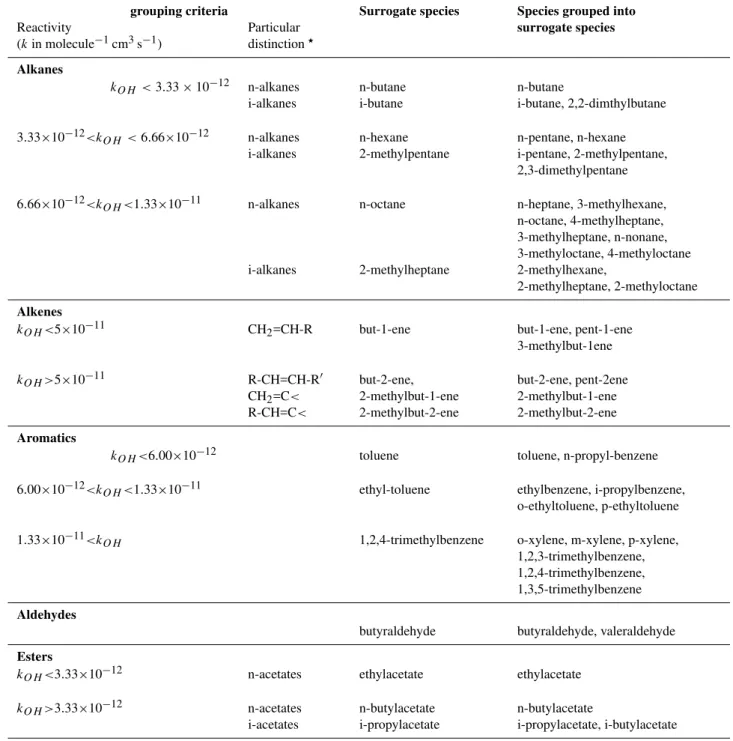
Table 4.Primary species grouping: on the left, grouping criteria for each species family (kinetic rates and structural particularities), on the right, the retained surrogate species and the species grouped into these surrogate species.
grouping criteria Surrogate species Species grouped into
Reactivity
(kin molecule−1cm3s−1)
Particular distinction⋆
surrogate species
Alkanes
kOH <3.33×10⁻¹² n-alkanes n-butane n-butane
i-alkanes i-butane i-butane, 2,2-dimthylbutane
3.33×10⁻¹²<kOH<6.66×10⁻¹² n-alkanes n-hexane n-pentane, n-hexane
i-alkanes 2-methylpentane i-pentane, 2-methylpentane, 2,3-dimethylpentane
6.66×10⁻¹²<kOH<1.33×10⁻¹¹ n-alkanes n-octane n-heptane, 3-methylhexane,
n-octane, 4-methylheptane, 3-methylheptane, n-nonane, 3-methyloctane, 4-methyloctane i-alkanes 2-methylheptane 2-methylhexane,
2-methylheptane, 2-methyloctane
Alkenes
kOH<5×10⁻¹¹ CH2=CH-R but-1-ene but-1-ene, pent-1-ene
3-methylbut-1ene
kOH>5×10⁻¹¹ R-CH=CH-R′ but-2-ene, but-2-ene, pent-2ene
CH2=C< 2-methylbut-1-ene 2-methylbut-1-ene R-CH=C< 2-methylbut-2-ene 2-methylbut-2-ene
Aromatics
kOH<6.00×10⁻¹² toluene toluene, n-propyl-benzene
6.00×10⁻¹²<kOH<1.33×10⁻¹¹ ethyl-toluene ethylbenzene, i-propylbenzene,
o-ethyltoluene, p-ethyltoluene
1.33×10⁻¹¹<kOH 1,2,4-trimethylbenzene o-xylene, m-xylene, p-xylene,
1,2,3-trimethylbenzene, 1,2,4-trimethylbenzene, 1,3,5-trimethylbenzene
Aldehydes
butyraldehyde butyraldehyde, valeraldehyde
Esters
kOH<3.33×10⁻¹² n-acetates ethylacetate ethylacetate
kOH>3.33×10⁻¹² n-acetates n-butylacetate n-butylacetate
i-acetates i-propylacetate i-propylacetate, i-butylacetate
⋆for alkanes, distinction between species capable to produce acetone or not
For monofunctional species, a simple surrogate contain-ing the same functional group was used. Methyl ethyl ke-tone (MEK) and 2-hexanone were respectively used for C<6
and C≥6 linear ketones. Similarly, methyl isobutyl ketone
and methyl isopentyl ketone were used for C<6 and C≥6
branched ketones. Propanal was used for higher aldehy-des. The C≤4 nitrates were assigned to 2-propyl nitrate.
For C≥5 nitrates, two different surrogates are used
is represented using a simple counter species but could easily be assigned to a reactive species (e.g. butane). Simulations indicate that this is a small correction.
Multifunctional species were split into several surrogate species, based on pre-specified priorities. For example, the difunctional molecule CH3CH(ONO2)COCH3is replaced by
CH3CH(ONO2)CH3 because priority is given to the nitrate
function conservation, while the excess carbon is assigned to MEK, using an artificial stoichiometric coefficient of 0.25 to ensure carbon conservation. However, functional groups were not split for some multifunctional molecules whose re-activity depends strongly on the interaction between those functional groups. Thus, higherα-dicarbonyls were replaced by methyl glyoxal or biacetyl (depending on whether they are internal or external carbonyls), and the unsaturatedγ -dicarbonyls stemming from aromatic oxidation were retained explicitly.
A different treatment was applied to alcohols, which are produced in high numbers from the isomerization of long chain alkoxy radicals and the RO2 permutation reactions.
Their reaction with OH leads to the formation of a carbonyl compound and the restitution of a radical species (HO2).
Therefore alcohol functional groups were directly replaced by carbonyl functional groups and an organic alcohol surro-gate having zero carbon mass (noted OPEALC in Appendix A) which converts OH to HO2. The carbonyls were then
assigned to surrogates as described in the preceding para-graphs.
As previously stated for the primary surrogates, the con-centrations of surrogate secondary VOCs cannot be com-pared directly with their measured atmospheric concentra-tions, because they actually represent the sum of many dif-ferent compounds. This limitation is not specific to our ap-proach, but exists for all reduced chemical schemes using lumping or surrogate methods. Still, the sum of organic functionalities may remain meaningful (especially for reser-voir species such as nitrates), as suggested by comparisons between the reduced and more complete reference schemes (Sect. 6). The number of species and reactions of the scheme after these reductions is presented Fig. 1.
5 Results for the various scenarios
Reduction methods were applied successively to the explicit scheme, except that the operators and grouping of primary species were first tested independently before being com-bined. The order of application of the reduction methods and the numbers of species and reactions after each reduc-tion step are presented in Fig. 1. The reduced schemes were then tested by comparison with the reference scheme in a box model for the various conditions previously described.
For each scenario, a preliminary analysis using the ref-erence scheme was first performed to characterize the domi-nant chemistry of the scenario and therefore to identify which
aspects of the reduction methods would be tested by this sce-nario. For example, since VOCs react mainly with OH, the reactivity of the air masses was estimated by computing for all scenarios the termP k(OH+VOC)i×[VOC]i. In the same
way, the contribution of primary, secondary and C1organic
species to the total reactivity were determined. The branch-ing ratios for the reactions of peroxy radicals were also quan-tified to identify the importance of using reductions by the operator method. The main results of this preliminary analy-sis are briefly mentioned hereafter for each scenario and the results of reduction are then presented.
5.1 Polluted area (urban and regional scenarios)
The urban and regional scenarios are characterized by in-tense emissions of ozone precursors. Hence, primary VOC was found to play the main role in the reactivity (80% in the urban scenario and 40% to 80% in the regional scenario for summer and winter conditions respectively). Furthermore, in these scenarios, the organic peroxy radicals react mainly with NO, except for the regional summer conditions in which the RO2+RO2 and RO2+HO2 reactions reach up to about 20%
during the day and 60% during the night (other nightime pathways being about 25% for reaction with NO and 15% with NO3).
Figure 6 shows the simulated diurnal profiles at different reduction levels for O3, NOx and ROx
(CH3O2+HO2+OH+RO2). For the urban scenario (both
summer and winter conditions) ozone and NOx
concen-trations are well reproduced for all reduction levels, with relative errors of 1.4% for O3 and less than 1% for NOx
concentrations. The overall features of ROxconcentrations
are also well reproduced, however with an overestimation of about 10% during the night. For the regional scenarios, good overall agreement is found, but summertime NOx is
overpredicted by up to 5% due to the use of operators. This bias is related to the relatively low NO concentrations (a few hundred ppt) allowing peroxy radical recombination which are treated only approximately in the operator scheme. For both summer and winter conditions, radical concentrations (ROx) show a slight overestimation during the day and
underestimation during the night. The nighttime sources of radicals are the reactions of the VOC with NO3and O3,
and the deviation of radical concentrations is due to the aggregation of primary species. The daytime deviations of radical species are mainly due to the use of operators and, partly, to the aggregation of secondary species, which play a significant role in the organic reactivity with OH (10 to 30%).
0 5 10 15 20 25 30 35 40 45 50 O3 (ppb) 0 10 20 30 40 50 60 70 80 90 100 NOx (ppb) 0.0 0.2 0.4 0.6 0.8 1.0 1.2 1.4 1.6 1.8 2.0 ROx 0 2 4 6 8 10 12 14 16 18 20 0 14 28 42 56 70 84 98 112 126 140 NOx (ppb) 0.00 0.02 0.04 0.06 0.08 0.10 0.12 0.14 0.16 0.18 0.20 0 8 16 24 32 40 48 56 64 72 80 0 1 2 3 4 5 6 7 8 9 10 NOx (ppb) 0 5 10 15 20 25 30 35 40 45 50 0 4 8 12 16 20 24 28 32 36 40 0 2 4 6 8 10 12 14 16 18 20 NOx (ppb) 0 2 4 6 8 10 12 14 16 18 20 Time (h) Explicit scheme Operators
Grouping of primary species SAPRC 99
Operators and grouping of primary and secondary species Operators and grouping of primary species
12 16 20 24
0 4 8
Urban Summer Scenario
12 16 20 24
0 4 8
(ppt)
Urban Winter Scenario
12 16 20 24
0 4 8
ROx (ppt)
12 16 20 24
0 4 8
12 16 20 24
0 4 8
O3 (ppb)
12 16 20 24
0 4 8
Regional Summer Scenario
12 16 20 24
0 4 8
O3 (ppb)
12 16 20 24
0 4 8
ROx (ppt)
12 16 20 24
0 4 8
12 16 20 24
0 4 8
ROx (ppt)
12 16 20 24
0 4 8
O3 (ppb)
12 16 20 24
0 4 8
Regional Winter Scenario
Fig. 6.Ozone, NOxand ROx(CH3O2+HO2+OH+RO2) mixing ratios simulated with the reference explicit and the reduced schemes for the
48 56 64 72 80 88 96 104 112 120 Time (h)
0 50 100 150 200
ozone (ppb)
NOx
48 56 64 72 80 88 96 104 112 120 Time (h)
50 100 150 200 250
NOx (ppb)
OH
48 56 64 72 80 88 96 104 112 120 Time (h)
0 5.0x10⁵
OH (molecule cm
-3)
HO2
48 56 64 72 80 88 96 104 112 120 Time (h)
0 2 4 6 8
HO
2
(ppt)
Ozone
1.0x10⁶ 1.5x10⁶ 2.0x10⁶ 2.5x10⁶
Explicit scheme Operators
Grouping of primary species SAPRC 99
Operators and grouping of primary and secondary species Operators and grouping of primary species
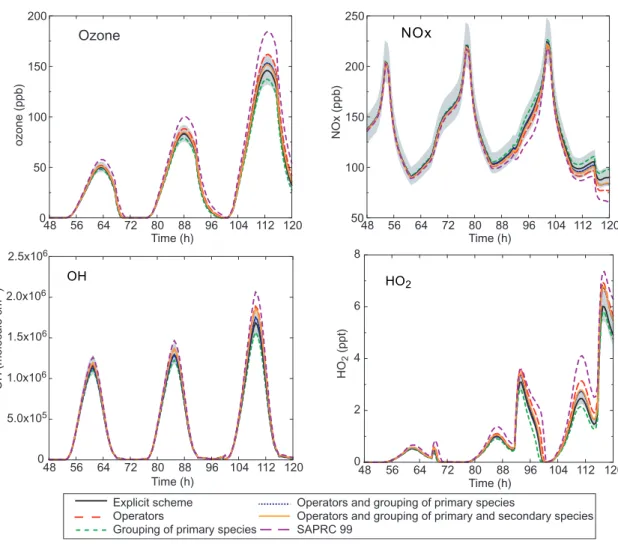
Fig. 7.Ozone, NOxand HO2mixing ratios and OH concentrations simulated with the reference (explicit) and the reduced schemes for the
urban summer scenario, without advection. The pale gray zones represent a deviation of 10% around the explicit scheme results.
are then attenuated, boundary conditions being not modified by them. In order to highlight the errors that may result from the reductions, a simulation in urban conditions was performed without any renewing of the air inside the box (i.e. no advection of air inside and outside the box is consid-ered). This test leads to high ozone and NOxconcentrations
(150–250 ppb). Results are shown Fig. 7 for ozone, NOx, OH
and HO2. As the two first days do not show significant
devia-tions, they are not shown on this picture. Deviations between the different schemes increase substantially in these condi-tions. Ozone production is decreased by aggregating the pri-mary species (−5% and−5.9% for the fourth and fifth days respectively) whereas it is increased by the use of operators (+6.4 and +10.8% for the same peaks). Chemical schemes combining both hypotheses provide the best results (2.4% and 3.7% for the last two peaks) due to error compensation. The OH concentration integrated over the whole last day is overestimated by 9% for the most reduced scheme. NOx
pro-files are also well represented although the concentrations
di-verge slightly at the end of the simulation (6% for the most reduced scheme). This bias is due to the overestimation of OH levels, as NO2consumption is mostly controlled by the
OH+NO2reaction. Finally, the use of operators leads to an
overestimation of HO2concentrations (up to 20% during the
diurnal maximum). Overall, these comparisons show that even for very polluted scenarios (high NOxlevels),
concen-trations computed with reduced schemes are close to those obtained with explicit scheme.
5.2 Free relaxation of air masses in lower tropospheric con-ditions
These scenarios, with neither emission nor advection, are characterized by rapid loss of NOx. After two days, NOx
lev-els are relatively low: a few tens ppt for summer conditions, and less than 3 ppb for winter conditions. These tests are then highly sensitive to the competition between RO2+NO
reactions and RO2+HO2(or R′O2) reactions, and therefore to
secondary VOC chemistry is a major contributor to the total OH reactivity in these scenarios (respectively 30% and 60% for summer and winter cases). These tests thus remain highly sensitive to the reduction of secondary species. We point out that in these scenarios, C1chemistry also plays a major role
in OH reactivity, i.e. growing from 30% to 60% during the 5-days summer simulation but remaining below 20% in the winter scenario.
Results are presented for ozone, NOx and ROxin Fig. 8.
For summer conditions, net ozone destruction occurs af-ter the second day. During the first day, it was found that the RO2+NO reactions contribute on average to about
50% of organic peroxy removal and that the RO2+HO2and
RO2+RO2 reactions account for 40% and 10%,
respec-tively. The second to the fifth days are dominated by the RO2+HO2 and RO2+RO2 reactions (respectively 50% and
20%) and only about 30% of the removal of organic peroxy is due to the reaction with NO. For this scenario, concentra-tions of the inorganic species are relatively well reproduced although accuracy of the reduced schemes decreases slightly with time. However, even after five days, the relative error in ozone concentrations is less than 5% in this scenario. This er-ror is mainly due to the operator reduction (see Fig. 8). The use of operators and the aggregation of secondary species lead to a decrease of NOxconcentrations, with a maximum
bias at the end of the simulation of 8 ppt (20%) with the most reduced scheme. Biases in the daytime concentrations of ROxare less than 5% but concentrations are underestimated
by 10% during the night.
For winter conditions (see Fig. 8), ozone concentrations are affected only slightly by the reductions (bias<3%). Nev-ertheless, NOx concentrations are underestimated by up to
0.26 ppb (i.e. a 33% bias) due to the use of operators. Radical species are underestimated somewhat (up to 10%) by the ag-gregation of the primary species. Operators lead to an over-estimation of radicals (up to 30% during the night but less than 10% for diurnal values).
These tests show that for low NOx conditions, ozone
concentrations are well captured by the reduced chemical schemes. Nevertheless NOx concentrations are biased
to-ward a systematic underestimation due to the use of oper-ators.
5.3 Free relaxation of air masses in free tropospheric con-ditions
The role played by one-carbon species in this scenario does not exceed 25% after 5 days. The impact of the reductions can thus be examined without being masked by the C1
chem-istry. Results for this scenario are presented Fig. 9. The ozone profile is affected only slightly by the reductions. On the other hand, NOxis underestimated significantly by the
reduced schemes (about 40% after 24 h). It is nevertheless important to notice that this bias, which results from the use of operators, does not increase with time after 30 h.
Further-more this error is less than that of SAPRC which increases throughout the simulation (see Fig. 9).
6 Summary of biases due to the reduction methods
Three main methods were automated to decrease the size of chemical schemes describing the VOC oxidation in the tro-posphere: (1) The first one is the grouping of primary species into surrogate species. It does not lead to a significant bias for the key inorganic species (i.e. O3, OH, NOx). This reduction
is then suitable to a wide range of environmental conditions. (2) The second method is the use of chemical operators to represent the contribution of organic peroxy radicals to the NOx and ROx budgets. This reduction induces no
signifi-cant bias for high NOx conditions. However, NOx is
sys-tematically underestimated for low NOxconditions because
of the incomplete representation of the competition between the reaction of peroxy radicals with NO and with other per-oxy radicals. This bias can reach 30% after five days for air masses having no injection of primary species. A bias in radical species is also observed after five days for winter-time free tropospheric conditions. (3) The last reduction is the replacement of secondary species by surrogate species. This reduction does not influence concentrations for polluted conditions which are continuously subjected to fresh VOC emissions. Errors due to this reduction are then limited to situations not subjected to large VOC emission. The impact on ROxand NOxis small for the first three days but reaches
ca. 10% after five days. For winter conditions, the group-ing of secondary species induces an overestimation of ROx,
which compensates the underestimation due to operators. After these reductions, the number of species in the scheme is sufficiently low to be implemented in a 3-D-chemistry transport model. The box model simulations showed that ozone concentrations are simulated well by the reduced scheme, with error (relative to the reference scheme) systematically less than 5% which, for the simulated condi-tions, corresponds to a maximum error of 1.5 ppb.
For every situations considered here, the reduced scheme reproduced the OH integral with less than 4% error, except for urban scenario without advection (10%), but these condi-tions are hardly realistic.
General features of NOxare well reproduced for urban to
continental situations. However, a problem due to an overes-timation of the NOx storage in organic compounds is
high-lighted for long range transport of air masses. Nevertheless, these scenarios may be rather unrealistic because they con-sider air masses without any incorporation of new precursors during 5 days. Errors found here are therefore likely to be upper limits.
Time (h) -5
-4 -3 -2 -1 0 1 2 3 4 20 30 40 50 60 70 80
Relative Deviation
Time (h) -25
-20 -15 -10 -5 0 5 10 15 20 0.1 1
NOx (ppb)
-30 -20 -10 0 10 20 0 10 20 30 40 50 60 70 80
ROx (ppt)
?-5 0 5 10 15 20 20 30 40 50 60
-40 -30 -20 -10 0 0 2 4 6 8 10
-50 -40 -30 -20 -10 0 10 20 30 40 0 5 10 15 20
Relaxation of an old continental air mass in summer conditions
O3 (ppb)
Relative Deviation
0 24 48 72 96 120 0 24 48 72 96 120
Relative Deviation
0 24 48 72 96 120
0.01
Time (h)
Relaxation of an old continental air mass in winter conditions
Relative Deviation
O3 (ppb) NOx (ppb)
0 24 48 72 96 120
Relative Deviation
Time (h)
0 24 48 72 96 120
Time (h)
Relative Deviation
ROx (ppt)
0 24 48 72 96 120
Time (h)
Explicit scheme Operators
Grouping of primary species SAPRC 99
Operators and grouping of primary and secondary species Operators and grouping of primary species
Fig. 8. Ozone, NOxand ROx (CH3O2+HO2+OH+RO2) mixing ratios simulated with the reference explicit scheme for the relaxation
Time (h) -5
-4 -3 -2 -1 0 1 2 3 4 8.0x10¹¹ 8.5x10¹¹ 9.0x10¹¹ 9.5x10¹¹ 1.0x10¹²
O3 (molecule cm-3)
Relative Deviation
Time (h) -70
-60 -50 -40 -30 -20 -10 0 108 109 1010 1011
NOx (molecule cm-3)
Time (h) -20
-15 -10 -5 0 5 1x10⁸ 2x10⁸ 3x10⁸ 4x10⁸ 5x10⁸ 6x10⁸
0 24 48 72 96 120 0 24 48 72 96 120
Relative Deviation
0 24 48 72 96 120
Relative Deviation
ROx (molecule cm-3)
Explicit scheme Operators
Grouping of primary species SAPRC 99
Operators and grouping of primary and secondary species Operators and grouping of primary species
Fig. 9. Ozone, NOxet ROx(CH3O2+HO2+OH+RO2) concentrations simulated with the reference scheme for the relaxation scenarios at
5 km, and relative deviation of the reduced scheme with respect to that reference. The pale gray zones represent a deviation of 5% around the explicit scheme.
by 0.3 to 11% with respect to the reference scheme. For the free relaxation air masses, acetone concentrations increase during the whole simulation. In these scenarios, acetone pro-duction in the most reduced scheme is underestimated by 20 to 30%.
H2O2is one of the main oxidants in the aqueous phase.
The good simulation of its concentrations is directly linked to the good representation of the HO2chemistry. H2O2
con-centration is estimated with less than 10% of error.
Nitric acid is involved in the aerosol production and is scavenged by water droplets resulting in acidification of clouds and fogs. A good simulation of its concentration shows evidence of a good representation of the chemistry of OH and NO2. Biases on this species never exceed 6%.
Regarding the organic functions (aldehydes, ketones, PAN, nitrates, alcohols, carboxylic acids), a fairly good agreement is found between explicit and reduced chemical schemes with a difference of less than 10% for highly pol-luted scenarios. For moderately polpol-luted scenarios, organic functionalities are reproduced with a bias of less than 10% except nitrates in summer (up to 15% deviation), alcohols in winter (up to 50% deviation), ketones in winter (up to 25% deviation) and carboxylic acids in winter (up to 20% devia-tion). Note that the fairly good results in simulating PAN and nitrates are of particular interest here since these species are
key reservoir compounds transporting NOxfrom polluted to
remote areas. For the scenarios representing the free relax-ation of air masses, the differences between the explicit and the reduced scheme never exceed 55% (being systematically lesser than 30% for winter and free tropospheric conditions) for the organic functions.
In summary, all the tests performed so far show a fairly good agreement between the reduced chemical scheme and the reference scheme to reproduce the gaseous chemistry of the system O3/NOx/VOCs.
7 Conclusions