Comparative Analysis of Water Quantity and Quality in Relation to Vegetation
Cover in Himalayan Moist Temperate Forests of Galliyat
Asif Javed
1*, Adnan Saleem Khan
1, Anwar Qadir
3, Salman Khan
2, Salim Shehzad
11
Department of Earth and Environmental Sciences, Bahria University, E-8, Islamabad, Pakistan.
2
Department of Environmental Sciences, University of Haripur, Khyber Pakhtunkhwa, Pakistan.
3
Department of Geology, University of Haripur, Khyber Pakhtunkhwa, Pakistan.
*Email:
[email protected]
Received: 15 May, 2016 Revised: 29 August, 2016
Abstract: The aim of this work was to study the impact of deforestation on water quality and quantity in and around Ayubia National Park-Galliyat, Pakistan. Streams from three vegetation zones (HDZ high density vegetation zones, MDZ moderate density vegetation zones, LDZ low density vegetation zones) were selected for comparative analysis. Altitude, slope and aspects (southern and northern) of three sites were kept constant, whereas deforestation was taken as the only variable. Average discharge rates determined during winter and summer of 2010-11 were found highest for HDZ streams [QBR (0.011 and 0. 1241 m3/sec) and QAR (0.0128 and 0.1287 m3/sec)] followed by MDZ streams [QBR
(0.0106 and 0. 1218 m3/sec) and QAR (0.0126 and 0.1284 m 3
/sec)] and lowest [QBR (0.0045 and 0.0157 m 3
/sec) and QAR
(0.0140 and 0.01284 m3/sec)] for LDZ streams. Similarly, pre- and post-rainfall variations in discharge rates were recorded the highest in LDZ (0.06 m3/sec), moderate in MDZ (0.0045 m3/sec) and the lowest in HDZ (0.0032 m3/sec). Analysis of variance for water quality parameters (pH, NO2, NO3) revealed insignificant variations in relation to
vegetation cover, whereas significant variations in alkalinity, total dissolved solids, conductivity and hardness were observed. In the light of these results, we concluded that the vegetation cover has close correlation with water and deforestation has significantly influenced water quantity and quality in the study area.
Keywords: Deforestation, water quantity, water quality, vegetation zone, watershed, moist temperate forests.
Introduction
Forests play pivotal role in maintenance of ecosystem functions and ensure regular supplies of quality water. Their importance is characterized by a large number of economic, social and ecological services like conservation of soil, water, biodiversity, carbon storage and enhancement of agricultural production systems (Aylward, 2000; Costa et al., 2003; Godoy et al., 2000). More than half of the global fresh water comes from mountains hence mountain forests have a major influence on water quality and quantity (Mikkelson et al., 2013). Forests maintain high water quality, through stabilization of soil, minimizing erosion and hence decrease the disturbances in water quality owing to sedimentation. Forest cover protects water courses by catching sediments and impurities from upstream land use activities. A total of 9.17 million hectare (Mha) of forests have been declared protected for water and soil conservation in Pakistan (Abbas et al., 2011).
Watersheds covered by thick forests maintain good quality of water compared to other land uses like agriculture and settlements etc. are likely to add to the huge amounts of pollutants towards headwaters (Aylward, 2000; Labrière et al., 2015). Many research reports have revealed positive correlation between forest management and water quality (de Souza et al., 2013, Farley et.al., 2005). Water to major and smaller
rivers as well as lakes and glaciers is from mountains. However, the pivotal role of the mountain catchment areas has been endangered by land use and cover changes globally. In the mountain areas of developing countries, deforestation and forest degradation are fast, due to swift population growth, increased poverty and low per capita land availability.
Suitable quantity of water and appropriate soil characters are responsible for sustenance of vegetation and hydrological cycle balance. The prime function of forest cover is to store rain water and further control/regulate its discharge to streams and springs (Räder-Roitzsch, 1968). Data analysis revealed that deforestation leads to lessen evapo-transpiration rates, which eventually contribute to reduction in rainfall rates in the watershed over longer temporal scales (Steffen et al., 2005). Land cover and land use changes due to deforestation have significant influence on the evapo-transpiration, infiltration and surface runoff characters of a watershed as evident from data that following deforestation, 50% increase in stream discharge rates has been observed (Gutman, 2004). Vegetation cover has significant influence over soil infiltration capacity as debris and humus layer lessen surface runoff, enhances precipitation interception and further maintenance of scrap or aggregated structure responsible for high infiltration rates (Räder-Roitzsch, 1968). Forests also play a role in water availability. They influence the amount of available water by
ISSN: 2223-957X www.econ-environ-geol.org
intercepting precipitation, evaporating moisture from vegetative surfaces, transpiring soil moisture, capturing fog water and maintaining soil infiltration. At the same time, forests may influence the timing of water delivery by maintaining and improving soil infiltration and the soil's water-storage capacity. It was observed that streams covered by thick forests have low surface runoff compared to deforested sites. Increased surface run off due to deforestation causes flooding. Deforestation also results in reduced evapo-transpiration that further lessens moisture contents in atmosphere and hence alters rainfall levels downward (Irshad and Khan, 2012). A land change model used to predict response in Scotland found a 28-30% reduction in water yield following 100% reforestation of the watershed (Eeles and Blackie, 1993; Beven, 2011) stated that forest regeneration following logging and
natural fire in Melbourne, Australia’s water supply
catchment resulted in a 50% reduction in water yield, with peak reduction occurring 25 years after the land change event had occurred.
Forests are important in the Himalayan foothills for
catchment’s protection (Shinwari, 2010). The forest resources are under pressure from deforestation and subsequent land degradation (Ali and Benjaminsen, 2004) which in addition to other adverse impacts have severely impaired water quality and quantity of critical watersheds. This study aims to critically analyze water quality and quantity of the study area in relation to vegetation cover to trace variations in water due to deforestation.
Methodology
The study area (Galliyat) lies between 33°-35° N latitude and 73-74o E longitudes, in Abbottabad district of Hazara Division, KPK (Fig.1). Galliyat is highly mountainous track with altitude between 7000-9500 feet. In general the climate of the area is pleasant to extreme cold type in different months of the year. The area receives major part of rainfall during monsoon i.e. from June to middle of September (Irshad and Khan, 2012). Being located in the western Himalayan moist-temperate region, it consists of fairly dense forests of conifers, mixed with broad leaved trees and a mixture of luxuriant shrubs and herbs (Fawad et al., 2013). Relevant reports/papers of national and international research organizations and journals were reviewed regarding the study area, data collection and analysis tools and techniques applied and results obtained (Ali and Benjaminsen, 2004; Jamal and Khadija, 2009; Labrière et al., 2015). Secondary data regarding rainfall and vegetation types of the study area was
obtained from meteorological and forest department. Based on literature review (Association, A. P. H. 1995; Gutman, 2004; Labrière et al., 2015), detailed sketch of research methodology was designed and whole area was divided into three zones based on vegetation cover.
Area zoning
The area was divided into three zones, Ayubia National Park, complete protected zone, as High
Density Zone (HDZ), Reserve forest, partially protected zone as Medium Density Zone (MDZ) and Guzara Forest, un-protected zone, as Low Density Zone (LDZ) (Fig.1). To ensure greater degree of precision in results, parameters including altitude, climate, temperature and slope were kept constant for all three zones and deforestation was taken as the only variable for comparative analysis.
Water quantity determination
A total of 06 streams (02 from each vegetation zone) were identified and selected for determination of water
discharge rate. Manning’s Equation was used for
determining the change in quantity of water contributed by each stream and spring before and after Rain (Chanson, 2004) as:
Q = CAI {(HR0.67 X S0.5) / n} Where: Q = Quantity of water in cm3 / sec CAI= Cross Sectional Area in cm2 HR = Hydraulic Radius in cm S = Slope in %age
n = Manning’s roughness coefficient and
HR = CAI/WP = Cross Sectional Area / Wetted
perimeter
To determine the discharge rate of springs, time was calculated through stopwatch for the filling of known volume (1.5 liter) of bottle.
Procedure adopted
From each vegetation zone namely HDZ, MDZ and LDZ two streams were selected. Discharge rates were determined both in summer and winter. Normally in winter (October, November, December, January,
February and March), the area is snow covered and in summer (April, May, June, July, August and September) melting of snow and rainfall in the study area begin. Data were collected both in summer and winter seasons 2010 and 2011.
Water quality determination
Prior to start of present research work in Galliyat, information about the catchment characteristic (rock and soil types, gradient, average flow etc) of streams of three vegetation zones were collected. Sample collection points were identified and selected from each vegetation zone.
Sampling size and procedure
Four water samples from each vegetation zone were collected four times per year (March, July, October and December) in 2010 -11 to avoid vagueness in data due to seasonal fluctuation. Overall samples collected and analyzed were 96 (48 in 2010 and 48 in 2011). Polyethylene bottles were used for taking sample. All bottles were labeled and washed with distilled water
and respective stream’s water. Grab samples were
taken from the middle point of stream according to standard methods (Association, A.P.H., 1995). All bottles were sealed soon after sample collection to
avoid water contact with air. Parameters analyzed
Parameters like conductivity, taste, color, odor, pH and TDS were analyzed in the field using potable conductivity meter, whereas nitrate, nitrite and alkalinity were analyzed according to standard methods for determining water quality and tracing changes in relation to vegetation cover. The results of samples analyzed were then compared with the standard values of WHO (World Health Organization)
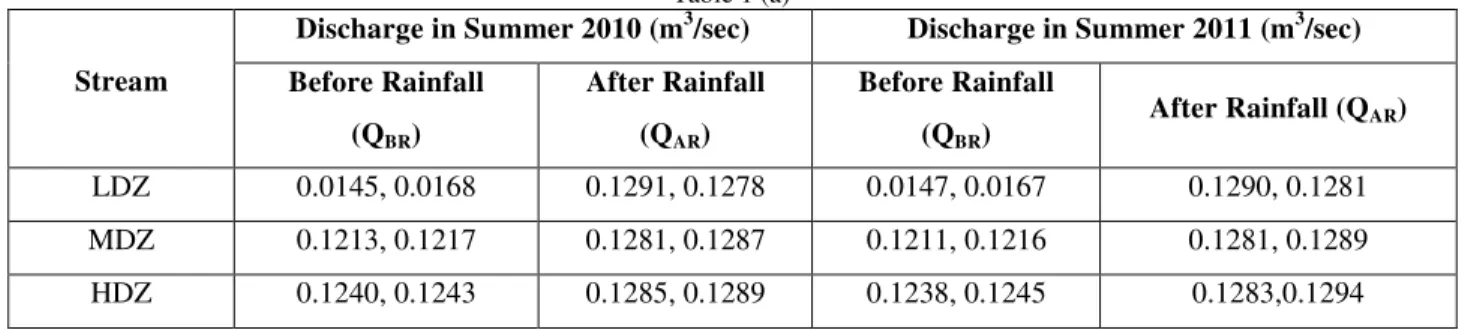
Table 1 (a)
Stream
Discharge in Summer 2010 (m3/sec) Discharge in Summer 2011 (m3/sec)
Before Rainfall
(QBR)
After Rainfall
(QAR)
Before Rainfall
(QBR)
After Rainfall (QAR)
LDZ 0.0145, 0.0168 0.1291, 0.1278 0.0147, 0.0167 0.1290, 0.1281
MDZ 0.1213, 0.1217 0.1281, 0.1287 0.1211, 0.1216 0.1281, 0.1289
HDZ 0.1240, 0.1243 0.1285, 0.1289 0.1238, 0.1245 0.1283,0.1294
HDZ = High Density Zone, MDZ = Medium Density Zone, LDZ = Low Density Zone
Table 1 (b)
Stream
Discharge in Winter 2010 ( m3/sec) Discharge in Winter 2011 ( m3/sec)
Before Rainfall (QBR) After Rainfall (QAR)
Before Rainfall (QBR)
After Rainfall (QAR)
LDZ 0.0045, 0.0051 0.0108, 0.0155 0.0042, 0.0048 0.0147, 0.0152
MDZ 0.0108, 0.0105 0.0127, 0.0122 0.0109, 0.0105 0.0130, 0.0122
HDZ 0.0119, 0.0112 0.0132, 0.0126 0.0117, 0.0112 0.0131, 0.0126
for drinking water quality.
Results and Discussion
Water quantity in relation to vegetation cover
Summer (2010-11)
Table 1 and Figure 2 provide the average discharge rate of various streams in relation to vegetation cover,
whereas Table 2 provides the details of water quality parameters in relation to vegetation cover.
Table 1 Stream discharge data of three vegetation zones during (a) summer and (b) winter seasons 2010 and 2011. Winter (2010-11)
Data analysis concerning winter discharge rates of streams under different vegetation cover is shown in Table 1(b). Data show that streams of HDZ (Abshar
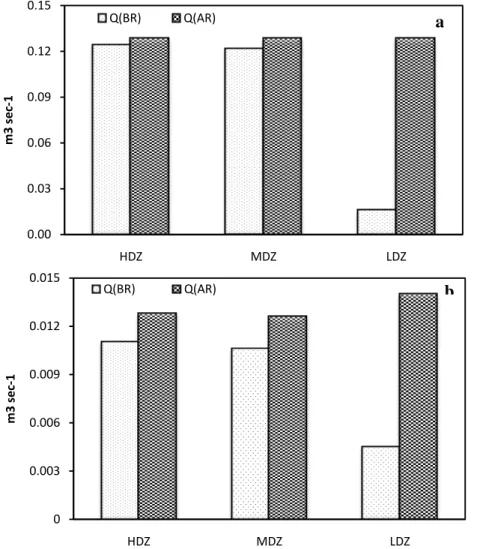
Fig. 2 Average discharge rate of various streams in relation to vegetation cover. a) Summer 2010-11, b) Winter 2010-11. HDZ = High Density Zone, MDZ = Medium Density Zone, LDZ = Low Density Zone
Table 2 Water quality parameters in relation to vegetation cover.
Discharge rates of Abshar and Khurd streams (HDZ) determined during summer were 0.1240 m3/sec, 0.1243 m3/ (2010) and 0.1238 m3/sec, 0.1245 m3/sec (2011) before rainfall (QBR), whereas 0.1285 m3/sec, 0.1289 m3/sec (2010) and 0.1283, 0.1294
m3/sec (2011) after rainfall (QAR). Streams of MDZ (Namlimera and Chotamera) had QBR 0.1213 m 3
/sec, 0.1217 m3/sec (2010) and 0.1211 m3/sec, 0.1216 m3/sec (2011) whereas QAR were 0.1281 m3/sec, 0.1287 m3/sec (2010) and 0.1281 m3/sec, 0.1289
m3/sec (2011). QBR of LDZ streams (Kundla and Dongagali) determined were 0.0145 m 3
/sec, 0.0168 m3/sec (2010) and 0.0147 m3/sec, 0.0167 m3/sec (2011), whereas QAR were 0.1291 m3/sec, 0.1278 m3/sec (2010) and 0.1290 m3/sec, 0.1281 (2011).
Average QBR and QAR of HDZ were 0.1241 m 3
/sec and 0.1287 m3/sec, MDZ 0.1214 m3/sec and 0.1284 m3/sec and LDZ 0.0157 m3/sec and 0.1284 m3/sec before and after rainfall during summer 2010-11 (Fig. 3).
0.00 0.03 0.06 0.09 0.12 0.15
HDZ MDZ LDZ
m3
s
e
c
-1
Q(BR) Q(AR)
a
0 0.003 0.006 0.009 0.012 0.015
HDZ MDZ LDZ
m3
se
c
-1
Q(BR) Q(AR)
b
Vegetation Density Conductivity TDS Alkalinity Hardness
(µs cm-1) (mg L-1) (mg L-1) (mg L-1)
HDZ 57.0 233.0 67.0 71.5
MDZ 72.0 450.0 81.0 111.5
and Khurd) had QBR 0.0119 m3/sec, 0.0112 m3/sec
(2010) and 0.0117 m3/sec, 0.0112 m3/sec (2011) whereas 0.0132 m3/sec, 0.0126 m3/sec (2010) and 0.0131 m3/sec, 0.0126 m3/sec (2011) QAR. Similarly
QBR of MDZ (Namlimera and Chota mera) streams
determined were 0.0108 m3/sec, 0.0105 m3/sec (2010) and 0.0109 m3/sec, 0.0105 m3/sec (2011) whereas QAR
0.0127 m3/sec, 0.0122 m3/sec (2010) and 0.0130 m3/sec, 0.0122 m3/sec (2011). QBR of LDZ streams
(Kundla and Dongagali) determined were 0.0045 m3/sec, 0.0051 m3/sec (2010) and 0.0042 m3/sec, 0.0048 m3/sec (2011), whereas QAR 0.0108 m3/sec,
0.0155 m3/sec (2010) and 0.0147 m3/sec, 0.0152 m3/sec (2011). Average discharge rates (QBR and QAR)
of HDZ, MDZ and LDZ streams were 0.011 m3/sec and 0.0128 m3/sec, 0.0106 m3/sec and 0.0126 m3/sec, 0.0045 m3/sec and 0.014 m3/sec during winter 2010-11.
Effect of vegetation cover on water discharge rates
Land use changes significantly influence surface run off (Harbor, 1994). Analysis of variance at 0.05 significant level revealed F=171.4 and Sig=0.001(QBR)
and F=22.8 and Sig=0.015 (QBR), entails mean
difference in discharge rates in relation to vegetation as significant streams of HDZ due to its dense vegetation cover have thick canopy, high interception rate, and high infiltration rate had highest water discharge rates compared to MDZ and LDZ. Through sub-surface pathway, rain water slowly and gradually moves to streams and spring during rainy season and ensures sustained flow of water throughout the year. Similarly pre and post rainfall variations in discharge rates were
found highest in LDZ followed by MDZ and lowest in HDZ (Fig. 3). It was observed that vegetation not only sustains water flow but also controls peak flow and prolonged base flow before and after rainfall. In winter season, rainfall in the project area is low and it was revealed that streams of dense and moderate vegetation have ensured sustained water flow, whereas streams of low vegetation remained dry during December and January. Farley et al. (2005) stated that one determinant of the water yield of a drainage basin is the amount and type of vegetative land cover. Costa et al. (2003) studied that large scale land use changes induced significant variations in discharge rates of Tocantins River, Southeastern Amazonia.
Effect of replications
Discharge rates did not show significant differences in relation to 2010 and 11. Though, slight variations in
data were observed but it was consistent for all the vegetation zones. Statistical analysis through F-test at the 0.05 level revealed F=0.153 and Sig=0.705 before rainfall and F=0.000 and Sig=0.998 (summer, 2010-11), whereas F=0.002 and Sig=0.965 before rainfall and F=0.003 and Sig=0.960 (winter, 2010-11) entails no difference in discharge rates in relation to year wise analysis. We can infer that differences in discharge rates were due to vegetation cover not due to years. Water quality in relation to vegetation cover
The mean values for various water quality parameters determined during 2010-11 were: pH (7.15, 7.1 and 7.2), NO3 (1.5.mg/l, 1.4 mg/l and 1.05 mg/l), NO2
(0.0085, 0.021 and 0.002 mg/l), alkalinity (89.5, 108 Fig. 3Average pre- and post-rainfall variations in discharge rates of streams (summer and winter, 2010-11). HDZ =
High Density Zone, MDZ = Medium Density Zone, LDZ = Low Density Zone.
0.0032 0.0045
0.06
0.00
0.02
0.04
0.06
0.08
HDZ
MDZ
LDZ
m
3
se
c
and 185.5 mg/l), TDS (233, 469 and 620 mg/l),
conductivity (57 μs/cm, 72 μs/cm and 94 μs/cm),
hardness (71.5, 111.5 and 341 mg/l) for HDZ, MDZ and LDZ respectively. Turbidity of various water samples under different vegetation zones analyzed were found clear. Sediment yield determined in water of various streams of HDZ, MDZ and LDZ were 82 mg/l, 98 mg/l and 182 mg/l respectively (Fig. 4). Irshad and Khan (2012) determined a closed correlation between water quality and vegetation cover and revealed significant variation in water quality in relation to different land use practices. Analysis of variance at 0.05 significant level for parameters like pH, NO3, NO2 did not yield any significant difference
in values (F=.600 and Sig=.604, F= 1.799 and Sig=0.307, F=0.898 and Sig=.594) in relation to different vegetation zones. Except LDZ (155mg/l) alkalinity values of HDZ (98.5 mg/l) and MDZ (108 mg/l) water samples were within WHO standards (150 mg/l). ANOVA test at 0.05 significant level showed significant difference (F=1.784 and Sig=0.000) for alkalinity of three vegetation zones. The alkalinity correlation with vegetation cover revealed R2=0.65. Conductivity is a non-specific parameter used for establishing pollution zone (Muhammad, 1991). Mean electrical conductivity of various samples analyzed were within permissible limit of WHO water quality standards (Frisbie et al., 2012). Though within permissible range yet showed significant (F=58.5 and Sig=0.004) difference in values in relation to vegetation.
Total dissolved solids determined in water samples of HDZ, MDZ and LDZ streams demonstrated significant variations. Analysis of variance at 0.05 significant level revealed F=262 and Sig=0.000. Z-1 and Z-II Sig=0.001 whereas Z-I and Z-III Sig=0.000. Correlation of TDS with vegetation cover (R2 = 0.976) which reveals that presence of dissolved solids in water samples of three vegetation zones is 97.6 % correlated with vegetation cover. Major factors which bring up soil erosion are: nature of the soil (loose type), nature of the land (slopping land), lack of vegetation cover, rainfall and wind velocity (Steffen et al., 2005).
Hardness of stream water increases with land cover changes (Steffen et al., 2005; Irshad and Khan, 2012) . Hardness values were observed high for streams covered by low vegetation cover (Jamal and Khadija, 2009). Sediment yield in water streams increases with deforestation, which ultimately increases hardness. According to Sawyer (1960) criteria for water categorization [(0-75 mg/l) soft water, (75-150 mg/l), moderately hard, (150-300 mg/l) hard and (300 mg/l and above) as very hard], the water of HDZ (71.5 mg/l) was found soft, MDZ (111.5 mg/l) as moderately hard and LDZ (341 mg/l) as hard. ANOVA at 0.05 significant level revealed F=107.8 and Sig=0.002, entails mean difference as significant. As evident from graph above R2=0.767 which entails data with regard to hardness of various streams are 76.6% correlated with vegetation cover. It could be safely inferred in light of water samples of different vegetation analyzed
Fig. 4Sediment yield in water streams with respect to vegetation cover. HDZ = High Density Zone, MDZ = Medium Density Zone, LDZ = Low Density Zone.
0
40
80
120
160
200
HDZ
MDZ
LDZ
m
g
L
that hardness increases with decrease in vegetation cover.
Turbidity analysis in relation to vegetation cover did not reveal any changes and were found clear. Mean difference in sediment yield under different vegetation zones as significant (F = 4.423 and Sig = 0.031). R2= 0.834 entails sediment yield and vegetation correlation as 83.4%. It infers that sediment yield in water of various streams under different vegetation categories are strongly correlated. Decrease in vegetation cover results in increased sediment yield in water. There is a close relationship between hydraulic erosion and vegetation cover. Zone covered with thick vegetation have high rain interception so as high infiltration rates and supply of water to streams are sustained thereby reducing the chances of hydrologic erosion. Conversely, low vegetation have low rain interception as infiltration rates, run off remains high and chances of hydraulic erosion are more compared to thick vegetation zones .
Conclusion
The study concludes that vegetation cover significantly influences water quantity (P<0.05) and quality. Watersheds covered by thick vegetation have highest discharge rate, low pre- and post-rainfall variations in discharge and sustained flow of water round the years compared to moderate and low density vegetation zones. Most of the water quality parameters were within WHO drinking water quality parameters, however exhibited significant variations in relation to vegetation cover. There is high possibility that if deforestation trends persisted with same rate, then water quality is likely to be deteriorated in the near future. There is urgent need to address deforestation issue in order to have sustainable supply of good quality water.
References
Abbas, S., Qamer, F., Hussain, N., Saleem, R., Nitin, K. (2011). National level assessment of mangrove forest cover in Pakistan. Workshop Proceedings: Earth Observation for Terrestrial Ecosystem, 187-192.
Ali, J., Benjaminsen, T. A. (2004). Fuelwood, timber and deforestation in the Himalayas: the case of Basho Valley, Baltistan region, Pakistan. Mountain Research and Development, 24, 312-318.
Association, A. P. H. (1995). Water Environment Federation. Standard methods for the examination of water and waste water, 19p.
Aylward, B. (2000). Economic analysis of land-use change in a watershed context. a UNESCO symposium/workshop on forest-water-people in the humid tropics, 1-24.
Beven, K. J. (2011). Rainfall-runoff modelling: the primer. John Wiley & Sons, 449p.
Chanson, H. (2004). Hydraulics of open channel flow. Butterworth-Heinemann, 579p.
Costa, M. H., Botta, A., Cardille, J. A. (2003). Effects of large-scale changes in land cover on the discharge of the Tocantins River, Southeastern Amazonia. Journal of Hydrology,283, 206-217. Eeles, C., Blackie, J. (1993). Land-use changes in the
Balquhidder catchments simulated by a daily streamflow model. J. of Hydrology, 145, 315-336.
Farley, K. A., Jobbágy, E. G., Jackson, R. B. (2005). Effects of afforestation on water yield: a global synthesis with implications for policy. Global Change Biology,11, 1565-1576.
Fawad, M., Shah, W., Khan. S., Khan, A., Zia, M., Irshad, S., Aurangzeb, N. (2013). Impacts of land cover changes on soil physical properties in Galliyat, Pakistan. Int. J. of Recent Scientific Research, 4, 216 -220.
Frisbie, S. H., Mitchell, E. J., Dustin, H., Maynard, D. M., Sarkar, B. (2012). World Health Organization discontinues its drinking-water guideline for manganese. Environmental Health Perspectives,120, 775.
Godoy, R., Wilkie, D., Overman, H., Cubas, A., Cubas, G., Demmer, J., McSweeney, K., Brokaw, N. (2000). Valuation of consumption and sale of forest goods from a Central American rain forest. Nature,406, 62-63.
Gutman, G., Janetos, A. C., Justice, C. O., Moran, E. F., Mustard, J. F., Rindfuss, R. R., Skole, D., Turner, B. L., Cochrane, M. A. (2004). Land Change Science: Observing, monitoring and understanding trajectories of change on the earth's surface. Kluwer Academic Publishers, 449p. Harbor, J. (1994). A Practical method for estimating
the impact of land-use change on surface runoff, groundwater recharge and wetland hydrology. J. of the American Planning Association,60, 95-108. Irshad, S., Khan, S. (2012). Impacts of protection on water quality, quantity and soil of Himalayan moist temperate forests of Galliyat. Sci., Tech. Dev.,31, 91-98.
Jamal, S. Khadija. (2009). Watershed issues assessment in Galliyat. M.Sc. thesis, Hazara University, Pakistan.
Agriculture, Ecosystems & Environment, 203, 127-139.
Mikkelson, K. M., Dickenson, E. R., Maxwell, R. M., McCray, J. E., Sharp, J. O. (2013). Water-quality impacts from climate-induced forest die-off. Nature Climate Change, 3, 218-222.
Muhammad, A. (1991). Ecology of Muree Vole, Hyperacrius Wynnei Blandford, in Galliat, Hazara, Pakistan. University of Peshawar, Peshawar.
Räder-Roitzsch, J. (1968). Watershed Management: An abstract of lectures held at the Pakistan forest college, Peshawar. Pakistan Forest Institute, Pakistan, 241p.
Sawyer, C. N. (1960). Chemistry for sanitary engineers, McGraw-Hill, 518p.
Shinwari, Z. K. (2010). Medicinal plants research in Pakistan. J. of medicinal plant research, 4, 161-176.
De’Souza, A. L., Fonseca, D. G., Libório, R. A., Tanaka, M.O. (2013). Influence of riparian vegetation and forest structure on the water quality of rural low-order streams in SE Brazil. Forest Ecology and Management, 298, 12-18. Steffen, W., Gordon, L. J., Falkenmark, M., Jönsson,