ACPD
5, 1–16, 2005Particle formation by ozonolysis of plant
volatiles
J. Joutsensaari et al.
Title Page
Abstract Introduction
Conclusions References
Tables Figures
◭ ◮
◭ ◮
Back Close
Full Screen / Esc
Print Version Interactive Discussion
EGU Atmos. Chem. Phys. Discuss., 5, 1–16, 2005
www.atmos-chem-phys.org/acpd/5/1/ SRef-ID: 1680-7375/acpd/2005-5-1 European Geosciences Union
Atmospheric Chemistry and Physics Discussions
Nanoparticle formation by ozonolysis of
inducible plant volatiles
J. Joutsensaari1, M. Loivam ¨aki2,3, T. Vuorinen2, P. Miettinen1, A.-M. Nerg2, J. K. Holopainen2, and A. Laaksonen1
1
Department of Applied Physics, University of Kuopio, P.O. Box 1627, FIN-70211 Kuopio, Finland
2
Department of Ecology and Environmental Science, University of Kuopio, P.O. Box 1627, Kuopio FIN-70211, Finland
3
Institute for Meteorology and Climate Research – Atmospheric Environmental Research (IMK-IFU), Kreuzeckbahnstrasse 19, 82467 Garmisch-Partenkirchen, Germany
Received: 25 November 2004 – Accepted: 14 December 2004 – Published: 10 January 2005 Correspondence to: J. Joutsensaari (jorma.joutsensaari@uku.fi)
ACPD
5, 1–16, 2005Particle formation by ozonolysis of plant
volatiles
J. Joutsensaari et al.
Title Page
Abstract Introduction
Conclusions References
Tables Figures
◭ ◮
◭ ◮
Back Close
Full Screen / Esc
Print Version Interactive Discussion
EGU
Abstract
We present the first laboratory experiments of aerosol formation from oxidation of volatile organic species emitted by living plants, a process which for half a century has been known to take place in the atmosphere. We have treated white cabbage crops with methyl jasmonate in order to induce the production of monoterpenes and
5
certain less-volatile sesqui- and homoterpenes. Ozone was introduced into the growth chamber in which the crops were placed, and the subsequent aerosol formation and growth of aerosols were monitored by measuring the particle size distributions contin-uously during the experiments. Our observations show similar particle formation rates as in the atmosphere but much higher growth rates. The results indicate that the
con-10
centrations of nonvolatile oxidation products of plant released precursors needed to in-duce the nucleation are roughly an order-of-magnitude higher than their concentrations during atmospheric nucleation events. Our results therefore suggest that atmospheric nucleation events proceed via condensation of oxidized organics on pre-existing molec-ular clusters rather than via their homogeneous or ion-induced nucleation.
15
1. Introduction
The largest uncertainties in forward calculations of warming of the atmosphere due to greenhouse gases are related to our limited knowledge of negative solar radiative forc-ing associated with aerosols (Anderson et al.,2003). Formation of secondary organic aerosols (SOA), i.e., particle production from volatile organic compounds (VOCs) by
20
chemical reactions, is one of the main processes that affect the composition and prop-erties of atmospheric particles. Recent estimates on the importance of SOA formation show that it may be significant when compared to the primary organic aerosol emis-sions: about 60% of the organic aerosol mass is SOA on the global scale and regionally even more (Kanakidou et al.,2004).
25
atmo-ACPD
5, 1–16, 2005Particle formation by ozonolysis of plant
volatiles
J. Joutsensaari et al.
Title Page
Abstract Introduction
Conclusions References
Tables Figures
◭ ◮
◭ ◮
Back Close
Full Screen / Esc
Print Version Interactive Discussion
EGU sphere, are known to contribute to SOA formation (Claeys et al.,2004;Kanakidou et
al.,2004). The current evidence from reaction chamber studies (Bonn and Moortgat, 2003) suggests that inducible VOCs with low volatility such as sesqui- and homoter-penes might be even more effective in reactions with O3 and subsequent formation of aerosol particles. Substantial increases in total terpene emissions from plants have
5
been detected after herbivore-feeding damage (Vuorinen et al.,2004b). Furthermore, plants damaged by insects (Vuorinen et al.,2004b) or ozone (Vuorinen et al.,2004a) start to emit certain less-volatile sesqui- and homoterpenes which are not emitted in substantial amounts from intact plants. An increase in the amount of biogenic VOCs can significantly affect SOA formation locally, e.g., during air pollution episodes.
Fur-10
thermore, these inducible VOCs act as an indirect plant defense by attracting the nat-ural enemies of herbivores (Dicke and van Loon,2000;Holopainen,2004).
Here, we present the first laboratory demonstration of aerosol nucleation from oxi-dation of volatile organic species emitted by living plants. We have measured particle formation over chemically treated cabbage plants during ozone pulses. The plants
15
were treated with methyl jasmonate elicitor to increase and induce emissions of dif-ferent terpenes. We show that a more likely atmospheric nucleation mechanism than homogeneous or ion-induced nucleation of oxidized organics is their heterogeneous condensation on pre-existing molecular clusters.
2. Experimental
20
White cabbage (Brassica oleracea subspecies capitata, cultivars Lennox and Rinda) plants were used as a source of biogenic VOCs in our experiments. Cabbages are im-portant crop plants cultivated in both hemispheres, and as a constitutive monoterpene emitters with inducible sesqui- and homoterpene emissions (Mattiacci et al., 1995;
Vuorinen et al., 2004b) suitable test plants for VOC experiments. Cabbage plants
25
ACPD
5, 1–16, 2005Particle formation by ozonolysis of plant
volatiles
J. Joutsensaari et al.
Title Page
Abstract Introduction
Conclusions References
Tables Figures
◭ ◮
◭ ◮
Back Close
Full Screen / Esc
Print Version Interactive Discussion
EGU ii) VOC emission analyses to determine VOC emissions from individual intact (control)
and treated plants (induced emission). We used methyl jasmonate (MeJA) treatment
(Loivam ¨aki et al.,2004) in order to artificially initiate emission spectrum that is typical
to herbivore-damaged plants (Vuorinen et al.,2004b).
2.1. Plant material and treatments
5
Seedlings of white cabbage (cultivars Lennox and Rinda) were individually sown in 1-l plastic pots filled with Sphagnum peat and sand (3:1 v/v) and pre-grown in
a greenhouse for 28 days. The plants were then transferred into computer
con-trolled growth chambers (Bioklim 2600T, Kryo-Service Oy, Helsinki, Finland) and main-tained at 23:18◦C, 70:80% relative humidity and 22 h light: 2 h dark photoperiod
10
(250µmol m−2s−1PAR during light period). Separate plants were used for VOC anal-yses and aerosol formation experiments with O3pulses.
To enhance emissions of monoterpenes and to induce emissions of homoterpenes and sesquiterpenes, the cabbage plants were sprayed with an aqueous MeJA solution (10 mmol water solution, approx. 7 ml per plant) about 2–4 days before the
experi-15
ments. VOCs were analyzed individually from intact (control plants) and MeJA-treated cabbages.
2.2. VOC analyses of individual plants
VOC emissions of the control and MeJA-treated cabbages were measured from five individual plants for both cultivars (Lennox and Rinda). Before sampling the root
sys-20
tem of the plant was rinsed and slightly pruned and placed in a 15 ml vial filled with tap water. The plants were individually enclosed inside 1-l glass vessels closed with Teflon-sealed lids with an inlet for purified pressurized air and an outlet for sampling. VOC samples were collected for 0.5 h on about 150 mg Tenax-TA adsorbent (Supelco, mesh 60/80) from plant headspace through Teflon tubing. The flow rate was set to
25
ACPD
5, 1–16, 2005Particle formation by ozonolysis of plant
volatiles
J. Joutsensaari et al.
Title Page
Abstract Introduction
Conclusions References
Tables Figures
◭ ◮
◭ ◮
Back Close
Full Screen / Esc
Print Version Interactive Discussion
EGU collection was performed at 22◦C and at 250µmol m−2s−1 PAR at ambient CO2 and
zero O3 concentration. Samples were analyzed by gas chromatography-mass
spec-trometry (GC-MS, Hewlett Packard GC type 6890, MSD 5973) after desorption (Perkin Elmer ATD400). Emissions were calculated as ng (g dry weight)−1h−1. The sample analysis has been described in detail elsewhere (Vuorinen et al.,2004b).
5
2.3. Aerosol formation experiments
Figure1shows the experimental set-up used in aerosol formation experiments. The ex-periments were carried out in a 2.6 m3growth chamber (Bioklim 2600T, height 1.75 m, bottom area 1.55 m×0.97 m). MeJA-treated cabbage plants (40 cv. Lennox and 35 cv. Rinda) were situated on a wire-net table about 0.20 m above the bottom of the chamber
10
in similar growth conditions as described earlier. Aerosol samples were taken at the height of about 0.5 m above the plants. During the ozonolysis experiments, a forced air circulation in the chamber was turned off to prevent particle losses and conden-sation of volatile vapors to the heat exchanger of the air circulation system. Further-more, the intensity of the lights was reduced from nominal values to the level of about
15
100µmol m−2s−1PAR to prevent increase in temperature. Filtered pressurized air flow
of about 5 l min−1was fed to the chamber to carry O3as well as to keep it slightly over
pressured during the experiments. O3was generated from pure oxygen (Fisher OZ500
O3generator) and continuously monitored (Dasibi Model 1008-RS O3analyzer). In ad-dition, relative humidity (RH) and temperature were determined continuously with aRH
20
and temperature transmitter (Vaisala Humitter Y50) at the height of about 0.5 m above the plants. VOC composition in the chamber air was collected with Perkin Elmer Se-quential Tube Sampler (Model STS 25) into Tenax-TA tubes before the start of aerosol formation experiment with O3. The VOC samples were analyzed as described earlier.
Particle formation and growth during O3 exposure in the chamber was determined
25
ACPD
5, 1–16, 2005Particle formation by ozonolysis of plant
volatiles
J. Joutsensaari et al.
Title Page
Abstract Introduction
Conclusions References
Tables Figures
◭ ◮
◭ ◮
Back Close
Full Screen / Esc
Print Version Interactive Discussion
EGU measured every 7 min in the size range of 5.5–70 nm. In addition, total number
con-centration of particles starting from about 5 nm up to several micrometers in diameter was measured with a condensation particle counter (CPC, TSI Model 3010) with a time resolution of 10 s. The DMPS system consists of a 10.9 cm long Hauke-type dif-ferential mobility analyzer (DMA,Winklmayr et al.,1991), which is used to classify the
5
aerosol particles based on their electrical mobility, and a condensation particle counter (CPC, TSI Model 3010), which is used to measure the concentration of size-classified particles. The DMA was operated with aerosol and sheath flows of 1 and 10 l min−1,
respectively, and the sheath and excess flows were controlled by a closed-loop flow ar-rangement with a critical orifice. The sample aerosol was neutralized with a radioactive
10
β-source (Ni-63) before the DMA. To measure particles down to about 5 nm in diameter, the temperature difference between saturator and condenser was increased to 25◦C in both CPCs (Mertes et al.,1995). From the measured DMPS data, particle size distri-butions were determined using a Tichonov regularization method with a smoothness constraint (Voutilainen et al.,2001). CPC counting efficiency and diffusional particle
15
losses in the tubing and the DMA were taken account in the data analysis.
Before particle production experiments with plants, blank chamber tests were per-formed in order to determine effects of impurities in the empty chamber
3. Results and discussion
3.1. Plant experiments
20
Table1shows results form the GC-MS analyses of the emissions from the control (in-tact) and MeJA-treated cabbages for cultivars Lennox and Rinda. The results indicated 2 to 10-fold increase in monoterpene emissions from MeJA treated plants. In addi-tion, homoterpene (E)-4,8-dimethyl-1,3,7-nonatriene (DMNT), sesquiterpene (E, E)-α -farnesene, and (Z)-3-hexenyl acetate which are typical to cabbage plants damaged
25
ACPD
5, 1–16, 2005Particle formation by ozonolysis of plant
volatiles
J. Joutsensaari et al.
Title Page
Abstract Introduction
Conclusions References
Tables Figures
◭ ◮
◭ ◮
Back Close
Full Screen / Esc
Print Version Interactive Discussion
EGU plants. In cultivar Rinda, control plants also emitted green leaf volatiles (GLVs, (Z
)-3-hexen-1-ol, (E)-2-hexenal and (Z)-3-hexenyl acetate) and (E, E)-α-farnesene indicat-ing possible mechanical damage durindicat-ing handlindicat-ing. The analyses of chamber air where MeJA-treated plants (both cultivars) were grown 14 to 24 h after the MeJA spraying, but before O3pulses indicated that all the terpenoids listed in Table1were detectable 5
except DMNT. Limonene, (E, E)-α-farnesene, sabinene andα-thujene were the most abundant terpenes in the air before noon.
The results show that MeJA-treated plants are more efficient in releasing aerosol precursors than non-treated intact plants, suggesting that inducible VOCs released by stressed plants are important aerosol particle precursors also at the canopy level.
10
For comparison, the main VOCs emitted from Scots pine (one of the most com-mon species in the boreal forest) are∆3-carene,α-pinene andβ-pinene according to recent measurements in two locations in Finland (Tarvainen et al.,2004). They con-tribute 60–85% of the total observed monoterpene emission rates. Globally the main monoterpenes are α-pinene, β-pinene and limonene (Kanakidou et al., 2004).
Al-15
though the spectrum of the VOCs emitted by the cabbages is somewhat different from the emission spectrum of e.g. Scots pines, we believe that it is more representative of atmospheric conditions than the VOCs or mixtures of VOCs commonly used in smog chamber experiments.
3.2. Blank chamber tests
20
Two sets of blank chamber tests were performed to determine effects of impurities in the empty chamber. In the first set, we observed particle production during the first ozonolysis of an empty chamber, but no aerosols were formed during subsequent periods when O3 was introduced into the chamber. We interpret this as a wall effect: volatile organics produced by plants that were placed in the chambers previously had
25
adsorbed on chamber walls and reacted with O3during the first ozonolysis experiment
ACPD
5, 1–16, 2005Particle formation by ozonolysis of plant
volatiles
J. Joutsensaari et al.
Title Page
Abstract Introduction
Conclusions References
Tables Figures
◭ ◮
◭ ◮
Back Close
Full Screen / Esc
Print Version Interactive Discussion
EGU chamber test set was performed after the experiments with MeJA-treated plants. In
this set, no nucleation was observed during chamber ozonolysis. This confirmed that the aerosol nucleation events observed during the plant ozonolysis experiments were actually caused by species emitted by the plants and not by impurities on the chamber walls.
5
3.3. Aerosol formation experiments
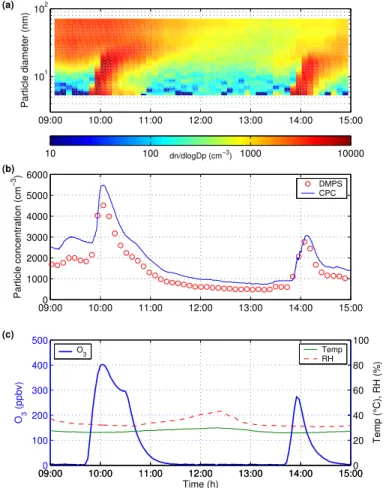
Figure2shows a contour plot of aerosol particle number size distributions, total aerosol
particle number and O3 concentrations, temperature and RH during aerosol
forma-tion experiments over MeJA-treated plants. Rapid particle producforma-tion was observed during two consecutive ozonolysis (400 and 270 ppbv O3, respectively) experiments. 10
Background particle number concentration and average particle diameter were about 2700 cm−3
and 35 nm, respectively, before the first ozone pulse. During the ozonolysis, particle concentration increased to about 5500 cm−3within 15 min and then started to decrease due to particle coagulation and deposition. During the second experiment about 3 hours later, particle concentration increased from 950 to 3000 cm−3in 15 min.
15
Relative humidity varied between 31–44% and temperature between 26–30◦C during
the experiments.
The most important quantities characterizing the intensity of the new particle forma-tion events are particle formaforma-tion rate (number of particles formed in unit volume and time) and growth rate (increase of particle diameter in unit time). The former is
depen-20
dent on condensable vapor supersaturation level, while the latter depends on the ab-solute difference between the partial pressure and the saturation vapor pressure. The particle formation rates (or more precisely, 5 nm particle appearance rates) during the nucleation events were 3.1 and 2.3 cm−3s−1. These numbers are well comparable to
particle formation rates observed in ambient air, which vary between 0.01–10 cm−3s−1
25
in the continental boundary layer (Kulmala et al., 2004). The particle growth rates, on the other hand, were on the order of 40–70 nm h−1, corresponding to condensable
atmo-ACPD
5, 1–16, 2005Particle formation by ozonolysis of plant
volatiles
J. Joutsensaari et al.
Title Page
Abstract Introduction
Conclusions References
Tables Figures
◭ ◮
◭ ◮
Back Close
Full Screen / Esc
Print Version Interactive Discussion
EGU spheric nucleation events, as well as the corresponding condensable vapor mixing
ratios, are usually an order of magnitude lower, the maximum observed growth rate being 20 nm h−1(Kulmala et al.,2004).
The disparity between particle growth rates in our experiments and in the atmo-sphere contradicts the theory (Bonn and Moortgat,2003) that atmospheric nucleation
5
events are caused by homogeneous nucleation of ozonolysis products of volatile com-pounds released by plants: our experiments show that the condensable vapor con-centrations required to produce the nucleation are roughly ten times higher than those related to atmospheric particle formation events. Furthermore we did not shield the growth chamber from cosmic rays, so that ions have been created in the chamber air
10
during our experiments. We would expect the ionization rate to be on the same order as the observed particle formation rates, and it is therefore possible that the nucleation we observed was ion-induced. But whatever the actual nucleation mechanism, the required vapor concentrations are still higher than what are needed for atmospheric nucleation. Our results therefore also contradict the possibility that atmospheric
parti-15
cle formation events are caused by ion-induced nucleation of oxidized organics. Although it seems that the nucleation in our growth chamber proceeded with a dif-ferent mechanism than in the atmosphere, we believe that our experimental results are in fact consistent with the atmospheric observations. Another theory put forward recently (see e.g. Kulmala, 2003) holds that in the atmosphere, thermodynamically
20
stable molecular clusters with diameters of about 1 nm are formed due to clustering of sulfuric acid and possibly ammonia and water molecules. Subsequently, other, presum-ably organic, vapors are needed to nucleate heterogeneously on the sulfate clusters, speeding up cluster growth so that the clusters survive to detectable sizes (>3 nm) be-fore they are scavenged due to coagulation with larger particles. In our experiments,
25
ACPD
5, 1–16, 2005Particle formation by ozonolysis of plant
volatiles
J. Joutsensaari et al.
Title Page
Abstract Introduction
Conclusions References
Tables Figures
◭ ◮
◭ ◮
Back Close
Full Screen / Esc
Print Version Interactive Discussion
EGU experiments compared with the atmosphere. This explains why we observe more rapid
growth of particles than what is encountered in atmospheric conditions.
Furthermore, the absence of nucleation events in the Amazon suggests that new particle formation purely from SOA compounds may not be frequent in environments with very high biogenic VOC concentrations but very low sulfur concentrations (
Kanaki-5
dou et al.,2004). The conditions in our experiments are similar with the exception of higher O3concentration that can induce particle formation via homogenous nucleation.
This also supports our suggestion that the main particle formation mechanism in the atmosphere is condensation of oxidized organics on pre-existing molecular clusters but homogenous nucleation in our chamber experiments.
10
4. Conclusions
We have studied formation and growth of aerosol particles over white cabbage plants
during O3 exposure in a growth chamber. The plants had been treated with methyl
jasmonate (MeJA) elicitor to artificially initiate an emission spectrum that is typical to herbivore-damaged plants and to induce emissions of homo- and sesquiterpenes. In
15
addition, we have determined emissions of volatile organic compounds (VOCs) from individual intact (control) and MeJA-treated plants for emission comparison.
The VOC emission analyses from individual plants show that MeJA-treated plants are more efficient in releasing aerosol precursors than non-treated plants, suggesting that inducible VOCs released by stressed plants are important aerosol particle
pre-20
cursors at the canopy level. Current estimates of phytogenic VOC emissions have predominantly assessed isoprene and monoterpene emission rates of different plant species (Kesselmeier and Staudt, 1999). To better assess aerosol forming capacity of vegetation, it is essential to evaluate the whole emitted VOC spectrum of diff er-ent plant species including sesquiterpenes and other inducible terpenes. Furthermore,
25
ACPD
5, 1–16, 2005Particle formation by ozonolysis of plant
volatiles
J. Joutsensaari et al.
Title Page
Abstract Introduction
Conclusions References
Tables Figures
◭ ◮
◭ ◮
Back Close
Full Screen / Esc
Print Version Interactive Discussion
EGU inducible VOCs released after herbivore damage may degrade fast and lose their
eco-logical signaling value (Holopainen,2004) to natural enemies of herbivores. Recently, it has been proposed that crop plants should be genetically engineered to produce these inducible volatiles (Degenhardt et al.,2003). Cultivation of such “self defending” crops might reduce pesticide use, but air pollutants (e.g. O3, NOx) that destroy emitted 5
volatiles could decrease the efficiency of this strategy.
Our aerosol particle size distribution measurements showed rapid particle formation during ozonolysis experiments. To our knowledge, aerosol production due to ozonol-ysis of plant-released VOCs has not been demonstrated in the laboratory prior to this work. The observed particle formation rates were well in the range observed in
at-10
mospheric nucleation events; however, particle growth rates were clearly higher. The results indicate that the concentrations of nonvolatile oxidation products of plant re-leased precursors needed to induce the nucleation are roughly an order-of-magnitude higher than their concentrations during atmospheric nucleation events. Our results therefore suggest that atmospheric nucleation events proceed via condensation of
ox-15
idized organics on pre-existing molecular clusters rather than via their homogeneous or ion-induced nucleation.
Acknowledgements. This work was supported by the Academy of Finland, decisions no. 105209 and 202300 (M. Loivam ¨aki, T. Vuorinen, A.-M. Nerg, J. K. Holopainen) project 52476 and the Center of Excellence program (A. Laaksonen, J. Joutsensaari) and by Emil Aaltonen 20
Foundation (J. Joutsensaari and P. Miettinen). The authors want to thank T. Oksanen for his help during the experiments and the staffat the Kuopio University Research Garden for main-taining the plants.
References
Anderson, T. L., Charlson, R. J., Schwartz, S. E., Knutti, R., Boucher, O., Rodhe, H., and 25
ACPD
5, 1–16, 2005Particle formation by ozonolysis of plant
volatiles
J. Joutsensaari et al.
Title Page
Abstract Introduction
Conclusions References
Tables Figures
◭ ◮
◭ ◮
Back Close
Full Screen / Esc
Print Version Interactive Discussion
EGU
Bonn, B. and Moortgat, G. K.: Sesquiterpene ozonolysis: Origin of atmospheric new particle formation from biogenic hydrocarbons, Geophys. Res. Lett., 30, 1585, doi:10.1029/2003GL017000, 2003. 3,9
Claeys, M., Graham, B., Vas, G., Wang, W., Vermeylen, R., Pashynska, V., Cafmeyer, J., Guyon, P., Andreae, M. O., Artaxo, P., and Maenhaut, W.: Formation of secondary organic 5
aerosols through photooxidation of isoprene, Science, 303, 1173–1176, 2004. 3
Degenhardt, J., Gershenzon, J., Baldwin, I. T., and Kessler, A.: Attracting friends to feast on foes: engineering terpene emission to make crop plants more attractive to herbivore enemies, Curr. Opin. Biotechnol., 14, 169–176, 2003. 11
Dicke, M. and van Loon, J. J. A.: Multitrophic effects of herbivore-induced plant volatiles in an 10
evolutionary context, Entomol. Exp. Appl., 97, 237–249, 2000. 3
Holopainen, J. K.: Multiple functions of inducible plant volatiles, Trends Plant Sci., 9, 529–533, 2004. 3,11
Kanakidou, M., Seinfeld, J. H., Pandis, S. N., Barnes, I., Dentener, F. J., Facchini, M. C., Van Dingenen, R., Ervens, B., Nenes, A., Nielsen, C. J., Swietlicki, E., Putaud, J. P., Balkanski, 15
Y., Fuzzi, S., Horth, J., Moortgat, G. K., Winterhalter, R., Myhre, C. E. L., Tsigaridis, K., Vignati, E., Stephanou, E. G., and Wilson, J.: Organic aerosol and global climate modelling: A review, Atmos. Chem. Phys. Discuss., 4, 5855–6024, 2004,
SRef-ID: 1680-7375/acpd/2004-4-5855. 2,3,7,10
Kesselmeier, J. and Staudt, M.: Biogenic volatile organic compounds (VOC): An overview on 20
emission, physiology and ecology, J. Atmos. Chem., 33, 23–88, 1999. 10
Knutson, E. O. and Whitby, K. T.: Aerosol classification by electric mobility: apparatus, theory and applications, J. Aerosol Sci., 6, 443–451, 1975. 5
Kulmala, M.: How particles nucleate and grow, Science, 302, 1000–1001, 2003. 9
Kulmala, M., Vehkam ¨aki, H., Pet ¨aj ¨a, T., Dal Maso, M., Lauri, A., Kerminen, V.-M., Birmili, W., 25
and McMurry, P. H.: Formation and growth rates of ultrafine atmospheric particles: a review of observations, J. Aerosol Sci., 35, 143–176, 2004. 8,9
Loivam ¨aki, M., Holopainen, J. K., and Nerg, A.-M.: Chemical changes induced by methyl jas-monate in oilseed rape grown in the laboratory and in the field, J. Agric. Food Chem., 52 (25), 7607–7613, 2004. 4
30
ACPD
5, 1–16, 2005Particle formation by ozonolysis of plant
volatiles
J. Joutsensaari et al.
Title Page
Abstract Introduction
Conclusions References
Tables Figures
◭ ◮
◭ ◮
Back Close
Full Screen / Esc
Print Version Interactive Discussion
EGU
Mertes, S., Schroder, F., and Wiedensohler, A.: The particle-detection efficiency curve of the TSI-3010 CPC as a function of the temperature difference between saturator and condenser, Aerosol Sci. Technol., 23, 257–261, 1995. 6
Tarvainen, V., Hakola, H., Hell ´en, H., B ¨ack, J., Hari, P., and Kulmala, M.: Temperature and light dependence of the VOC emissions of Scots pine, Atmos. Chem. Phys. Discuss., 4, 6691– 5
6718, 2004,
SRef-ID: 1680-7375/acpd/2004-4-6691. 7
Voutilainen, A., Kolehmainen, V., and Kaipio, J. P.: Statistical inversion of aerosol size mea-surement data, Inverse Probl. Eng., 9, 67–94, 2001. 6
Vuorinen, T., Nerg, A. M., and Holopainen, J. K.: Ozone exposure triggers the emission of 10
herbivore-induced plant volatiles, but does not disturb tritrophic signalling, Environ. Pollut., 131, 305–311, 2004a. 3
Vuorinen, T., Nerg, A. M., Ibrahim, M. A., Reddy, G. V. P., and Holopainen, J. K.: Emission of Plutella xylostella-induced compounds from cabbages grown at elevated CO2and orientation behavior of the natural enemies, Plant Physiol., 135, 1984–1992, 2004b. 3,4,5,6
15
ACPD
5, 1–16, 2005Particle formation by ozonolysis of plant
volatiles
J. Joutsensaari et al.
Title Page
Abstract Introduction
Conclusions References
Tables Figures
◭ ◮
◭ ◮
Back Close
Full Screen / Esc
Print Version Interactive Discussion
EGU
Table 1. VOC (terpenes and two green leaf volatiles) emissions (±SD, ng g−1
d.w. h−1
) of cab-bage cultivars Lennox and Rinda. VOCs were analyzed from intact (control) and MeJA-treated (sprayed with 10 mM MeJA 4 days prior to the experiments) cabbage plants (n=5 per cv.). As-terisks denote statistically significant (P <0.05, Mann-Whitney U-test) difference between treat-ment means among the cultivar. Superscripts MT, HT, ST, and GLV denote a class of VOC: monoterpene, homoterpene, sesquiterpene, and green leaf volatile, respectively. DMNT= (E)-4,8-dimethyl-1,3,7-nonatriene.
cv. Lennox cv. Rinda
Control MeJA Control MeJA
α-thujeneMT 1.4±3.2 36.7±9.6* 8.2±5.3 37.6±12.7*
α-pineneMT 0 20.7±3.7* 1.0±2.2 20.9±9.3* sabineneMT 11.3±11.6 115.1±25.4* 5.2±11.5 115.9±53.4*
β-pineneMT+myrceneMT 0 47.2±10.8* 11.54±1.0 47.6±21.6* limoneneMT 30.1±14.2 377.8±96.4* 55.64±70.79 133.2±85.2 1,8-cineoleMT 18.5±6.0 61.9±11.0* 39.27±47.56 81.7±44.2
DMNTHT 0 76.5±23.7* 0 41.0±10.4*
(E,E)-α-farneseneST 0 26.1±19.8 3.94±8.80 43.2±22.7*
Total terpene emission 61.3±8.1 761.9±143.8* 124.8±115.5 521.1±235.4
(Z)-3-hexen-1-ol+(E)-2-hexenalGLV 0 39.5±53.7 87.81±138.90 0 (Z)-3-hexenyl acetateGLV 0 146.2±169.2* 160.2±189.6 35.2±23.9
ACPD
5, 1–16, 2005Particle formation by ozonolysis of plant
volatiles
J. Joutsensaari et al.
Title Page
Abstract Introduction
Conclusions References
Tables Figures
◭ ◮
◭ ◮
Back Close
Full Screen / Esc
Print Version Interactive Discussion
EGU Circulating Air
Excess Air CO
Vac.
10 l/min 1 l/min
1 l/min
10 l/min
CPC
Sheath Air
Pump
DMA
DMPS:
Number Size Distribution ~5 - 70 nm
CPC: Condensation Particle Counter CO: Critical Orifice
DMA: Differential Mobility Analyzer DMPS: Differential Mobility Particle Sizer Ex. Excess
NL: Bipolar Neutralizer PA: Dry, clean pressured air Vac. Vacuum (pump) HEPA filter
Growth Chamber Lights
~5 l/min PA
CPC
1 l/min Vac.
CPC:
Particle Concentration >5 nm
2 l/min
NL
Ozone Analyzer RH and
Temperature Transmitter
Wire-net table
Aerosol Sample
Ozone Generator
Cabbages ~2 l/min
ACPD
5, 1–16, 2005Particle formation by ozonolysis of plant
volatiles
J. Joutsensaari et al.
Title Page
Abstract Introduction
Conclusions References
Tables Figures
◭ ◮
◭ ◮
Back Close
Full Screen / Esc
Print Version Interactive Discussion
EGU 09:000 10:00 11:00 12:00 13:00 14:00 15:00
1000 2000 3000 4000 5000 6000
Particle concentration (cm
−3
)
(b)
DMPS CPC
09:00 10:00 11:00 12:00 13:00 14:00 15:00 101
102
Particle diameter (nm)
(a)
dn/dlogDp (cm−3)
10 100 1000 10000
09:000 10:00 11:00 12:00 13:00 14:00 15:00
100 200 300 400 500
Time (h)
O3
(ppbv)
(c)
09:00 10:00 11:00 12:00 13:00 14:00 15:000 20 40 60 80 100
Temp (°C), RH (%)
O3 Temp
RH