APP Is a Context-Sensitive Regulator of the
Hippocampal Presynaptic Active Zone
Melanie Laßek1☯, Jens Weingarten1☯, Martin Wegner2☯, Benjamin F. Mueller3, Marion Rohmer3, Dominic Baeumlisberger4, Tabiwang N. Arrey5, Meike Hick6, Jörg Ackermann2, Amparo Acker-Palmer1, Ina Koch2, Ulrike Müller6, Michael Karas3, Walter Volknandt1*
1Institute for Cell Biology and Neuroscience, Biologicum, Johann Wolfgang Goethe-University, Frankfurt am Main, Germany,2Institute for Molecular Bioinformatics, Johann Wolfgang Goethe-University, Frankfurt am Main, Germany,3Institute of Pharmaceutical Chemistry, Cluster of Excellence“Macromolecular
Complexes”, Johann Wolfgang Goethe-University, Frankfurt am Main, Germany,4SunChrom
Wissenschaftliche Geräte GmbH, Friedrichsdorf, Germany,5Thermo Fisher Scientific, Bremen, Germany, 6Department of Pharmacy and Molecular Biotechnology, University Heidelberg, Heidelberg Germany
☯These authors contributed equally to this work. *[email protected]
Abstract
The hallmarks of Alzheimer’s disease (AD) are characterized by cognitive decline and behavioral changes. The most prominent brain region affected by the progression of AD is the hippocampal formation. The pathogenesis involves a successive loss of hippocampal neurons accompanied by a decline in learning and memory consolidation mainly attributed to an accumulation of senile plaques. The amyloid precursor protein (APP) has been identi-fied as precursor of Aβ-peptides, the main constituents of senile plaques. Until now, little is known about the physiological function of APP within the central nervous system. The allo-cation of APP to the proteome of the highly dynamic presynaptic active zone (PAZ) high-lights APP as a yet unknown player in neuronal communication and signaling. In this study, we analyze the impact of APP deletion on the hippocampal PAZ proteome. The native hip-pocampal PAZ derived from APP mouse mutants (APP-KOs and NexCreAPP/APLP2-cDKOs) was isolated by subcellular fractionation and immunopurification. Subsequently, an isobaric labeling was performed using TMT6for protein identification and quantification by high-resolution mass spectrometry. We combine bioinformatics tools and biochemical approaches to address the proteomics dataset and to understand the role of individual pro-teins. The impact of APP deletion on the hippocampal PAZ proteome was visualized by cre-ating protein-protein interaction (PPI) networks that incorporated APP into the synaptic vesicle cycle, cytoskeletal organization, and calcium-homeostasis. The combination of sub-cellular fractionation, immunopurification, proteomic analysis, and bioinformatics allowed us to identify APP as structural and functional regulator in a context-sensitive manner within the hippocampal active zone network.
OPEN ACCESS
Citation:Laßek M, Weingarten J, Wegner M, Mueller BF, Rohmer M, Baeumlisberger D, et al. (2016) APP Is a Context-Sensitive Regulator of the Hippocampal Presynaptic Active Zone. PLoS Comput Biol 12(4): e1004832. doi:10.1371/journal.pcbi.1004832
Editor:Lilia M. Iakoucheva, University of California San Diego, UNITED STATES
Received:October 27, 2015
Accepted:February 25, 2016
Published:April 19, 2016
Copyright:© 2016 Laßek et al. This is an open access article distributed under the terms of the Creative Commons Attribution License, which permits unrestricted use, distribution, and reproduction in any medium, provided the original author and source are credited.
Data Availability Statement:All relevant data are within the paper and its Supporting Information files.
Funding:Financial support was provided by the Deutsche Forschungsgemeinschaft (MU 1457/8-1; 1457/9-1 to Ulrike Müller) and by grants from the Cluster of Excellence EXC 115 and Gutenberg Research College (GRC) University Mainz (to Amparo Acker-Palmer). The funders had no role in study design, data collection and analysis, decision to publish, or preparation of the manuscript.
Author Summary
More than 20 years ago, the amyloid precursor protein (APP) was identified as the precur-sor protein of the Aβpeptide, the main component of senile plaques in brains affected by Alzheimer’s disease. However, little is known about the physiological function of amyloid precursor protein. Allocating APP to the proteome of the structurally and functionally dynamic presynaptic active zone highlights APP as a hitherto unknown player within the presynaptic network. The hippocampus is the most prominent brain region for learning and memory consolidation, and a vulnerable target for neurodegenerative disease, e. g. Alzheimer’s disease. Therefore, our experimental design is focused on the hippocampal neurotransmitter release site. Currently, the underlying mechanism of how APP acts within presynaptic networks is still elusive. Within the scope of this research article, we constructed a network of APP within the presynaptic active zone and how deletion of APP affects these individual networks. We combine bioinformatics tools and biochemical approaches to address the dataset provided by proteomics. Furthermore, we could unravel that APP executes regulatory functions within the synaptic vesicle cycle, cytoskeletal rear-rangements and Ca2+-homeostasis. Taken together, our findings offer a new perspective
on the physiological function of APP in the central nervous system and may provide a molecular link to the pathogenesis of Alzheimer’s disease.
Introduction
is changed in the elderly mice, when impairments in spatial and working memory become obvious [7,9,10]. Compared to the APP-KO mice, deletion of both APP and APLP2 provokes a lethal phenotype [15]. To circumvent postnatal lethality a conditional APP/APLP2 double knockout has recently been designed making use of the NexCre mouse line [7]. Within excit-atory forebrain neurons Cre recombinase becomes activated under the control of NEX at embryonic day E11.5 allowing deletion of floxed proteins in distinct brain regions such as the hippocampus [16]. The NexCre APP/APLP2 cDKO (NexCre-cDKO) turned out to be viable but displayed severe impairments in memory related tasks associated with reduced long term potentiation (LTP) already in young animals [7]. The effect of APP deletion on hippocampus-specific function (LTP) points to an essential role of APP for learning and memory consolida-tion. Furthermore, the impact of APP deletion and APP/APLP2 deletion within the CNS point to general physiological role in synaptic plasticity and synaptic maintenances [6–10]. In this context, we addressed the question of the cellular function of APP at synaptic release sites by comparing wild type and knockout mice and creating protein-protein interaction networks. Former observations point to an as yet unknown link that incorporates APP into the physio-logical network of the presynaptic active zone. Our novel experimental design for the isolation and purification of the native hippocampal PAZ [14] along with quantitative biochemical and proteomic approaches allowed us to compare APP-mutants to their controls and to unravel the proximate impact of APP deletion. Apart from this methodological approach we visualized the impact of APP on the hippocampal PAZ proteome by creating protein-protein interaction (PPI) networks that incorporate APP into protein networks of the synaptic vesicle cycle, cyto-skeletal organization and calcium-homeostasis. Or results derived from the combination of multidisciplinary biological techniques suggest that APP is as structural and functional regula-tor in a context-sensitive manner within the hippocampal active zone network.
Materials and Methods
Animals
Animal treatment was performed under veterinary supervision in accordance with animal wel-fare regulations of the German animal protection law (Regierungspräsidium Darmstadt and Karlsruhe, Germany). All mice were maintained in an animal facility, and the experimental procedures were approved by the Animal Welfare office of the Regierungspräsidium Darm-stadt and Karlsruhe. APP-KO (APP-/-) compared to wildtype (C57BL/6N), and APP
flox/flox-APLP2−/−
NexCre+/T(NexCre-cDKO) compared to APPflox/floxAPLP2-/-(APLP2-/-), mice of both sexes and age-matched (12 or 16 weeks respectively) were kept under 12 h light and dark cycle with food and water ad libitum. The generation of APP mutant mice has previously been described [7,17].
Antibodies
Antibodies were directed against APLP1 (CT-11, rabbit polyclonal, 1:2000, Calbiochem—
in-house), SV2A (rabbit polyclonal, 1:1000 kindly donated by Dr. S. Bajjalieh, Seattle, USA), and VAMP2 (cl. 69.1, mouse monoclonal, 1:1000 Synaptic Systems, Göttingen, Germany).
Dynabeads M-280 conjugated with monoclonal sheep anti-mouse IgGs (cat. No. 112.02D) were purchased from Invitrogen, Darmstadt, Germany.
Subcellular fractionation of the PAZ from mouse hippocampus
The hippocampus was dissected from native mouse brain prior to subcellular fractionation. Synaptic vesicles were isolated from synaptosomes according to the protocol guidelines of Whittaker [18]. The protocol has previously been adapted to the fractionation of individual mouse brains [19] and downscaled for individual mouse brain regions [14]. The following modifications were applied: Individual hippocampi was homogenized in 0.4 mL of preparation buffer (5 mM Tris-HCl, 320 mM sucrose, pH 7.4) containing the protease inhibitors antipain, leupeptin, chymostatin (2μg/mL each), pepstatin (1μg/mL) and benzamidine (1 mM). Unless
otherwise mentioned the material was kept at 4°C during the entire preparation. The hippo-campal homogenate was centrifuged using a Beckman TLX Optima 120 and rotor TLA 120.2 by acceleration (mode 4) up to 2800gavfor 2 min. The resulting pellet was discarded and the
supernatant was further fractionated by discontinuous Percoll gradient centrifugation. The Percoll gradient was prepared by layering 1.0 mL supernatant solution onto three layers of 1.0 mL Percoll solution [3%, 10%, 23% (v/v) in preparation buffer]. After centrifugation using the TLA 100.4 rotor for 7 min at 35,000gav, fractions containing synaptosomes were collected and
diluted twofold in preparation buffer and centrifuged using TLA 100.4 rotor for 35 min at 50,000gav. For hypoosmotic lysis of synaptosomes the resulting pellet was triturated in four
vol-umes of lysis buffer (5 mM Tris-HCl, pH 7.4) at room temperature. The suspension was centri-fuged using the TLA 100.4 rotor for 60 min at 250,000gav. The pellet was resuspended and
homogenized in 300μL sucrose buffer (10 mM HEPES-NaOH, 0.5 mM EGTA, 0.1 mM
MgCl2, 200 mM sucrose, pH 7.4). This microsomal solution was layered onto 900μL of a
dis-continuous sucrose gradient (0.3 M, 0.75 M, and 1.2 M; containing 10 mM HEPES, 0.5 mM EGTA, adjusted to pH 7.4) and centrifuged using a WX Ultra 90 Sorvall centrifuge and the TST 55.5 rotor for 2 h at 65,000gav. Thirty-six fractions (35μL each) were collected from top to
bottom of the gradient. The pooled lower fractions (LF) 16 to 30 corresponding to sucrose con-centrations of 0.5 to 1.1 M were further analyzed.
Immunopurification of the hippocampal presynaptic active zone via docked synaptic vesicles
The immunopurification protocol for the presynaptic active zone (PAZ) via docked synap-tic vesicles was as described recently for individual mouse brain regions [14]. In brief, 100μL
magnetic beads pre-coupled with an anti-mouse monoclonal antibody were washed with Tris-buffered saline (TBS, pH 7.4) and incubated with TBS containing 1% glycine, 1% lysine and 0.5% saponin followed by three washing steps in TBS. Magnetic beads were then incubated for 1 h with the anti-SV2 antibody (3μg of antibody per 107 magnetic beads to gain representative
Western blotting
For quantification of protein contents the BCA-assay kit (#23225; Pierce, Rockford, IL, USA) was applied. Immunopurified material was eluted from the beads with 2% SDS, 62.5 mM Tris, pH 6.8, prior to protein determination. The BCA kit tolerates up to 5% SDS, and 2% SDS are recommended to eliminate interference by lipids. Subsequently proteins were dissolved with sample buffer containing 2% SDS, 62.5 mM Tris, pH 6.8, 10% glycerol, and 0.01% bromophe-nol blue. Equal amounts of protein (100 ng) were resolved on a 15% Tris-glycine SDS-PAGE [20] and transferred onto nitrocellulose membrane (GE Healthcare) using semi-dry blotting techniques (BioRad). Membranes were blocked with 5% skimmed milk powder in PBS/T (123 mM NaCl, 7.4 mM Na2HPO4, 4.3 mM KH2PO4, 0.1% Tween20) for 1 h. Incubation with the
respective primary antibody was performed over night at 4°C followed by a second blocking step with 5% skimmed milk powder (five times, 10 min each), subsequent incubation with the respective HRP-conjugated secondary antibody (GE Healthcare) and a final washing step in PBS/T (five times, 10 min each).
Quantification and statistics
Immunoblots were incubated with Western Lightning ECL substrate and visualized using Ima-geQuant LAS 4000 (both GE Healthcare). Quantification of immunosignals was performed with samples obtained under identical experimental conditions (n = 3) and run in one gel. Pixel intensities of non-saturated bands (±SEM, standard error of the mean) from the same blot, were measured in voxels using ImageQuant TL software. Data were statistically processed employing unpaired Student’s t-test.
Mass spectrometry
—
LC-MS/MS analysis of individual hippocampal
PAZ
The immunopurified presynaptic active zone (PAZ) derived from mouse hippocampus was subjected to enzymatic digestion using the well-established serine protease trypsin. The amount of trypsin (Proteomics Grade, Sigma Aldrich, St. Louis, MO) was adjusted to an enzyme-to-substrate ratio of 1:50 for each sample according to the protein concentrations determined by BCA Protein Assay (Pierce, Thermo Scientific). The digestion was performed at 37°C for 18 h and stopped by adding 3μL of formic acid (FA). Samples were dried down and
solubilized in solvent A (5% MeCN, 0.1% FA) to obtain a final concentration of 1μg peptide
mixture perμL.
Peptide labeling with TMT sixplex was carried out according to the manufacturer’s protocol (TMT6, Thermo Scientific). The immunopurified hippocampal PAZ derived from the respec-tive wild type mice was labeled with TMT-126, TMT-127 and TMT-128, whereas the immuno-purified hippocampal PAZ from APP mutants was labeled with TMT-129, TMT-130, and TMT-131. The peptide mixtures were combined, purified and desalted by employing Pierce C18 spin columns (Thermo Scientific) and finally dried down. Prior to separation the sample was solubilized in solvent A (2% MeCN, 0.1% formic acid) to a final concentration of 1μg/μl.
Chromatographic separation of the mixture was performed on a Dionex Ultimate 3000 RSLC nano system (Thermo Scientific). Peptides were trapped on an Acclaim PepMap
100μCartridge Column C18, 300μm x 0.5 cm, 5μm, 100 Å (backflush mode) trapping column
prior to separation on an Acclaim PepMap 100 C18 (2μm, 100 Å, 75μm i.d. x 50 cm)
in a data-dependent acquisition mode selecting the top 12 most intense peaks from a survey scan for fragmentation.
The survey scan was performed using the following parameters: scan range between 300–
1500 m/z at a resolution of 70000 at m/z 200. The AGC target value was set to 3e6. MS/MS scans were acquired at a resolution of 17,500 at m/z 200 with an AGC target of 1e5. The precur-sors were isolated with an isolation width of 1.6 Da and the normalized collision energy (NCE) was 35. Dynamic exclusion was set to 20s, peptide recognition mode was enabled while singly and charged state above 8 and unassigned precursor ions were disabled. The immunopurified hippocampal PAZs were analyzed in triplicate.
Data processing, database searches for protein identification and relative quantification were performed using Proteome Discoverer (V1.4.0.288, Thermo Scientific). Spectra were deconvoluted by the integrated software module and a signal-to-noise filter of 1.5 was applied. The database search was performed on an in-house Mascot server. Precursor mass tolerance was set to 10 ppm and fragment mass tolerance to 0.02 Da. Oxidation of methionine and dea-midation of asparagine and glutamine were allowed as variable modifications and TMT was set as fixed modification for lysine residues and peptide N-termini. Spectra were searched against a database of murine proteins (SwissProt, released on 2014-02-19) and a two-level decoy search was performed, with a target FDR value of1%.
For quantification, the mass window for peak integration tolerance was set to 20 ppm and the most confident centroid peak detection was applied. Only unique peptides were considered and the results were normalized on protein median by the built-in software module.
Only proteins that were identified in each experiment and present in the hippocampal PAZ of all animals (n = 12) were considered for further analysis.
Bioinformatics
interaction databases. The STRING database collects PPI data using computational methods like text mining and prediction algorithms. The data collection step created data files which contain also interactions between proteins of the dataset and proteins that are not members of the dataset. Only interactions where both interactors are members of the dataset were kept for further analysis. Respective UniProt accession numbers were used as unique identifiers for the proteins in the network. UniProt identifiers were mapped onto the BioGRID and STRING interactions using respective identifier mapping data from each database.
Creating the network
Cytoscape 3.2.1 [30], an open source software platform for visualizing, integrating, and analyz-ing networks, was used to create the actual PPI network. All data files were imported into Cytoscape and the networks were merged into a single network using Cytoscape’s network merging tool. Filters were applied to retain only physical interactions which were experimen-tally detected. We used a selection of proteins that are constituents of the hippocampal PAZ. Singletons and small connected components which had no connection to the giant connected component were excluded. Additional node information was loaded from UniProt and the rel-ative abundance was attributed to the respective node. Localization of proteins was derived from UniProt and mapped manually onto each node. The Cytoscape 3 session file of or data set is provided asS1 Cytoscape 3 File.
Network analysis, community structure, and visualization
The Cytoscape NetworkAnalyzer tool was used to analyze the topology of the network and to compute centrality values for each node. The importance of nodes in the network was ranked in accordance with their centrality values. Centralities are numerical values assigned to nodes based on statistical properties. We used the clustering coefficient, degree, and shortest path betweenness as implemented in the Cytoscape NetworkAnalyzer tool. The cluster coefficient describes the densities of connections between neighbors with a range from 0 to 1 the latter with the highest density (100%), degree is the number of interactions, and betweenness repre-sents the ratio of all shortest paths between two nodes to the number of shortest paths a given node (e.g. APP) is participating in. Community detection was performed for unweighted mod-ularity [31,32] using Radatools 3.2 [33] that outputs the best partition found in form of a text file which contains information about the number of elements in each partition, a list of ele-ments, the size of each community, and the indices of each element. The Radatools software implements several algorithms for the optimization of modularity. Here, a combination of tabu search [33], extremal optimization [34], fast heuristics [35] and spectral optimization [36] was used. To visualize the distributions of up- and downregulated proteins in APP-KO and NexCre-cDKO the relative abundances of all proteins were mapped on the network. We used Cytoscape 3.2.1 for all network layouts and visualizations.
All network visualizations are optimized for color vision deficiency. Changes in protein abundance of more than ±10% are reflected by increasing sizes of the nodes.
Results
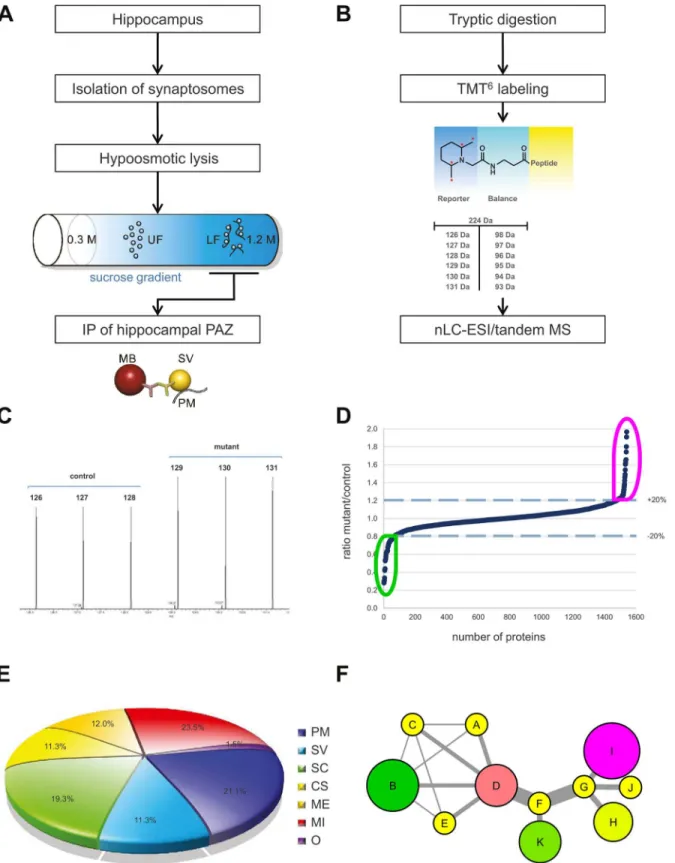
The native hippocampal PAZ from age-matched individual mice was subjected to subcellu-lar fractionation and immunopurification (Fig 1A) [14]. Importantly, the synaptic vesicle pro-tein SV2, the target propro-tein applied for immunopurification, revealed no change in abundance in either APP-mutant (S1 Table; APP-mutant/control 0.997). For the setup of the PPI-network, we analyzed the experimental data derived from APP single KO mice and conditional APP/ APLP2 double knockout mice (NexCre-cDKO) as compared to the respective controls. To identify changes in protein abundance between two or more biological conditions, we
employed an isobaric labeling approach (tandem mass tag, TMT6) combined with high-resolu-tion mass spectrometry (Fig 1B). The abundance of reporter tags reflects the ratio of peptides in biological triplicates and was used for quantification (Fig 1C). Significantly identified pro-teins were plotted in an ascending order according to their changes in protein abundance (mutant/control) (Fig 1D). A common core proteome (~1100 proteins) was defined, including only those proteins being identified in all animals (n = 12) and in all experiments (Fig 1Eand
S1 Table). Furthermore, these core proteins were categorized into different groups within the hippocampal PAZ and were assigned as follows: integral and associated presynaptic plasma membrane proteins (PM), integral and associated synaptic vesicle proteins (SV), signaling cas-cade (SC), cytoskeleton (CS), metabolic enzymes (ME), mitochondria (M) and yet uncharac-terized proteins named others (O) (Fig 1E). The percentage composition of the different categories is depicted in the pie chart (Fig 1E). All proteins within the pie chart were further fil-tered and visualized according to their subcellular localization and their functional allocation (clustering) by creating a PPI network (schemeFig 1F; additional information about PPI net-works is provided inS1 Text), excluding all non-physical and non-validated interactions.
Recently, we analyzed the impact of single KO of either APP, ALPL1 or APLP2 on selected PAZ proteins derived from individual mouse brains [37] and developed a novel experimental setup to isolate the native PAZ from distinct brain regions such as olfactory bulb, cerebellum and hippocampus [14]. Employing quantitative immunodetection we now analyzed the NexCre-cDKO for selected members of the hippocampal PAZ proteome including APP, APLP1, the synaptic vesicle proteins synaptophysin (S-phys), SV2A, synaptotagmin-1 (Syt-1) and the SNARE complex members vesicle-associated membrane protein 2 (VAMP2), synapto-somal-associated protein 25 (SNAP25), syntaxin-1 (Syt-1) whereby the single APLP2-KO served as control (Fig 2). In agreement with our previous analysis [7] APP protein expression is reduced to about 10% of control in hippocampus whereas APLP1 remains unaltered. Simi-larly, the abundance of synaptophysin, VAMP2, SNAP25, syntaxin1, Munc18, and the neural cell adhesion molecule NCAM is unchanged in the hippocampal PAZ as compared to control. SV2A and synaptotagmin-1 are slightly increased in mutant mice.
Network analysis
To further characterize the impact of APP deletion the abundance of hippocampal constituents was visualized according to both their subcellular localization (Fig 3A, left) and their functional allocation (Fig 3B, right). The final network layout illustrates proteins as nodes and interactions (experimentally validated physical interactions) between proteins as edges (Figs3–8). The resulting 615 proteins revealed a high degree of networking, confirming their direct association with the hippocampal PAZ core proteome.
Fig 1. Overview of the experimental design.A Workflow of subcellular fractionation and immunopurification of the native hippocampal PAZ. B
cascade (green, 113), cytoskeleton (yellow, 79), and metabolic enzymes (orange, 46) (Fig 3A). The term function in a network is associated with topological features that allow insight into the con-nectivity and relationship not only of single proteins but also insight into the functional organiza-tion of a proteome (community structures). A community is a densely connected subnetwork within the PPI network of the PAZ and represents a functional module within the entire commu-nity structure. To find a linkage between proteins and their functions within the network we applied a community detection algorithm resulting in seven communities (Fig 3B).
In the next step, we mapped the relative abundance of each protein within each layout to visu-alize the impact of APP deletion on the PPI-network (Fig 3C–3F, APP-KOFig 3C and 3D, NexCre-cDKOFig 3E and 3F). Proteins affected by the deletion were highlighted in magenta (upregulation) or green (downregulation), whereas slightly affected proteins display a color-gradi-ent and non-affected proteins are in yellow (Fig 3C–3F). Within the localization and community structure network, APP deletion displays a wide distribution of up- and downregulated proteins (Fig 3C and 3D) whereas deletion of APP in NexCre-cDKO revealed a defined pattern allocating significantly dysregulated proteins to individual groups (e.g. mitochondria,Fig 3E and 3F).
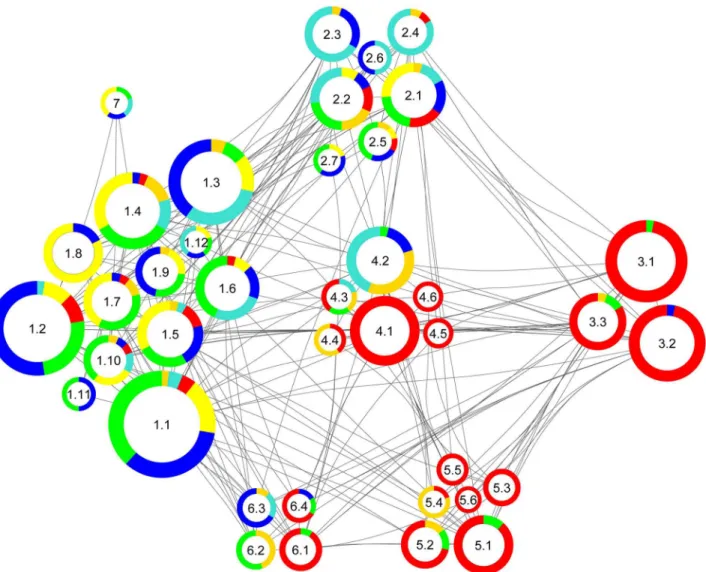
The community structure provided by Radatools does not resolve the functional structure unambiguously. Within the community structures individual protein groups (functional clus-ters) are represented, e. g. synaptic vesicle exo- and endocytosis, Ca2+-homeostasis and cyto-skeleton. Therefore, each community structure consists of a collection of proteins that belongs to individual functional cluster. This collection of proteins can be summarized under the term heterogeneity to emphasize this complex and diverse layout of the community structures. For better visualization of this“heterogenic nature”, we created a subcommunity layout represent-ing all individual functional clusters (Fig 4).
Proteins of the respective functional cluster are listed inS1 Table(Worksheet SubCom—
Subnet)
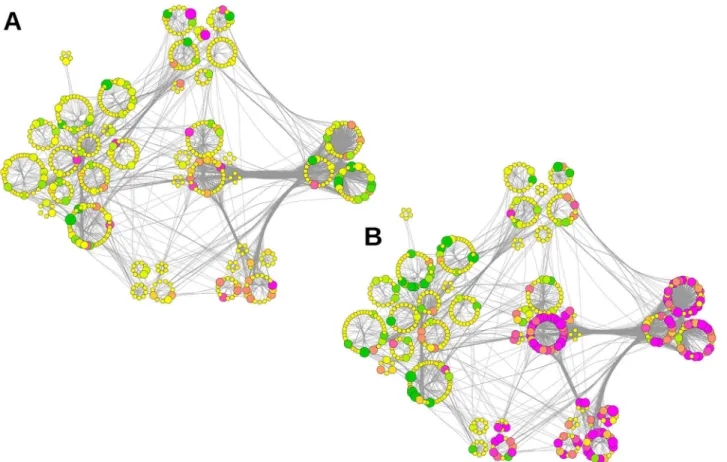
In addition, we mapped the relative abundance of each protein within the subcommunity structure layout to visualize the impact of APP deletion on the PPI network (Fig 5A, APP-KO left,Fig 5B, NexCre-cDKO right). The visualization of functional units within this network allows distinguishing differently affected clusters such as vesicle organization (2.6 inFig 4) and energy metabolism (3.2 inFig 4). Several members involved in energy metabolism are downre-gulated at the hippocampal PAZ in APP-KO mice; in contrast the majority is upredownre-gulated in NexCre-cDKO.
The analysis of subcommunity structure was a prerequisite to define the impact of APP deletion on distinct functions including synaptic vesicle cycle, cytoskeletal organization and calcium homeostasis within the hippocampal PAZ proteome. For this purpose subnetworks were created containing APP and its family members APLP1 and APLP2 (S1–S3Figs). Remarkably APP appears as a highly connected node with 70 interactions within this network with a clustering coefficient of 0.0402 and a betweenness of 0.1198 indicating a central regulat-ing function. In the synaptic vesicle cycle APP represents a hub that interacts with 22 proteins, in cytoskeleton organization with 18 proteins, and in calcium homeostasis with 20 proteins. The cluster coefficient that describes the densities of connections between neighbors in the syn-aptic vesicle cycle is 0.1125 with a betweenness of 0.4172 indicating a regulating role of APP within the network. Values for cytoskeleton organization were 0.0909 with a betweenness betweenness). Change in abundance of more than±10% is reflected by increasing sizes of nodes. The color code corresponds to the degree of
up-(magenta) and downregulation (green). Nodes in yellow represent proteins with changes in abundance of less than±10%. UF, upper fractions; LF, lower
fractions; IP, immunopurification, MB, magnetic bead; PM, plasma membrane; SV, synaptic vesicle, SC, signaling cascade; CS, cytoskeleton; ME, metabolic enzymes; MI, mitochondria; O, others.
Fig 2. Quantitative immunodetection of hippocampal PAZ constituents derived from wild type and NexCre-cDKO mice.Bar graphs are mean±SEM, n = 3.*p<0.05,**p<0.01, n.s. difference not significant. The control (APLP2-KO, wt) was set to 100%. A representative Western blot is shown below each diagram. Equal amounts of protein (150 ng) were loaded per lane. APP (100±20%, 13±1%; 110 kDa), APLP1 (100 ±8%, 92±10%, 90 kDa), Munc18 (100±6%, 117±4%, 68 kDa), NCAM (100±11%, 94±28%, 140 and 180 kDa), SNAP25 (100±17%, 103±8%, 25 kDa), SV2A (100±2%, 127±7%, 86 kDa), synaptotagmin-1 (100±1%, 124
±3%, Syt-1, 65 kDa), synaptophysin (100±7%, 97±14%, S-phys, 38 kDa), syntaxin1 (100±23%, 118±26%, 34 kDa), VAMP2 (100±1%, 106±4%, 18 kDa). Note that in NexCre-cDKO the deletion of APP is restricted to
excitatory neurons.
Fig 3. The interactome of the native hippocampal PAZ core proteome.A Proteins grouped according to their localization (localization layout). B Community structure layout (function) of the network. The size of the rings corresponds to the respective number of proteins. The color code corresponds to the pie chart diagram (cf.Fig 1E). C Impact of APP deletion on relative protein abundance mapped according to their localizations. D Impact of the APP-KO on relative protein abundance mapped according to the community structure. E Impact of the NexCre-cDKO on relative protein abundance mapped according to their localizations. F Impact of the NexCre-cDKO on relative protein abundance mapped according to the community structure. Change in abundance of more than±10% is reflected by increasing sizes of nodes. The color code corresponds to the degree of up- (magenta) and downregulation (green). Nodes in yellow represent proteins with changes in abundance of less than±10%. Each node (dot in the rings) within this network represents a
protein and each edge (connection) represents a reported physical interaction between two proteins. Edges are bundled for clarity.
0.2529 and for calcium homeostasis 0.0684 with a betweenness 0.7049 indicating that APP is not part of the cluster but a linker monitoring information flow.
Subsequently, the impact of APP deletion was mapped onto these subnetworks (APP-KO left, NexCre-cDKO right). The thickness of the connections represents the importance of the respective edges for information flow within the network (edge betweenness).
Subcommunity structure
—
synaptic vesicle cycle
In the synaptic vesicle cycle (Fig 6A)–comprising members of the cytomatrix of the active zone, SNARE complex, G-proteins, glycolysis, endocytosis, and vATPase—several proteins were downregulated (given as ratio APP-KO/control±variability in percent). These include Fig 4. Subcommunity structure of the network based onFig 3B.The color code corresponds to the pie chart diagram (cf.Fig 1E). The size of the rings corresponds to the respective number of proteins. Communities (1–7) were subdivided into the following functional clusters (e.g. 1.1–1.12): 1.1 Calcium Signaling, 1.2 Presynaptic Membrane, 1.3 Exocytosis, 1.4 Cytoskeleton Organization, 1.5 Membrane Assembly, 1.6 G-Protein Signaling, 1.7 Organelle Transport, 1.8 Actin Organization, 1.9 Synapse Assembly, 1.10 Membrane Regulation, 1.11 Inhibitory Regulation, 1.12 Vesicle Priming, 2.1 Membrane Trafficking, 2.2 Vesicle Budding, 2.3 Endocytosis, 2.4 Proton Transport, 2.5 Phospholipid Metabolism, 2.6 Vesicle Organization, 2.7 Membrane
Organization, 3.1 Electron Transport Chain, 3.2 Energy Metabolism, 3.3 Stress Defense, 4.1 Cellular Respiration, 4.2 Glycolysis, 4.3 Guanine Metabolism, 4.4 Glycerol Metabolism, 4.5 Mitochondrial Metabolism, 4.6 Mitochondrial Assembly, 5.1 Fatty Acid Catabolism, 5.2 Neurotransmitter Metabolism, 5.3 Amino Acid Catabolism, 5.4 Metabolism, 5.5 Fatty Acid Metabolism, 5.6 Mitochondrial Targeting, 6.1 Mitochondrial Protein Trafficking, 6.2 Heatshock Response, 6.3 Neuronal Regulation, 6.4 Protein Folding, 7 Functional Dynamics.
Fig 5. Relative abundance of proteins mapped to the subcommunity structure of the network.The size of the rings corresponds to the respective number of proteins. Communities were subdivided into functional clusters according to Fig 5. A Impact of APP deletion. B Impact of the NexCre-cDKO. Change in abundance of more than±10% is reflected by increasing sizes of nodes. The color code corresponds to the degree of up- (magenta) and downregulation (green). Nodes in yellow represent proteins with changes in abundance of less than±10%.
doi:10.1371/journal.pcbi.1004832.g005
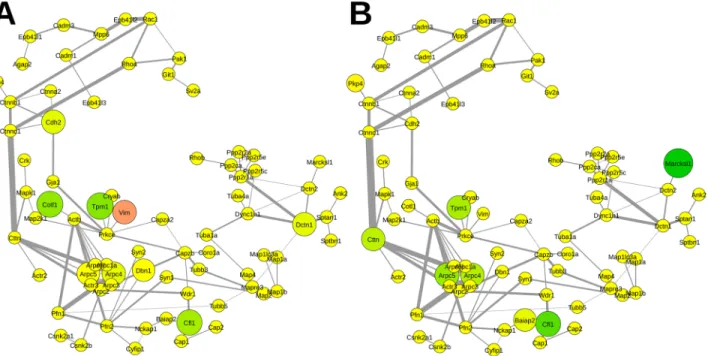
Fig 6. Relative abundance of proteins mapped to the functional subnetwork of the synaptic vesicle cycle.A Impact of APP deletion. B Impact of the NexCre-cDKO. Change in abundance of more than±10% is reflected by increasing sizes of nodes. The color code corresponds to the degree of up-(magenta) and downregulation (green). Nodes in yellow represent proteins with changes in abundance of less than±10%. Abbreviations are the respective
gene names of individual proteins as given in UniProt database and in the supplementary informationS1 Table.
α-synuclein (83.6±4.2%, Snca), syntaxin-1B (86.5±0.7%, Stx1b), ERC protein 2 (85.9±2.4%,
Erc2), guanine nucleotide-binding protein G(I)/G(S)/G(O) subunit gamma-2 (37.0±5.8%, Gng2), clathrin light chain A (69.9±11.4%, Clta) and B (80.4±2.3%, Cltb), AP-2 complex sub-unit sigma (84.9±19.1%, Ap2s1), and v-type proton ATPase subsub-unit d 1 (62.9±6.4%,
Atp6v0d1) and only a few were upregulated (given as ratio APP-KO/control±variability in per-cent) such as putative tyrosine-protein phosphatase auxilin (111.7±4.2%, Dnajc6) and synapto-physin (124.7±2.5%, Syp) while the majority remained unaltered in APP-KO mice (Fig 6A). Fig 7. Relative abundance of proteins mapped to the functional subnetwork of the cytoskeleton organization.A Impact of APP deletion. B Impact of the NexCre-cDKO. Change in abundance of more than±10% is reflected by increasing sizes of nodes. The color code corresponds to the degree of
up-(magenta) and downregulation (green). Nodes in yellow represent proteins with changes in abundance of less than±10%. Abbreviations are the respective gene names of individual proteins as given in UniProt database and in the supplementary informationS1 Table.
doi:10.1371/journal.pcbi.1004832.g007
Fig 8. Relative abundance of proteins mapped to the functional subnetwork of calcium homeostasis.A Impact of APP deletion. B Impact of the NexCre-cDKO. Change in abundance of more than±10% is reflected by increasing sizes of nodes. The color code corresponds to the degree of up-(magenta) and downregulation (green). Nodes in yellow represent proteins with changes in abundance of less than±10%. Abbreviations are the respective
gene names of individual proteins as given in UniProt database and in the supplementary informationS1 Table.
In contrast, hippocampal PAZ proteins derived from NexCre-cDKO were mainly downre-gulated (given as ratio NexCre-cDKO/control±variability in percent) (Fig 6B). The mediator of SNARE complex formationα-synuclein (52.8±3.7%, Snca) is severely downregulated whereas
members of the SNARE complex the vesicle-associated membrane protein 2 VAMP2 (85.3 ±2.1%, Vamp2), the synaptosomal-associated protein 25 SNAP25 (99.7±0.8%, Snap25), syn-taxin-1A (104.3±1.3%, Stx1a), syntaxin-1B (98.7±1.2%, Stx1b) are less or not affected. In addi-tion, downregulated proteins comprise guanine nucleotide-binding protein G(I)/G(S)/G(O) subunit gamma-2 (53.6±11.0%, Gng2), guanine nucleotide-binding protein G(I)/G(S)/G(T) subunit beta-1 (87.0±5.5%, Gnb1), members of the glycolysis cycle the L-lactate dehydrogenase A chain (87.6±2.2%, Ldha), fructose-bisphosphate aldolase A (87.5±1.6%, Aldoa), phospho-glycerate mutase 1 (87.8±2.5%, Pgam1), clathrin light chain A (89.3±3.6%, Clta) and B (81.0 ±1.4%, Cltb), the v-type proton ATPase 16 kDa proteolipid subunit (68.3±3.1%, Atp6v0c), and v-type proton ATPase subunit d 1 (81.3±2.5%, Atp5v0d1) (Fig 6B).
Subcommunity structure
—
cytoskeletal organization
APP is strongly interconnected with proteins governing cytoskeletal organization (S2 Fig). Important connections for the information flow within this network are via actin and the microtubule motor dynein. Several organizers of the cytoskeleton are affected by APP deletion (Fig 7A) such as coactosin-like protein (86.3±4.4%, Cotl1), cofilin-1 (83.1±4.7%, Cfl1), tropo-myosin alpha-1 chain (80.6±2.5%, Tpm1), and vimentin (113.9±2.6%, Vim). Especially in the NexCre-cDKO (Fig 7B) the MARCKS-related protein (74.3±7.1%, Marcksl1) that interacts with calmodulin, and actin is downregulated. Other affected proteins are cofilin-1 (83.5±2.2%, Cfl1), tropomyosin alpha-1 chain (86.7±2.8%, Tpm1), actin-related protein 2/3 complex sub-unit 4 (87.1±0.4%, Arpc4) and subsub-unit 5 (86.1±1.0%, Arpc5), and the src substrate cortactin (87.4±4.4%, Cttn).
Subcommunity structure
—
calcium homeostasis
The protein network of calcium homeostasis reveals that APP is a central regulator (S3 Fig) that is interconnected with e.g. bassoon, neural cell adhesion molecule 1, neural cell adhesion molecule L1, neuromodulin, SNAP-25, and neuroplastin. In the hippocampal PAZ derived from APP-KO mice neuromodulin (79.0±1.0%, Gap43), the guanine nucleotide-binding pro-tein G(I)/G(S)/G(O) subunit gamma-2 (37.0±5.8%, Gng2),α-synuclein (83.6±4.2%, Snca),
brain acid soluble protein 1 (80.1±4.3%, Basp1), and calmodulin (30.9±17.8%, Calm) are downregulated (Fig 8A). Mapping the change in protein abundance derived from NexCre-cDKO demonstrates the downregulation of calmodulin (54.2±14.3%, Calm) with its modulator neuromodulin (72.0±2.6%, Gap43), brain acid soluble protein 1 (63.6±1.1%, Basp1), myristoy-lated alanine-rich C-kinase substrate MARCKS (61.3±8.0%, Marcks),α-synuclein (52.8±3.7%,
Snca), vesicle-associated membrane protein 2 VAMP2 (85.3±2.1%, Vamp2), neuronal mem-brane glycoprotein M6-a (83.4±8.5%, Gpm6a), guanine nucleotide-binding protein G(I)/G(S)/ G(T) subunit beta-1 (87.0±5.5%, Gnb1), and the guanine nucleotide-binding protein G(I)/G (S)/G(O) subunit gamma-2 (53.6±11.0%, Gng2). Neural cell adhesion molecule L1 (114.0 ±3.1%, L1cam) and protein kinase C gamma type (112.6±1.1%, Prkcg) reveal an increase in protein abundance (Fig 8B).
Discussion
APP-mutants. This allowed us to trace alterations within the proteomic composition resulting from the deletion of APP. Proteins were structurally and functionally sorted and related to their physiological tasks. The analysis of APP mutant mice revealed that deletion of APP results in changes in abundance of proteins involved in synaptic vesicle exocytosis, cytoskeletal organiza-tion and calcium-signaling. In this context, we address the quesorganiza-tion, how APP is funcorganiza-tionally integrated into these subcommunities of proteins.
APP is a hub at the active zone
The application of network analysis by e.g. centrality and path length, visualization techniques, and functional analysis by subcommunity structures allowed insights into the changes of pro-tein abundance following APP deletion. APP is highly interconnected in all networks analyzed and serves as a hub, implicating that it is important for the structure and function of the entire network. The high value for betweenness centrality indicates a bridging role of APP between the functional modules. The low values for the clustering coefficient supports the linking func-tion of APP in the interacfunc-tion network of the hippocampal PAZ. APP and its interactors are central in the information flow as indicated by the high value for edge betweenness. For exam-ple, APP interacts with bassoon physically [38] and is thereby embedded into the cytomatrix of the active zone (CAZ). Interactors of bassoon are in turn the ERC protein 2, piccolo and regu-lating synaptic membrane exocytosis protein 1. Deletion of APP leads to a decomposition and rearrangement of the entire network structure. This network is based on current database knowledge about physical interactions between proteins. Therefore APP deletion results in loss of network components. Interestingly, this is not reflected by a loss of biological functions. For example following APP deletion bassoon and its interactors are still part of the synaptic vesicle cycle. However they are no longer connected in cytoskeleton organization and calcium homeo-stasis subnetworks. In addition reorganization of the network results in changes in path lengths. For example in the synaptic vesicle cycle the vesicular proton pump vATPase and bas-soon are linked via APP. Deletion of APP results in an increase in the shortest path length by three steps (interactions). Similarly, in calcium homeostasis loss of APP extends the shortest path length from extracellular cell adhesion (e.g. NCAM1) to trimeric G-proteins involved in intracellular signaling by three interactions. In contrast deletion of APP adds three additional interactions (4!7) from the homophilic cell-cell adhesion molecule 1, that acts in a calcium
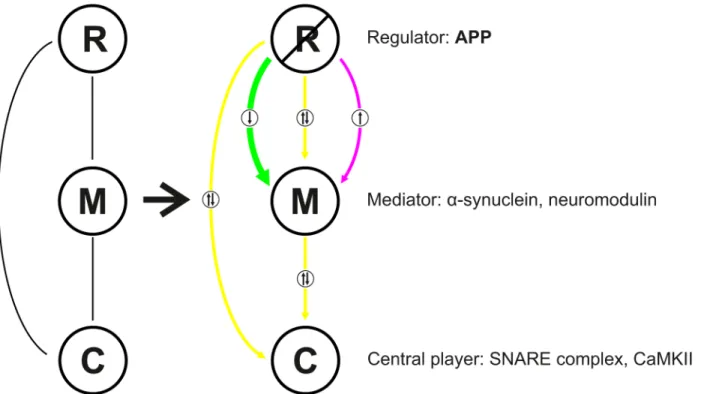
independent manner, to the actin-related protein complex. Based on our data, we hypothesize that APP functions as a regulator involved in all functional activities at the release sites. Depending on its respective microenvironment it may exert varying functions. This is illus-trated in a scheme (Fig 9) which depicts the physical interaction between APP (regulator, R), mediators (M) and central players (C). Deletion of APP results in significant changes in the abundance of mediators but not of central players. For example the mediator of synaptic vesicle exocytosisα-synuclein [39] is downregulated in the mutants, however the central players the SNARE proteins VAMP2, SNAP25, and syntaxin1 [13] are not affected. In this context it is noteworthy to mention that deletion of SV2A does not affect the abundance of SNARE pro-teins but results in reduced SNARE complex formation [40]. Similarly, the mediators in cal-cium homeostasis calmodulin and neuromodulin are downregulated whereas the central player in learning and memory CaMKII as well as calcium-channels remain unaltered.
APP regulates active zone players
presynaptic signaling and neurotransmitter release by activation of calcium-channels [41]. A selective interaction of APP with the neural cell adhesion molecule NCAM has been reported [42]. NCAM-induced activation of calcium-channels is a downstream effect of signaling through heterotrimeric G-proteins [43]. Our PPI network displays APP interaction via Munc18 with calcium/calmodulin activated Ser-Thr kinase CASK that is recruited to the cyto-solic tail of neurexin-1 [44]. CASK may recruit calcium-channels to the presynapse [45] pro-viding strong support that the presynaptic function of APP is mediated through similar mechanisms [46]. The APP-Mint1-Cask complex has also been implicated in neurexin-medi-ated signaling in presynaptic organization [47,48].
This complex is thought to play a regulatory role in synaptic vesicle release, and may be involved in development and maintenance of synaptic architecture [49]. The physical interac-tion of APP with bassoon [38] regulates the recruitment of ERC protein 2 (ELKS), RIM, and Munc13 that are involved in the recruitment of Ca2+-channels [13]. The regulatory impact of
APP on the abundance of Ca2+-channels at the presynaptic plasma membrane [50] points to a functional integration of APP within this conserved network of the active zone key players. Fur-thermore, our data suggest, that APP is physically implemented into synaptic vesicles exocytosis. The link is provided byα-synuclein an essential mediator of SNARE-complex formation [39].
How APP andα-synuclein are connected to each other is still elusive and needs to be further
investigated. However, embedding APP as a context-sensitive regulator into the active zone net-work supports the notion of a physiological role in synaptic transmission and plasticity.
Taken together, our findings provide a new perspective of the functional integration of APP into the hippocampal PAZ proteome. Furthermore, our network analysis incorporates APP into the evolutionary conserved active zone protein complex, comprising ELKS, CASK, as well as bassoon, Rim and Munc18. The coordinated arrangement of these proteins mediating Fig 9. Scheme illustrating the regulatory role of APP in a context-sensitive manner at the hippocampal PAZ. R, regulator; M, mediator, C, central player.Color code: magenta, upregulation (in APP-mutants); green, downregulation (in APP-mutants); yellow, unaltered.
synaptic vesicle docking and priming is essential for neuronal signaling. Interestingly, this sub-network persists after APP deletion maintaining functional neurotransmission. We could dem-onstrate that deletion of APP differently affects individual PAZ subcommunities. Our results suggest, APP acts as a context-sensitive regulator within the presynaptic proteome linked to neuronal communication. Future studies have to reveal how APP deletion affects these sub-communities in a spatiotemporal way that eventually lead to impairments in learning and memory. These alterations may provide a molecular link to the pathogenesis of Alzheimer’s disease and open new strategies for therapeutic approaches.
Supporting Information
S1 Table. Hippocampal PAZ proteome.List of the hippocampal PAZ core proteome derived from APP-mutants, n = 12. Worksheet 1“Overlap (APP)”: core constituents are sorted by the ratio APP-KO/wt in an ascending order. Worksheet 2“Overlap (NexCre)”: core constituents are sorted by the ratio NexCre/wt in an ascending order). The graph displays the distribution of identified proteins according to their changes in abundance (APP/wt, and NexCre/wt).
Proteins of the respective functional cluster (Fig 4;subcommunities structure) are listed and their assignment to eitherfunctional subnetworkof the synaptic vesicle cycle (Fig 6),functional
subnetworkof the cytoskeletal organization (Fig 7), orfunctional subnetworkof the
calcium-homeostasis (Fig 8) is highlighted by an asterisk. (XLSX)
S1 Fig. Functional subnetwork of the synaptic vesicle cycle.Functional subnetworkof the synaptic vesicle cycle including APP and its family members APLP1 and APLP2. The color code corresponds to the pie chart diagram. Of note, APP appears as a highly connected node within this network. Abbreviations are the respective gene names of individual proteins as given in UniProt database and in the supplementary informationS1 Table.
(PDF)
S2 Fig. Functional subnetwork of the cytoskeleton.Functional subnetworkof cytoskeleton organization including APP and its family members APLP1 and APLP2. The color code corre-sponds to the pie chart diagram. Of note, APP appears as a highly connected node within this network. Abbreviations are the respective gene names of individual proteins as given in Uni-Prot database and in the supplementary informationS1 Table.
(PDF)
S3 Fig. Functional subnetwork of the calcium homeostasis.Functional subnetworkof cal-cium homeostasis including APP and its family members APLP1 and APLP2. The color code corresponds the pie chart diagram. Of note, APP appears as a highly connected node within this network. Abbreviations are the respective gene names of individual proteins as given in UniProt database and in the supplementary informationS1 Table.
(PDF)
S1 Text. Information about the PPI network.Binary protein-protein interaction (PPI) data were extracted from protein interaction databases (February 2015). Here, additional informa-tion about PPI networks is provided.
(PDF)
Acknowledgments
We thank Julia Gobbert for technical assistance with the NexCreAPP/APLP2-cDKO mice. We are grateful to Herbert Zimmermann for valuable suggestions.
Author Contributions
Conceived and designed the experiments: ML JW MW WV. Performed the experiments: ML JW MW BFM MR TNA. Analyzed the data: ML JW MW BFM MR WV. Contributed reagents/ materials/analysis tools: DB MH JA AAP IK UM MK. Wrote the paper: ML JW MW WV.
References
1. Leuner K, Muller WE, Reichert AS. From mitochondrial dysfunction to amyloid beta formation. novel insights into the pathogenesis of Alzheimer's disease. Molecular neurobiology. 2012; 46: 186–193. doi:10.1007/s12035-012-8307-4PMID:22833458
2. Iqbal K, Grundke-Iqbal I, Zaidi T, Merz PA, Wen GY, Shaikh SS, et al. Defective brain microtubule assembly in Alzheimer's disease. Lancet. 1986; 2: 421–426. PMID:2874414
3. Grundke-Iqbal I, Iqbal K, Tung YC, Quinlan M, Wisniewski HM, Binder LI. Abnormal phosphorylation of the microtubule-associated protein tau (tau) in Alzheimer cytoskeletal pathology. Proceedings of the National Academy of Sciences of the United States of America. 1986; 83: 4913–4917. PMID:3088567 4. Glenner GG, Wong CW. Alzheimer's disease and Down's syndrome. sharing of a unique
cerebrovascu-lar amyloid fibril protein. Biochemical and biophysical research communications. 1984; 122: 1131– 1135. PMID:6236805
5. Kang J, Lemaire HG, Unterbeck A, Salbaum JM, Masters CL, Grzeschik KH, et al. The precursor of Alz-heimer's disease amyloid A4 protein resembles a cell-surface receptor. Nature. 1987; 325: 733–736. doi:10.1038/325733a0PMID:2881207
6. Weyer SW, Zagrebelsky M, Herrmann U, Hick M, Ganss L, Gobbert J, et al. Comparative analysis of single and combined APP/APLP knockouts reveals reduced spine density in APP-KO mice that is pre-vented by APPsαexpression. Acta Neuropathol Commun. 2014; 2: 36. doi:10.1186/2051-5960-2-36 PMID:24684730
7. Hick M, Herrmann U, Weyer SW, Mallm J, Tschäpe J, Borgers M, et al. Acute function of secreted amy-loid precursor protein fragment APPsαin synaptic plasticity. Acta Neuropathol. 2015; 129: 21–37. doi: 10.1007/s00401-014-1368-xPMID:25432317
8. Weyer SW, Klevanski M, Delekate A, Voikar V, Aydin D, Hick M, et al. APP and APLP2 are essential at PNS and CNS synapses for transmission, spatial learning and LTP. The EMBO journal. 2011; 30: 2266–2280. doi:10.1038/emboj.2011.119PMID:21522131
9. Priller C, Bauer T, Mitteregger G, Krebs B, Kretzschmar HA, Herms J. Synapse formation and function is modulated by the amyloid precursor protein. The Journal of neuroscience: the official journal of the Society for Neuroscience. 2006; 26: 7212–7221. doi:10.1523/jneurosci.1450-06.2006
10. Ring S, Weyer SW, Kilian SB, Waldron E, Pietrzik CU, Filippov MA, et al. The secreted beta-amyloid precursor protein ectodomain APPs alpha is sufficient to rescue the anatomical, behavioral, and electrophysiological abnormalities of APP-deficient mice. The Journal of neuroscience: the official jour-nal of the Society for Neuroscience. 2007; 27: 7817–7826. doi:10.1523/jneurosci.1026-07.2007 11. Lassek M, Weingarten J, Einsfelder U, Brendel P, Muller U, Volknandt W. Amyloid precursor proteins
are constituents of the presynaptic active zone. Journal of neurochemistry. 2013; 127: 48–56. doi:10. 1111/jnc.12358PMID:23815291
12. Sudhof TC. A molecular machine for neurotransmitter release. synaptotagmin and beyond. Nature medicine. 2013; 19: 1227–1231. doi:10.1038/nm.3338PMID:24100992
13. Sudhof TC. The presynaptic active zone. Neuron. 2012; 75: 11–25. doi:10.1016/j.neuron.2012.06.012 PMID:22794257
14. Weingarten J, Laßek M, Mueller B, Rohmer M, Baeumlisberger D, Beckert B, et al. Regional Specializa-tions of the PAZ Proteomes Derived from Mouse Hippocampus, Olfactory Bulb and Cerebellum. Prote-omes. 2015; 3: 74–88. doi:10.3390/proteomes3020074
16. Goebbels S, Bormuth I, Bode U, Hermanson O, Schwab MH, Nave KA. Genetic targeting of principal neurons in neocortex and hippocampus of NEX-Cre mice. Genesis (New York, N.Y.: 2000). 2006; 44: 611–621. doi:10.1002/dvg.20256
17. Li ZW, Stark G, Gotz J, Rulicke T, Gschwind M, Huber G, et al. Generation of mice with a 200-kb amy-loid precursor protein gene deletion by Cre recombinase-mediated site-specific recombination in embryonic stem cells. Proceedings of the National Academy of Sciences of the United States of Amer-ica. 1996; 93: 6158–6162. PMID:8650236
18. Whittaker VP, Michaelson IA, Kirkland RJ. The separation of synaptic vesicles from nerve-ending parti-cles ('synaptosomes'). The Biochemical journal. 1964; 90: 293–303. PMID:5834239
19. Weingarten J, Lassek M, Mueller BF, Rohmer M, Lunger I, Baeumlisberger D, et al. The proteome of the presynaptic active zone from mouse brain. Molecular and cellular neurosciences. 2014; 59C: 106– 118. doi:10.1016/j.mcn.2014.02.003
20. Laemmli UK. Cleavage of structural proteins during the assembly of the head of bacteriophage T4. Nature. 1970; 227: 680–685. PMID:5432063
21. Xenarios I, Rice DW, Salwinski L, Baron MK, Marcotte EM, Eisenberg D. DIP: the database of interact-ing proteins. Nucleic Acids Res. 2000; 28: 289–291. PMID:10592249
22. Hermjakob H, Montecchi-Palazzi L, Lewington C, Mudali S, Kerrien S, Orchard S, et al. IntAct: an open source molecular interaction database. Nucleic Acids Res. 2004; 32: D452–5. doi:10.1093/nar/ gkh052PMID:14681455
23. Zanzoni A, Montecchi-Palazzi L, Quondam M, Ausiello G, Helmer-Citterich M, Cesareni G. MINT. A Molecular INTeraction database. FEBS Letters. 2002; 513: 135–140. doi:10.1016/S0014-5793(01) 03293-8PMID:11911893
24. Orchard S, Ammari M, Aranda B, Breuza L, Briganti L, Broackes-Carter F, et al. The MIntAct project— IntAct as a common curation platform for 11 molecular interaction databases. Nucleic Acids Res. 2014; 42: D358–63. doi:10.1093/nar/gkt1115PMID:24234451
25. Stark C, Breitkreutz B, Reguly T, Boucher L, Breitkreutz A, Tyers M. BioGRID: a general repository for interaction datasets. Nucleic Acids Res. 2006; 34: D535–9. doi:10.1093/nar/gkj109PMID:16381927 26. Calderone A, Castagnoli L, Cesareni G. mentha: a resource for browsing integrated protein-interaction
networks. Nat Methods. 2013; 10: 690–691. doi:10.1038/nmeth.2561PMID:23900247
27. Razick S, Magklaras G, Donaldson IM. iRefIndex: a consolidated protein interaction database with provenance. BMC Bioinformatics. 2008; 9: 405. doi:10.1186/1471-2105-9-405PMID:18823568 28. Franceschini A, Szklarczyk D, Frankild S, Kuhn M, Simonovic M, Roth A, et al. STRING v9.1:
protein-protein interaction networks, with increased coverage and integration. Nucleic Acids Res. 2013; 41: D808–15. doi:10.1093/nar/gks1094PMID:23203871
29. Orchard S, Kerrien S, Abbani S, Aranda B, Bhate J, Bidwell S, et al. Protein interaction data curation: the International Molecular Exchange (IMEx) consortium. Nat Methods. 2012; 9: 345–350. doi:10. 1038/nmeth.1931PMID:22453911
30. Shannon P, Markiel A, Ozier O, Baliga NS, Wang JT, Ramage D, et al. Cytoscape: a software environ-ment for integrated models of biomolecular interaction networks. Genome Res. 2003; 13: 2498–2504. doi:10.1101/gr.1239303PMID:14597658
31. Arenas A, Duch J, Fernández A, Gómez S. Size reduction of complex networks preserving modularity. New J. Phys. 2007; 9: 176. doi:10.1088/1367-2630/9/6/176
32. Newman MEJ, Girvan M. Finding and evaluating community structure in networks. Phys Rev E Stat Nonlin Soft Matter Phys. 2004; 69: 26113.
33. Arenas A, Fernández A, Gómez S. Analysis of the structure of complex networks at different resolution levels. New J. Phys. 2008; 10: 53039. doi:10.1088/1367-2630/10/5/053039
34. Duch J, Arenas A. Community detection in complex networks using extremal optimization. Phys. Rev. E. 2005; 72. doi:10.1103/PhysRevE.72.027104
35. Newman MEJ. Fast algorithm for detecting community structure in networks. Phys. Rev. E. 2004; 69. doi:10.1103/PhysRevE.69.066133
36. Newman MEJ. Modularity and community structure in networks. Proc Natl Acad Sci U S A. 2006; 103: 8577–8582. doi:10.1073/pnas.0601602103PMID:16723398
37. Lassek M, Weingarten J, Acker-Palmer A, Bajjalieh SM, Muller U, Volknandt W. Amyloid precursor pro-tein knockout diminishes synaptic vesicle propro-teins at the presynaptic active zone in mouse brain. Cur-rent Alzheimer research. 2014; 11: 971–980. PMID:25387333
neuroscience: the official journal of the Society for Neuroscience. 2010; 30: 15677–15685. doi:10. 1523/jneurosci.4464-10.2010
39. Burre J, Sharma M, Tsetsenis T, Buchman V, Etherton MR, Sudhof TC. Alpha-synuclein promotes SNARE-complex assembly in vivo and in vitro. Science (New York, N.Y.). 2010; 329: 1663–1667. doi: 10.1126/science.1195227
40. Xu T, Bajjalieh SM. SV2 modulates the size of the readily releasable pool of secretory vesicles. Nature cell biology. 2001; 3: 691–698. doi:10.1038/35087000PMID:11483953
41. Fogel H, Frere S, Segev O, Bharill S, Shapira I, Gazit N, et al. APP homodimers transduce an
amyloid-β-mediated increase in release probability at excitatory synapses. Cell Rep. 2014; 7: 1560–1576. doi: 10.1016/j.celrep.2014.04.024
42. Chen K, Dou F. Selective interaction of amyloid precursor protein with different isoforms of neural cell adhesion molecule. J Mol Neurosci. 2012; 46: 203–209. doi:10.1007/s12031-011-9578-3PMID: 21691800
43. Hansen RK, Christensen C, Korshunova I, Kriebel M, Burkarth N, Kiselyov VV, et al. Identification of NCAM-binding peptides promoting neurite outgrowth via a heterotrimeric G-protein-coupled pathway. J Neurochem. 2007; 103: 1396–1407. doi:10.1111/j.1471-4159.2007.04894.xPMID:17854387 44. Mukherjee K, Sharma M, Urlaub H, Bourenkov GP, Jahn R, Südhof TC, et al. CASK Functions as a
Mg2+-independent neurexin kinase. Cell. 2008; 133: 328–339. doi:10.1016/j.cell.2008.02.036PMID: 18423203
45. Maximov A, Sudhof TC, Bezprozvanny I. Association of Neuronal Calcium Channels with Modular Adaptor Proteins. Journal of Biological Chemistry. 1999; 274: 24453–24456. doi:10.1074/jbc.274.35. 24453PMID:10455105
46. Wang Z, Wang B, Yang L, Guo Q, Aithmitti N, Songyang Z, et al. Presynaptic and postsynaptic interac-tion of the amyloid precursor protein promotes peripheral and central synaptogenesis. The Journal of neuroscience: the official journal of the Society for Neuroscience. 2009; 29: 10788–10801. doi:10. 1523/jneurosci.2132-09.2009
47. Barbagallo AP, Wang Z, Zheng H, D'Adamio L. A single tyrosine residue in the amyloid precursor pro-tein intracellular domain is essential for developmental function. The Journal of biological chemistry. 2011; 286: 8717–8721. doi:10.1074/jbc.C111.219873PMID:21266574
48. Biederer T, Sara Y, Mozhayeva M, Atasoy D, Liu X, Kavalali ET, et al. SynCAM, a synaptic adhesion molecule that drives synapse assembly. Science (New York, N.Y.). 2002; 297: 1525–1531. doi:10. 1126/science.1072356
49. Jin Y, Garner CC. Molecular mechanisms of presynaptic differentiation. Annu Rev Cell Dev Biol. 2008; 24: 237–262. doi:10.1146/annurev.cellbio.23.090506.123417PMID:18588488