SRef-ID: 1432-0576/ag/2006-24-163 © European Geosciences Union 2006
Annales
Geophysicae
A global climatology for equatorial plasma bubbles in the topside
ionosphere
L. C. Gentile1, W. J. Burke2, and F. J. Rich2
1Institute for Scientific Research, Boston College, Chestnut Hill, MA, USA
2Space Vehicles Directorate, Air Force Research Laboratory, Hanscom AFB, MA, USA
Received: 8 April 2006 – Revised: 18 November 2005 – Accepted: 21 December 2005 – Published: 7 March 2006
Abstract.We have developed a global climatology of equa-torial plasma bubble (EPB) occurrence based on evening sec-tor plasma density measurements from polar-orbiting De-fense Meteorological Satellite Program (DMSP) spacecraft during 1989–2004. EPBs are irregular plasma density deple-tions in the post-sunset ionosphere that degrade communica-tion and navigacommunica-tion signals. More than 14 400 EPBs were identified in∼134 000 DMSP orbits. DMSP observations basically agree with Tsunoda’s (1985) hypothesis that EPB rates peak when the terminator is aligned with the Earth’s magnetic field, but there are also unpredicted offsets in many longitude sectors. We present an updated climatology for the full database from 1989–2004 along with new plots for specific phases of the solar cycle: maximum 1989–1992 and 1999–2002, minimum 1994–1997, and transition years 1993, 1998, and 2003. As expected, there are significant differ-ences between the climatologies for solar maximum and min-imum and between the two solar maxmin-imum phases as well. We also compare DMSP F12, F14, F15, and F16 observa-tions at slightly different local times during 2000–2004 to examine local time effects on EPB rates. The global clima-tologies developed using the DMSP EPB database provide an environmental context for the long-range prediction tools under development for the Communication/Navigation Out-age Forecasting System (C/NOFS) mission.
Keywords. Ionosphere (Electric fields and currents; Equa-torial ionosphere; Plasma waves and instabilities)
1 Introduction
In preparation for the Communication/Navigation Outage Forecasting System (C/NOFS) mission, we examined plasma density measurements from sensors on spacecraft of the De-fense Meteorological Satellite Program (DMSP) and devel-oped a global climatology of equatorial plasma bubble (EPB) occurrence to facilitate improvements in ionospheric models. Correspondence to:L. C. Gentile
EPBs are nonlinear evolutions of the generalized Rayleigh-Taylor (R-T) instability in the post-sunset ionosphere in which bottomside plasma interchanges with plasma near and above the peak of the F-layer. Plasma irregularities with scale sizes of meters to kilometers form within these den-sity depletions. As these large-scale irregularities propagate into the topside ionosphere, the smaller-scale irregularities within them diffract radio waves and cause severe degrada-tion of communicadegrada-tion and navigadegrada-tion signals at low mag-netic latitudes. The C/NOFS mission objective is to learn to forecast the low-latitude ionospheric disturbances that cause these disruptions.
As a guide for our EPB studies we use a formula for the linear growth rateγ of the generalized R-T instability de-rived by Zalesak and Ossakow (1982) and adapted by Sultan (1996):
γ = 6
F P
6PE+6PF Vp−U P n −
gL
νineff
!
1 Ln
−RT , (1)
where gLrepresents the downward acceleration due to grav-ity, Vp=E×B/B2the vertical component of plasma drift due to the zonal component of the electric fieldEat the magnetic equator, UPn the vertical component of neutral wind veloc-ity perpendicular toB, andνineff the effective, flux-tube in-tegrated, F-region, ion-neutral collision frequency weighted by number density in the flux tube. Lnis the scale length of the vertical gradient of the flux-tube integrated plasma den-sity measured at the equator. RTis the flux-tube integrated recombination rate (Basu, 1997). 6PE and6PF are the con-tributions to6P from the E and F regions, respectively. Ln is positive in the bottomside of the F-layer in the post-sunset ionosphere. Eastward components ofEand downward com-ponents ofUPncontribute to a positive growth rateγ. Growth periods, 1/γ, are generally∼10 min, and large-amplitude ir-regularities develop over several growth periods. Sincegand
Bare constants at a given location, R-T growth rates are con-trolled by the variability of E0, UPn,6EP,6PF,ν
eff
164 L. C. Gentile et al.: A global climatology for equatorial plasma bubbles There is a relatively small window of opportunity in the
post sunset ionosphere for EPBs to develop. Shortly after dusk, as polarization charges increase in the vicinity of the terminator, the ionosphere rises and instabilities form. As the vertical drift slows and reverses, the formation of instabil-ities is inhibited. The seasonal-longitudinal model of Tsun-oda (1985) predicted that EPB rates should peak near times whenα, the angle between the magnetic declinationδ and the dusk terminator, is equal to zero, and the E-region con-ductance allows bubbles to grow most rapidly.
DMSP spacecraft fly in circular, sun-synchronous polar orbits at an altitude of 848 km and an inclination of 98.7◦. The orbital trajectories of the spacecraft used this study F9, F10, F12, F14, F15, and F16 all cross the magnetic equator in the post-sunset local time (LT) sector (19:00–22:00 LT). With the exception of F9, the ascending nodes of the space-craft are on the dusk side of the Earth. “Sun-synchronous” orbits are fixed with respect to the mean LT. Over the course of a year, the true solar position varies by a few minutes around the mean LT, and drag lowers the orbit by about a kilometer. The initial orbits of F10 and F12 were not quite sun-synchronous. In all cases, the LT changes at a rate of
∼30 min or less per year on orbit.
Although it may seem unusual to employ polar-orbiting satellites to study equatorial phenomena, Burke et al. (2003, 2004a,b) and Huang et al. (2001, 2002) developed an initial global climatology of EPB occurrence that clearly demon-strated the utility of DMSP spacecraft as useful platforms for EPB observations. Huang et al. (2001) surveyed EPB activity during solar maximum years 1989 and 1991. Seasonal versus longitudinal distributions of EPBs were in general agreement with previously reported satellite and ground-based measure-ments (Aarons, 1993) as well as the stormtime model of Scherliess and Fejer (1997). Huang et al. (2001) also found that the number of EPBs increased during the early stages of geomagnetic storms, but was suppressed during recovery. Encouraged by this success, Huang et al. (2002) extended their study to include seasonal and longitudinal distributions of EPBs from multiple DMSP spacecraft over a full solar cy-cle from 1989–2000. Their results suggest that penetration electric fields are the driving force behind many stormtime EPBs. Burke et al. (2003) then compared DMSP EPB obser-vations with coordinated ground measurements from the Ji-camarca unattended long-term studies of the ionosphere and atmosphere (JULIA) radar and a scintillation monitor in An-con, Peru, and determined that the seasonally averaged oc-currence rates correlated closely despite the fact that many ionospheric disturbances that cause S4 fluctuations do not reach DMSP altitudes. Burke et al. (2003) also concluded that EPBs tend to occur in sporadic clusters rather than at regular intervals.
Burke et al. (2004a) then presented a global climatology of EPB rates for a full solar cycle 1989–2000 in a color contour plot similar to equatorial spread F occurrence pat-terns devised by Sultan (priv. comm., 2000). In general, the Burke et al. (2004a) climatology agreed with Tsunoda’s (1985) model, but unpredicted offsets were evident in several
longitude sectors, particularly in the Atlantic-Africa region. Burke et al. (2004b) updated the climatology for 1989–2002 and demonstrated that DMSP EPB observations were well-correlated with plasma density measurements from the Re-public of China Satellite (ROCSAT-1) in a 35◦ inclination orbit at 650 km when the satellites crossed the same longi-tude sector within +/–15 min. Furthermore, the occurrence rates of EPBs observed by ROCSAT-1 peaked around the LT of the orbital paths of the DMSP satellites, confirming that the spacecraft were well-placed to observe EPBs. Both DMSP and ROCSAT-1 observed the vast majority of the EPBs within +/–20◦of the equator (Burke et al., 2004b).
Burke et al. (2004b) also examined scintillation measure-ments from a network of GPS receivers in South America. Based on unexpected minima in EPB rates near the west coast of South America and significant differences in scin-tillation measurements looking east and west from receiver sites, they proposed that particle precipitation from the in-ner radiation belt affects global distributions of EPBs and the climatology of radiowave scintillations. Enhanced drift loss cone precipitation of inner belt electrons to the west of the South Atlantic Anomaly (Luhmann and Vampola, 1977) would increase E-layer conductance and thus inhibit nonlin-ear EPB growth. This present study provides a more detailed picture of trends in EPB rates with new climatology plots for specific phases of the solar cycle and compares F12, F14, F15, and F16 results at various local times for 2000–2004. The long range objective is to facilitate improvements in ionospheric models that will enhance our ability to forecast and nowcast ionospheric disturbances during the C/NOFS era.
2 Instrumentation
Table 1.Summary of DMSP EPB observations by year, spacecraft, LT of spacecraft orbit, number of orbits, number of orbits with EPBs, and number of orbits with EPBs classified by the depth of the deepest depletionδN with respect to the nearby undisturbed plasma density: M-0 ifδN≤2; M-1 if 2<δN≤10; M-2 if 10<δN≤100; M-3 ifδN>100 (c.f. Fig. 1 of Huang et al., 2001).
Year Satellite LT (Hr) Orbits EPBs M-0 M-1 M-2 M-3
1989 F09 21 5121 1109 297 762 50 0
1990 F09 20.9 5091 1089 289 735 62 3
1991 F09 20.7 5040 1024 304 664 55 1
1991 F10 20 4925 675 218 351 86 20
1992 F10 20.7 5043 755 306 406 41 2
1993 F10 21.3 5092 389 186 191 11 1
1994 F10 21.7 3749 121 53 58 10 0
1994 F12 21.4 1575 42 33 8 1 0
1995 F12 21.4 4976 130 51 71 8 0
1996 F12 21.5 5122 73 35 36 2 0
1997 F12 21.4 3343 47 24 23 0 0
1997 F14 20.6 3104 51 18 32 1 0
1998 F12 21.2 4123 283 106 169 7 1
1998 F14 20.7 4993 275 129 138 8 0
1999 F12 20.8 4290 431 83 330 13 5
1999 F14 20.8 4839 460 167 285 6 2
2000 F12 20.3 4556 637 85 509 41 2
2000 F14 20.7 4969 821 298 493 26 4
2000 F15 21.3 5060 1034 377 620 30 7
2001 F12 19.8 4557 404 60 305 34 5
2001 F14 20.6 4787 861 174 643 38 6
2001 F15 21.5 5095 1014 292 699 20 3
2002 F14 20.3 4889 781 160 563 55 3
2002 F15 21.5 5113 991 279 672 40 0
2003 F14 19.9 4732 156 37 108 5 6
2003 F15 21.4 5149 385 84 275 15 11
2004 F14 19.6 4777 30 10 14 6 0
2004 F15 21.3 5123 267 63 180 14 10
2004 F16 19.9 5131 77 18 51 7 1
Totals 134364 14412 4236 9391 692 93
3 Observations
This study extends the EPB climatology of Burke et al. (2004a, b) with additional data from F12 for 1999–2000, F14 and F15 for 2003, and F14, F15, and F16 for 2004. Table 1 summarizes the DMSP EPB observations by year, spacecraft, LT of the spacecraft orbit, number of orbits, num-ber of orbits with EPBs, and numnum-ber of orbits with EPBs classified by the depth of the deepest depletion δN with respect to the nearby undisturbed plasma density: M-0 if δN≤2; M-1 if 2<δN≤10; M-2 if 10 <δN≤100; M-3 if δN>100 (c.f. Fig. 1 of Huang et al. (2001)). Plasma irreg-ularities within the depletions made it difficult to count indi-vidual EPBs; each cluster was classified as one EPB accord-ing to the depth of the deepest depletion duraccord-ing that equato-rial pass. Data were sorted by the longitude of the satellite’s equatorial crossing rather than the specific longitude of indi-vidual EPBs.
166 L. C. Gentile et al.: A global climatology for equatorial plasma bubbles
Table 2.Number of DMSP orbits per month in each longitude sector for the full DMSP EPB database 1989–2004.
Longitude Jan Feb Mar Apr May Jun Jul Aug Sept Oct Nov Dec
-180 364 339 359 351 385 368 409 391 372 381 348 378
-165 394 392 398 404 433 421 428 418 435 428 366 447
-150 441 396 443 424 451 454 469 457 464 462 430 450
-135 463 442 473 468 485 468 477 473 484 491 453 474
-120 472 414 461 437 473 459 487 477 483 475 430 479
-105 450 424 464 452 475 456 478 468 466 467 449 455
-90 451 422 450 453 481 472 481 476 482 475 437 470
-75 486 434 495 469 505 492 490 504 487 486 469 468
-60 499 481 505 501 528 517 522 522 537 538 483 518
-45 531 481 516 508 531 524 527 548 529 537 504 525
-30 495 452 496 480 504 487 499 509 520 507 464 489
-15 457 430 454 470 481 461 482 471 489 488 453 470
0 477 430 481 461 482 470 490 486 489 503 466 496
15 447 415 454 446 468 450 456 459 473 478 415 458
30 461 431 465 456 470 464 480 463 469 463 433 475
45 468 427 471 452 483 459 485 490 481 481 442 471
60 467 442 479 476 487 477 493 489 473 486 457 475
75 457 427 484 467 482 463 496 487 487 476 455 483
90 464 438 463 452 484 471 484 495 487 489 443 480
105 484 431 480 459 473 472 475 482 487 506 455 455
120 461 445 478 473 489 466 473 488 490 490 450 483
135 477 428 472 461 480 474 485 486 484 499 451 483
150 458 428 470 462 464 456 479 469 469 479 443 457
165 485 451 487 472 490 487 491 496 495 503 460 476
180 364 339 359 351 385 368 409 391 372 381 348 378
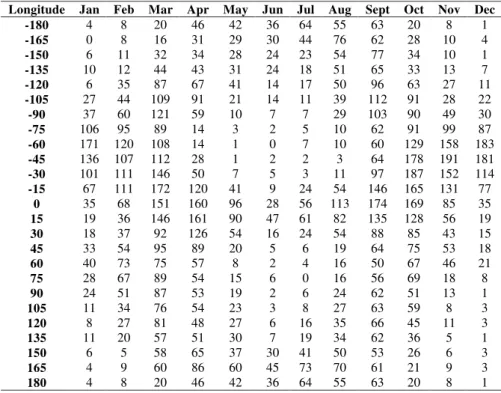
Table 3.Number of orbits with EPBs per month in each longitude sector for the full DMSP EPB database 1989–2004.
Longitude Jan Feb Mar Apr May Jun Jul Aug Sept Oct Nov Dec
-180 4 8 20 46 42 36 64 55 63 20 8 1
-165 0 8 16 31 29 30 44 76 62 28 10 4
-150 6 11 32 34 28 24 23 54 77 34 10 1
-135 10 12 44 43 31 24 18 51 65 33 13 7
-120 6 35 87 67 41 14 17 50 96 63 27 11
-105 27 44 109 91 21 14 11 39 112 91 28 22
-90 37 60 121 59 10 7 7 29 103 90 49 30
-75 106 95 89 14 3 2 5 10 62 91 99 87
-60 171 120 108 14 1 0 7 10 60 129 158 183
-45 136 107 112 28 1 2 2 3 64 178 191 181
-30 101 111 146 50 7 5 3 11 97 187 152 114
-15 67 111 172 120 41 9 24 54 146 165 131 77
0 35 68 151 160 96 28 56 113 174 169 85 35
15 19 36 146 161 90 47 61 82 135 128 56 19
30 18 37 92 126 54 16 24 54 88 85 43 15
45 33 54 95 89 20 5 6 19 64 75 53 18
60 40 73 75 57 8 2 4 16 50 67 46 21
75 28 67 89 54 15 6 0 16 56 69 18 8
90 24 51 87 53 19 2 6 24 62 51 13 1
105 11 34 76 54 23 3 8 27 63 59 8 3
120 8 27 81 48 27 6 16 35 66 45 11 3
135 11 20 57 51 30 7 19 34 62 36 5 1
150 6 5 58 65 37 30 41 50 53 26 6 3
165 4 9 60 86 60 45 73 70 61 21 9 3
180 4 8 20 46 42 36 64 55 63 20 8 1
Note from Table 1 that the number of DMSP spacecraft with available data varied from year to year. For example, with F9 and F10 both operational in 1991, we actually have five “satellite years” of data for 1989–1992. For 1994–1997,
L. C. Gentile et al.: A global climatology for equatorial plasma bubbles 167
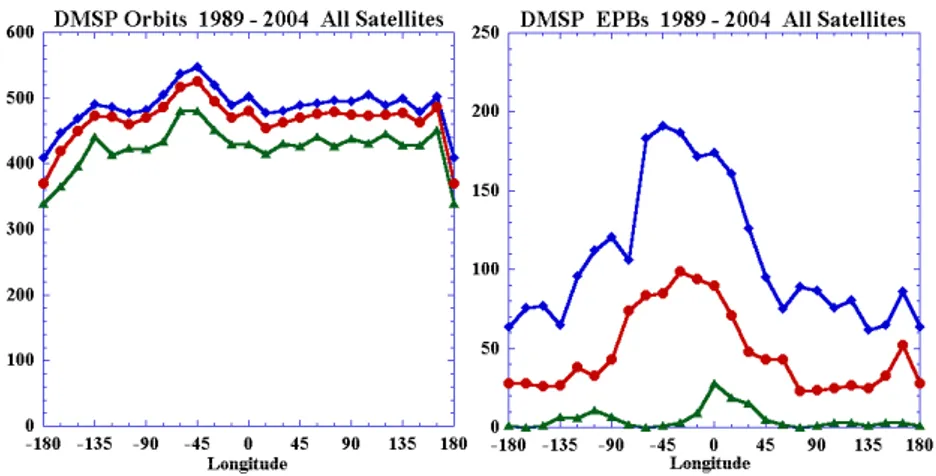
Fig. 1.Maximum, minimum, and median number of orbits (left) and EPBs (right) per month in each longitude sector for 1989–2004 based on data in Tables 2 and 3. Overall, the number of orbits per longitude/month bin ranged from 339 to 548. Highest EPB rates occurred in the America-Atlantic-Africa sector.
Submitted to Annales Geophysicae
°
°
°
°
α
°
α °
Fig. 2. Plots of the maximum, minimum, and median number of orbits per month sampled in each 15◦longitude sector for each phase of the solar cycle: maximum 1989–1992, minimum 1994–1997, maximum 1999–2002, and transition years 1993, 1998, and 2003. Data are derived from Tables 2 and 3 for the appropriate years.
at least one EPB was detected divided by the total number of orbits for each month of the year in 24 longitude sectors of 15◦. There were on average∼18 orbits per month for each satellite in each longitude bin. To provide some perspective on the size of the statistical samples used to calculate the EPB rates, Table 2 is an array of the total number of orbits per month and Table 3 the number of orbits with EPBs in each 15◦longitude sector for all the spacecraft listed in Table 1.
168 L. C. Gentile et al.: A global climatology for equatorial plasma bubbles
0 5 10 15 20 25
0 2 4 6 8 10 12
DMSP EPB Rates 1989 - 2004
Jan
Feb
Mar
Apr
May
Jun
Jul
Aug
Sep
Oct
Nov
Dec
-180 -150 -120 -90 -60 -30 0 30 60 90 120 150 180
Longitude
00 - 05 05 - 10 10 - 15 15 - 20 20 - 25 25 - 30 30 - 35 35 - 40 40 - 45 45 - 50 50 - 55 55 - 60 60 - 65 65 - 70 70 - 80 80 - 90 90 -100
Pacific
America Atlantic Africa
India
Pacific
Fig. 3.Contour plot representing EPB rates for 1989–2004 on a month versus longitude grid. Colors represent the rates as indicated. Black lines mark the two times per year whenα=0◦within each longitude bin.
0 5 10 15 20 25
0 2 4 6 8 10 12
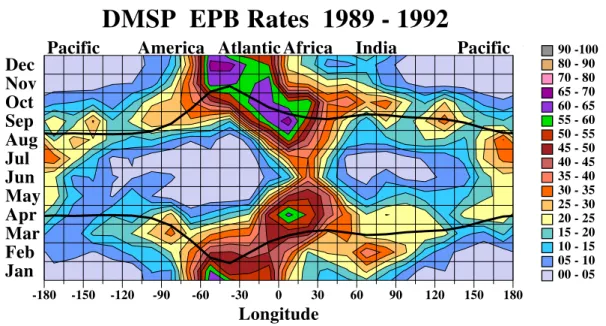
DMSP EPB Rates 1989 - 1992
Jan
Feb
Mar
Apr
May
Jun
Jul
Aug
Sep
Oct
Nov
Dec
-180 -150 -120 -90 -60 -30 0 30 60 90 120 150 180
Longitude
00 - 05 05 - 10 10 - 15 15 - 20 20 - 25 25 - 30 30 - 35 35 - 40 40 - 45 45 - 50 50 - 55 55 - 60 60 - 65 65 - 70 70 - 80 80 - 90 90 -100
Pacific
America Atlantic Africa
India
Pacific
Fig. 4. Contour plot of EPB rates for solar maximum 1989–1992 in the same format as Fig. 3. EPBs occurred throughout the year in the Atlantic-Africa sector; rates were>60% in January, April, and September to December.
Figure 3 is a rate of occurrence map for EPBs observed by DMSP satellites from 1989–2004 plotted on a month-versus-longitude grid. Longitude ranges from –180◦to 180◦in 24 bins of 15◦. Colors represent rates as indicated. Superim-posed black lines mark the days whenα=0◦.
In general, the DMSP observations agree with Tsunoda’s hypothesis (1985); most EPBs were observed near days when α=0◦. However, the maximum rates do not always coincide with these days and the significant offsets appar-ent in many longitude sectors, particularly in the Atlantic-Africa region, were not predicted by the model. Both sea-sonal and longitudinal effects are evident, with the highest
EPB rates (35%–40%) observed around the spring (March– April) and fall (September–October) equinoxes and the win-ter (December–January) solstice in the America-Atlantic-Africa region. Lowest rates (0%–5%) occurred during January–February and November–December in the Pacific sector and June–July in the America-Atlantic and India sec-tors.
0 5 10 15 20 25 0
2 4 6 8 10 12
DMSP EPB Rates 1999 - 2002
Jan
Feb
Mar
Apr
May
Jun
Jul
Aug
Sep
Oct
Nov
Dec
-180 -150 -120 -90 -60 -30 0 30 60 90 120 150 180
Longitude
00 - 05 05 - 10 10 - 15 15 - 20 20 - 25 25 - 30 30 - 35 35 - 40 40 - 45 45 - 50 50 - 55 55 - 60 60 - 65 65 - 70 70 - 80 80 - 90 90 -100
Pacific
America Atlantic Africa
India
Pacific
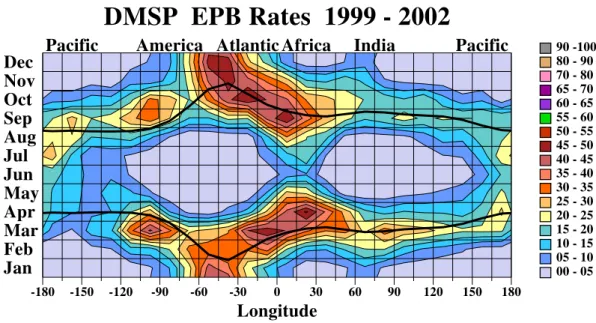
Fig. 5.Contour plot of EPB rates for solar maximum 1999–2002 in the same format as Fig. 3. Plot is fairly symmetric with similar maxima (40%–50%) in the America-Atlantic-Africa sector both early and late in the year.
0 5 10 15 20 25
0 2 4 6 8 10 12
DMSP EPB Rates 1994 - 1997
Jan
Feb
Mar
Apr
May
Jun
Jul
Aug
Sep
Oct
Nov
Dec
-180 -150 -120 -90 -60 -30 0 30 60 90 120 150 180
Longitude
00 - 05 05 - 10 10 - 15 15 - 20 20 - 25 25 - 30 30 - 35 35 - 40 40 - 45 45 - 50 50 - 55 55 - 60 60 - 65 65 - 70 70 - 80 80 - 90 90 -100
Pacific
America Atlantic Africa
India
Pacific
Fig. 6.Contour plot of EPB rates for solar minimum 1994–1997 in the same format as Fig. 3. EPB rates were generally<=5%. Highest rate (21%) occurred in the Africa sector in March.
sector than in the Pacific. Figure 4 is the EPB climatology for 1989–1992, the maximum phase of Solar Cycle 23, plot-ted on a month-versus-longitude grid in a format similar to that of Fig. 3. EPBs were observed in significant numbers throughout the year in the Atlantic-Africa sector with the highest rates (60%-70%) occurring in January, April, and September–December. Also note that the maximum EPB rates were significantly higher than those during the maxi-mum phase of Solar Cycle 24 (45%–50%) from 1999–2002 shown in Fig. 5. This is consistent with Huang et al. (2002) who reported a strong linear relationship between EPB rates and the yearly averaged F10.7 index both globally and in
individual longitude sectors (c.f. Fig. 4 and Table 2 of Huang et al., 2002). Another notable difference is the remark-ably symmetric distribution for 1999–2002: EPB rates were high (40%–50%) in the Atlantic-Africa sector from January to April and September to December with distinct minima (0%–5%) around the summer solstice in the America and In-dia sectors.
170 L. C. Gentile et al.: A global climatology for equatorial plasma bubbles
0 5 10 15 20 25
0 2 4 6 8 10 12
DMSP EPB Rates 1993
Jan
Feb
Mar
Apr
May
Jun
Jul
Aug
Sep
Oct
Nov
Dec
-180 -150 -120 -90 -60 -30 0 30 60 90 120 150 180
Longitude
00 - 05 05 - 10 10 - 15 15 - 20 20 - 25 25 - 30 30 - 35 35 - 40 40 - 45 45 - 50 50 - 55 55 - 60 60 - 65 65 - 70 70 - 80 80 - 90 90 -100
Pacific
America Atlantic Africa
India
Pacific
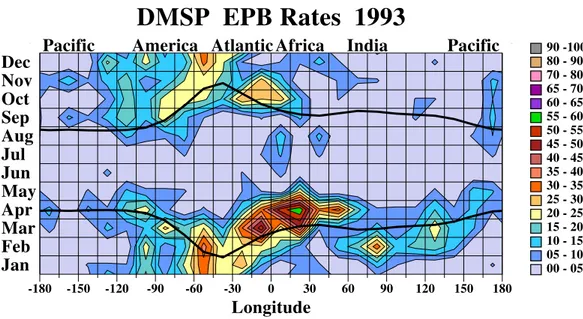
Fig. 7.EPB rates for transition year 1993 were highest (50%–60%) in the Atlantic-Africa sector during March–April.
0 5 10 15 20 25
0 2 4 6 8 10 12
DMSP EPB Rates 1998
Jan
Feb
Mar
Apr
May
Jun
Jul
Aug
Sep
Oct
Nov
Dec
-180 -150 -120 -90 -60 -30 0 30 60 90 120 150 180
Longitude
00 - 05 05 - 10 10 - 15 15 - 20 20 - 25 25 - 30 30 - 35 35 - 40 40 - 45 45 - 50 50 - 55 55 - 60 60 - 65 65 - 70 70 - 80 80 - 90 90 -100
Pacific
America Atlantic Africa
India
Pacific
Fig. 8.For transition year 1998, highest EPB rates (45%–50%) occurred in the Atlantic-Africa sector late in the year.
the height distribution of EPBs remains an open question, ionospheric conditions during solar minimum may limit the number of EPBs that reach DMSP altitudes at the appropri-ate local times. The C/NOFS sappropri-atellite’s 13◦ inclination or-bit with an apogee of 710 km and perigee of 375 km should maximize the probability of observing EPBs even under solar minimum conditions.
Figure 7 presents data for the 1993 transition year as the solar cycle declined. This is our smallest statistical sample with data from F10 only, but the plot shows similar trends in activity. EPB rates were higher early in the year with a maximum of 50%–60 % during March–April in the Atlantic-Africa sector. A significant number of EPBs were encoun-tered in the India sector in February, but by fall very few EPBs were observed in this area.
The trend reverses in 1998 (Fig. 8) with only a few local-ized hot spots in the Atlantic-Africa sector early in the year. EPB rates were significantly higher (45%–50%) late in the year, September-October, in the Atlantic-Africa sector as the solar cycle approached maximum.
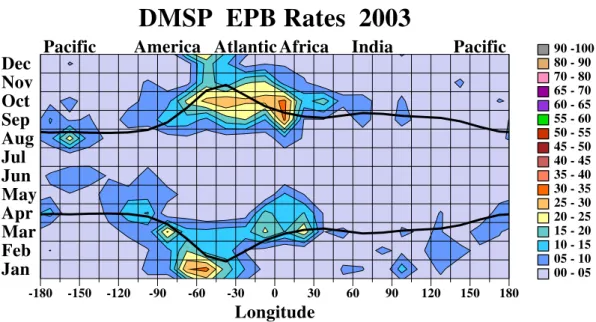
For 2003 (Fig. 9), the maximum rate (32%) was lower than in 1993 or 1998, which seems reasonable for the declining phase of Solar Cycle 24. However, contrary to expectations, more EPBs were encountered late in the year in the Atlantic-Africa sector primarily because of the number of EPBs ob-served during the October-November solar storms.
0 5 10 15 20 25 0
2 4 6 8 10 12
DMSP EPB Rates 2003
Jan
Feb
Mar
Apr
May
Jun
Jul
Aug
Sep
Oct
Nov
Dec
-180 -150 -120 -90 -60 -30 0 30 60 90 120 150 180
Longitude
00 - 05 05 - 10 10 - 15 15 - 20 20 - 25 25 - 30 30 - 35 35 - 40 40 - 45 45 - 50 50 - 55 55 - 60 60 - 65 65 - 70 70 - 80 80 - 90 90 -100
Pacific
America Atlantic Africa
India
Pacific
Fig. 9.EPB rates for transition year 2003 were higher in the Atlantic-Africa sector late in the year because of the number of EPBs during the October–November solar storms.
(cf. Fig. 8 of Burke et al., 2004b) from approximately zero near 18.7 MLT to a fairly consistent level from 20.3 MLT to midnight, the LT range of most of the DMSP orbits. For DMSP spacecraft, the average LT varies from year to year (see Table 1). To determine the variation in EPB rate as a function of LT for DMSP at 848 km we compared data from F12, F14, F15, and F16 for 2000 to 2004. This interval had two distinct advantages: several spacecraft were available simultaneously, and the maximum phase of the solar cycle yields the best statistics for EPBs. Of the four satellites, F15 was at the latest LT. Thus, we assumed that F15 was in the LT range when the occurrence rate was relatively constant (∼20.0–24.0 MLT). EPB rates for F15 from 2000 to 2004 were 20%, 20%, 19%, 7% and 5%, respectively. To normal-ize the EPB rates for F15 and the other spacecraft in this time interval, we multiplied the occurrence rate for all spacecraft in a given year by a factor which normalized the F15 rate for that year at 20%. This removed the influence of the solar cycle variation. Figure 10 shows that the normalized DMSP EPB rates rose from approximately zero near 19.3 MLT to a maximum near 21.0 MLT with the half-maximum rate at∼20.0 MLT. For ROCSAT-1, the half-maximum rate oc-curred at∼19.5 MLT. Assuming that this difference is due to the average speed of the rising bubbles, we estimate an up-ward drift speed of∼110 m/s, which is within the expected range for EPBs.
4 Discussion and Conclusions
The DMSP EPB database includes 29 “satellite years” of evening sector observations from six polar-orbiting space-craft during 1989–2004. This interval encompasses two solar maxima and a solar minimum, providing an opportunity to examine global distributions of EPBs for a variety of time
Fig. 10. LT distribution of EPBs observed from DMSP F12, F14, F15, and F16 at 848-km altitude for 2000 to 2004 as a function of LT. Non-solar maximum years 2002–2004 were scaled to solar maximum years 2000–2001.
max-172 L. C. Gentile et al.: A global climatology for equatorial plasma bubbles imum activity, the impact of increased EUV flux on
iono-spheric dynamics and the presence of penetration electric fields in the magnetosphere. It is important to keep in mind that the EPBs detected at DMSP altitudes are the result of nonlinear evolutions of the Rayleigh-Taylor instability that have reached the peak of the F-layer. Not all EPBs reach this altitude, especially during solar minimum. Burke et al. (2004b) found good agreement with ROCSAT-1 plasma density measurements in a low inclination orbit at 650 km. However, the height distribution of EPBs remains an open question, a challenge which the C/NOFS mission is designed to address.
The primary objective of the DMSP studies has been to ex-ploit global and continuous observations of plasma densities at low magnetic latitudes in the evening LT sector in prepa-ration for the C/NOFS mission. As with any statistical study our methodology offers advantages and disadvantages rela-tive to other techniques. Each DMSP spacecraft measures plasma densities at 848 km near a specific LT with equatorial crossings separated in longitude by∼25◦from one orbit to the next. With this coarse filter a DMSP satellite misses many plasma bubbles. However, it does observe many internal ir-regularities within depletions as it follows the magnetic flux tube. While satellites such as Atmosphere Explorer E and ROCSAT-1 flying in low inclination orbits sample plasma density irregularities at all longitudes and local times, their operational lifetimes were limited to a few years. Burke et al. (2004b) demonstrated that if ROCSAT-1 crossed an EPB at a given longitude and a DMSP satellite crossed the mag-netic equator at the same longitude within±15 min the prob-ability of detecting the same depletion was nearly 100%. In other words, plasma bubbles that reached the ROCSAT-1 al-titude (650 km) usually ascended to alal-titudes>848 km. Also, the local times at which ROCSAT-1 saw the highest EPB rates coincided with those of the DMSP sun-synchronous or-bits. Thus, the combined databases contribute a great deal to our understanding of the nonlinear growth and evolution of EPBs.
Conflicts seem to arise when we compare our DMSP cli-matology with others derived from ground-based radars and monitors of radiowave scintillations at fixed geographic lo-cations. We believe these are attributable to the different, but related measured physical quantities. Plasma irregularities cover a wide range of scale sizes, from a few meters, seen by coherent backscatter radars, to a few hundred kilometers, observed as bubbles in the topside of the F-layer. Depending on wavelength and altitude, irregularities that cause scintilla-tions range from a few hundred meters to a few kilometers. These and the meter-scale irregularities can appear in the topside of the F-layer where they are associated with EPBs, or they may be confined to the bottomside. Measurements from the JULIA radar in Peru show that bottomside irregu-larities are more common than the plumes that extend from them to altitudes far above the peak of the F-layer. Burke et al. (2003) compared the rates of EPBs detected by DMSP near the west coast of South America with the intensities of UHF scintillations observed at Ancon. They showed that
when S4>0.8, EPB detections at 848 km and UHF scintilla-tions followed the same pattern. In the C/NOFS era we hope to achieve sufficient understanding of this complex space weather phenomenon to predict its occurrence.
Acknowledgements. This work was supported under Air Force
Of-fice of Scientific Research task 2311SDA1, Air Force contract F19628-02-C-0012 with Boston College, and the National Polar-orbiting Operational Environmental Satellite System Internal Gov-ernment Studies Program.
Topical Editor M. Pinnock thanks V. Eccles and another referee for their help in evaluating this paper.
References
Aarons, J.: The longitudinal morphology of equatorial F-layer ir-regularities relevant to their occurrence, Space Sci. Rev., 63, 209–243, 1993.
Basu, B.: Generalized Rayleigh-Taylor instability in the presence of time-dependent equilibrium, J. Geophys. Res., 102, 17 305– 17 312, 1997.
Burke, W. J., Huang, C. Y., Valladares, C. E., Machuzak, J. S., Gentile, L. C., and Sultan, P. J.: Multipoint observations of equatorial plasma bubbles, J. Geophys. Res., 108, A5, 1221, doi:10.1029/2002JA009382, 2003.
Burke, W. J., Huang, C. Y., Gentile, L. C., and Bauer, L.: Seasonal-longitudinal variability of equatorial plasma bubble occurrence, Ann. Geophys., 22, 3089–3098, 2004a,
SRef-ID: 1432-0576/ag/2004-22-3089.
Burke, W. J., Gentile, L. C., Huang, C. Y., Valladares, C. E., and Su, S. Y.: Longitudinal variability of equatorial plasma bub-bles observed by DMSP and ROCSAT-1, J. Geophys. Res., 109, A12301, doi:10.1029/2004JA010583, 2004b.
Huang, C. Y., Burke, W. J., Machuzak, J. S., Gentile, L. C., and Sultan, P. J.: DMSP observations of equatorial plasma bubbles in the topside ionosphere near solar maximum, J. Geophys. Res., 106, 8131–8142, 2001.
Huang, C. Y., Burke, W. J., Machuzak, J. S., Gentile, L. C., and Sul-tan, P. J.: Equatorial plasma bubbles observed by DMSP satel-lites during a full solar cycle: Toward a global climatology, J. Geophys. Res., 107(A12), 1434, doi:1029/2002JA009452, 2002. Luhmann, J. G. and Vampola, A. L.: Effects of localized sources on quiet time plasmasphere electron precipitation, J. Geophys. Res., 82, 2671–2676, 1977.
Rich, F. J. and Hairston, M.: Large-scale convection patterns ob-served by DMSP, J. Geophys. Res., 99, 3827–3844, 1994. Scherliess, L. and Fejer, B. G.: Storm time dependence of equatorial
disturbance dynamo zonal electric fields, J. Geophys. Res., 102, 24 037–24 046, 1997.
Sultan, P. J.: Linear theory and modeling of the Rayleigh-Taylor in-stability leading to the occurrence of equatorial spread F, J. Geo-phys. Res., 101, 26 875–26 891, 1996.
Tsunoda, R. T.: Control of the seasonal and longitudinal occurrence of equatorial scintillations by the longitudinal gradient in the in-tegrated E-region Pedersen conductivity, J. Geophys. Res., 90, 447–456, 1985.