www.atmos-chem-phys.net/16/4043/2016/ doi:10.5194/acp-16-4043-2016
© Author(s) 2016. CC Attribution 3.0 License.
Chemical and physical influences on aerosol activation
in liquid clouds: a study based on observations from
the Jungfraujoch, Switzerland
Christopher R. Hoyle1,2, Clare S. Webster1,2,a, Harald E. Rieder3,4, Athanasios Nenes5,6,7,8, Emanuel Hammer1,b, Erik Herrmann1, Martin Gysel1, Nicolas Bukowiecki1, Ernest Weingartner1,c, Martin Steinbacher9, and
Urs Baltensperger1
1Laboratory of Atmospheric Chemistry, Paul Scherrer Institute, Villigen, Switzerland 2WSL Institute for Snow and Avalanche Research SLF Davos, Switzerland
3Wegener Center for Climate and Global Change and IGAM/Department of Physics, University of Graz, Austria 4Austrian Polar Research Institute, Vienna, Austria
5School of Earth and Atmospheric Sciences, Georgia Institute of Technology, Atlanta, GA 30332, USA 6School of Chemical and Biomolecular Engineering, Georgia Institute of Technology, Atlanta, GA 30332, USA 7Institute of Chemical Engineering Sciences, Foundation for Research and Technology,
Hellas, 26504 Patras, Greece
8Institute for Environmental Research and Sustainable Development, National Observatory of Athens,
15236 Palea Penteli, Greece
9Laboratory for Air Pollution/Environmental Technology, Empa – Swiss Federal Laboratories for Materials
Science and Technology, Ueberlandstrasse 129, 8600 Duebendorf, Switzerland
anow at: Department of Geography, Faculty of Engineering and Environment, Northumbria University,
Newcastle Upon Tyne, UK
bnow at: Grolimund and Partner – Environmental Engineering, Thunstrasse 101a, 3006 Bern, Switzerland
cnow at: Institute of Aerosol and Sensor Technology, University of Applied Sciences Northwestern Switzerland, Windisch,
Switzerland
Correspondence to:Christopher R. Hoyle (christopher.hoyle@psi.ch)
Received: 1 May 2015 – Published in Atmos. Chem. Phys. Discuss.: 9 June 2015 Revised: 11 March 2016 – Accepted: 14 March 2016 – Published: 29 March 2016
Abstract. A simple statistical model to predict the number of aerosols which activate to form cloud droplets in warm clouds has been established, based on regression analysis of data from four summertime Cloud and Aerosol Characterisa-tion Experiments (CLACE) at the high-altitude site Jungfrau-joch (JFJ). It is shown that 79 % of the observed variance in droplet numbers can be represented by a model account-ing only for the number of potential cloud condensation nu-clei (defined as number of particles larger than 80 nm in di-ameter), while the mean errors in the model representation may be reduced by the addition of further explanatory vari-ables, such as the mixing ratios of O3, CO, and the height
of the measurements above cloud base. The statistical model
droplet formation at the JFJ is predominantly controlled by the number concentration of aerosol particles.
1 Introduction
Aerosols have a well-documented and pronounced influence on the microphysical and therefore radiative properties of clouds (e.g. Twomey, 1974, 1977; Albrecht, 1989; Hu and Stamnes, 1993). The properties of atmospheric aerosol parti-cles thus have a strong potential to affect local and regional climates. However, the influence of aerosols on clouds re-mains the single largest uncertainty hampering the calcula-tion of future climate scenarios (Boucher et al., 2013). To reduce this uncertainty, an improved understanding of the aerosol properties and environmental conditions that allow parts of the aerosol population to act as cloud condensation nuclei (CCN) and form cloud droplets is required.
Previous ground-based studies have investigated statisti-cal relationships between cloud droplet or CCN number con-centration, aerosol properties, and environmental variables (e.g. Henning et al., 2002; Dusek et al., 2006; Verheggen et al., 2007; Jurányi et al., 2010, 2011; Anttila et al., 2012). Based on around 22 days of data from the Taunus Observa-tory in central Germany, Dusek et al. (2006) determined that the concentration of CCN (as measured at different super-saturations in a CCN counter) is largely dependent on the measured particle size distribution, with the CCN concentra-tion increasing with increasing particle diameter and chemi-cal composition of the aerosol playing a secondary role.
Various studies have investigated the mechanisms through which the chemical composition of aerosol influences its water uptake and activation and how this can be accounted for (e.g. Köhler, 1936; McFiggans et al., 2006; Petters and Kreidenweis, 2007). In addition, surface active compounds may influence surface tension and thus the activation of aerosol particles to form cloud droplets (Shulman et al., 1996; Shilling et al., 2007; King et al., 2009). Recently, it has been suggested that this may lead to a temperature influ-ence on aerosol activation (Nenes et al., 2002; Christensen and Petters, 2012). Nevertheless, the works of, for example, Dusek et al. (2006) and Jurányi et al. (2010, 2011) suggest that the relatively small variations in chemical composition of aerosol in areas away from sources may play a smaller role in determining CCN activity of the aerosol than varia-tions in the size distribution.
Examining 1 month of data from a remote site in north-ern Finland, Anttila et al. (2012) determined that the high-est correlations with activated aerosol number occur with the number of available CCN, which was defined as the to-tal number of particles greater than 100 nm in diameter, and that the number of droplets formed did not strongly depend on updraught velocity. A set of regimes where the number of cloud droplets formed depends on updraught velocities
(at low ratios of updraught to aerosol number), and where the number of cloud droplets depends more on the number of aerosol (at high ratios of updraught to aerosol number), were described by Reutter et al. (2009), based on cloud par-cel model studies. At the Jungfraujoch site, Henning et al. (2002) determined that aerosol particles larger than 100 nm in diameter were typically activated to form cloud droplets in clouds with liquid water content (LWC) above 0.15 g m−3. Verheggen et al. (2007) investigated relationships between environmental variables and activated fraction, defined as the fraction of total particles, larger than 100 nm in diameter, that have been activated to form cloud droplets. The latter study based its analysis on one summer and two winter campaigns, and found that the activated fraction increased with increas-ing LWC and decreased with decreasincreas-ing temperature below 0◦C, as clouds began to glaciate. Also using data from the Jungfraujoch site, Jurányi et al. (2010, 2011) found that with knowledge of the average chemical composition of aerosol, a very high degree of correlation could be found between the number of activated aerosol predicted by theκ-Köhler approach (Petters and Kreidenweis, 2007) and the observed number of activated particles measured at different supersat-urations in a CCN counter.
Although both Dusek et al. (2006) and Jurányi et al. (2010, 2011) found that, with a known aerosol size distribution, one can obtain good correlations between the predicted and ob-served number of droplets at a particular supersaturation in a CCN counter, the peak supersaturation reached in an air parcel is not generally a known quantity. It is also not pos-sible to say how well the number of droplets predicted in this way corresponds with the number of droplets in a cloud which has formed some time ago. Although several studies exist in which a good degree of closure was achieved be-tween predicted and observed cloud droplet numbers (of the order of 20 % difference between calculated and observed droplet numbers; e.g. Fountoukis et al., 2007; Meskhidze et al., 2005; Conant et al., 2004), a simple method of pre-dicting cloud droplet numbers based on easily quantifiable parameters would be useful.
It has long been recognized that the number and the size of aerosol particles strongly influences the number of CCN and that, at higher aerosol number concentrations, clouds will be composed of a greater number of droplets (Köhler, 1936; Fitzgerald and Spyers-Duran, 1973; Twomey, 1974, 1977). Several simple parametrizations of the number of cloud droplets as a function of the aerosol diameter and to-tal aerosol number have been suggested for both continen-tal and maritime locations, (Köhler, 1936; Raga and Jonas, 1993; Jones, 1994; Martin et al., 1994), mainly for stratus and stratocumulus clouds.
droplets (e.g. Abdul-Razzak and Ghan, 2000; Barahona and Nenes, 2007; Fountoukis and Nenes, 2005; Kumar et al., 2009; Nenes and Seinfeld, 2003). A parametrization was also developed by Kivekäs et al. (2008) which predicts the num-ber of cloud droplets using four parameters: the total sub-micron aerosol volume concentration, the number-to-volume aerosol concentration ratio, the soluble fraction of the parti-cle volume, and the air updraught velocity. Good agreement was found between the number of droplets predicted by this parametrization and observed droplet numbers in northern Finland.
In this study, data from four summer measurement cam-paigns carried out at the Jungfraujoch between 2002 and 2011 are used to develop simple statistical models of the rela-tionship between the number of observed cloud droplets and various environmental factors, as well as the aerosol number size distribution, in liquid clouds. Using such an extensive data set collected over a period of nearly 10 years allows the construction of relationships which are applicable to a wide range of conditions, although the statistical model developed here is only valid for liquid clouds. The results from the sta-tistical models are compared to simulations using an estab-lished cloud droplet formation parametrization for use in cli-mate model simulations of the aerosol indirect effect.
2 Measurement site
The Jungfraujoch (JFJ) high-alpine measurement site is lo-cated at 3580 m a.s.l., atop an exposed crest in the Bernese Alps, Switzerland, and is accessible by train throughout the year. The site is engulfed in cloud approximately 40 % of the time (Baltensperger et al., 1998; Nyeki et al., 1998) and local emissions are minimal with the exception of oc-casional construction activities. Aerosol measurements have been carried out at the JFJ since the early 1970s (Bukowiecki et al., 2016), with continuous measurements since 1986 (Bal-tensperger et al., 1991, 1997), and the site has been part of the Global Atmosphere Watch (GAW) programme since 1995. A review of the aerosol observations at the JFJ is provided by Bukowiecki et al. (2016). The location of the station makes it suitable for continuous monitoring of the remote continen-tal troposphere. The topography around the measurement site defines two predominant local wind directions, southeast or northwest. To the southeast, the Aletsch Glacier gradually slopes away from the JFJ at an approximate angle of 15◦. In contrast, the northwestern side drops steeply at an average slope of approximately 46◦. This difference in topography causes updraught velocities to be higher in air masses ap-proaching the station from the northwest than from the south-east, with median peak supersaturations of around 0.41 % (representative of cumulus or orographic clouds) and 0.22 % (representative of shallow layer or stratiform clouds) being reached for the respective wind directions (Hammer et al., 2014; Lugauer et al., 1998). Therefore, depending on
con-ditions and wind direction, data gathered at the JFJ can be representative of convective or of stratiform-type clouds.
The unique topography surrounding the JFJ site and the long-term measurements performed there provide substan-tial opportunity for investigating not only how relationships between environmental variables change between years but also what effect the differing topography to the north and south has, through its influence on the vertical wind veloc-ity. Furthermore, the composition of aerosols in air coming from the south is influenced by different source regions than air coming from the north. Peak supersaturation values, up-draught velocity, aerosol hygroscopicity, and cloud droplet number concentration were studied by Hammer et al. (2014), who found that all these quantities showed statistically sig-nificant differences between the two wind sectors. This work was extended by Hammer et al. (2015), who quantified the influence of updraught velocity and particle composition and concentration on peak supersaturation.
While measurements made at the JFJ often sample the free troposphere, in summer the air masses are mostly influenced by injections of boundary layer air due to convective events (Lugauer et al., 1998; Nyeki et al., 1998) and frontal sys-tems (Zellweger et al., 2003). On average during summer, a boundary layer influence is detected at the JFJ around 80 % of the time, dropping to around 60 % in spring or autumn or lower than 40 % in January (Herrmann et al., 2015). The lat-ter study also showed that the large degree of boundary layer influence is partly due to the effect of the alpine topography on air flow.
The JFJ observatory is also one of 16 stations of the Swiss National Air Pollution Monitoring Network. As part of this operation, continuous in situ observations of about 70 differ-ent trace gases are performed by Empa, the Swiss Federal Laboratories for Materials Science and Technology.
3 Data collection
Data used in this study were collected as part of the Cloud and Aerosol Characterisation Experiments (CLACE). The CLACE measurements have been conducted at the JFJ since 2000. They are a series of intensive winter and summer cam-paigns designed to investigate the chemical, physical, and op-tical properties of aerosols as well as their interaction with clouds (Henning et al., 2002; Verheggen et al., 2007; Sjo-gren et al., 2008; Kammermann et al., 2010; Jurányi et al., 2010, 2011; Hammer et al., 2014). The present study utilizes data collected during four summer campaigns, in 2002, 2004, 2010, and 2011 (Table 1).
Table 1.Dates and references for each CLACE campaign.
Campaign Start date End date Reference
CLACE2002 4 Jul 2002 20 Jul 2002 –
CLACE2004 16 Jul 2004 30 Sep 2004 Cozic et al. (2007) CLACE2010 1 Jul 2010 13 Aug 2010 Spiegel et al. (2012) CLACE2011 1 Jul 2011 23 Aug2011 Hammer et al. (2014)
hydrometeors, at wind speeds up to 20 m s−1 (Weingartner et al., 1999). The condensed water of the particles and hy-drometeors was evaporated by heating up the top part of the inlet to approximately 25◦C so that all particles were dried (and therefore residual aerosol particles contained in cloud droplets were set free) while reaching the instruments in the laboratory. The interstitial inlet only sampled par-ticles smaller than 1 and 2 µm diameter using a size dis-criminator of PM1(during CLACE2002) and PM2 (during
CLACE2004, CLACE2010, and CLACE2011) respectively. Thus, only non-activated particles (i.e. particles that did not act as CCN and were thus not contained in cloud droplets) passed this inlet. The transition to laboratory temperatures (typically 20 to 30◦C) resulted in the drying of the particles at a relative humidity less than 10 %. The difference between the number of aerosol sampled through the total inlet and the number sampled through the interstitial inlet gives the num-ber of aerosol which were activated to form cloud droplets, nact. It has been shown by Henning et al. (2002), in a
com-parison with forward scattering spectrometer probe (FSSP) droplet measurements, that this value can be used as a proxy for the number of cloud droplets. Therefore this is the ap-proach that we adopt in the present study.
Downstream of the inlets, a scanning mobility particle sizer (SMPS) was used to measure the total and intersti-tial aerosol size distribution respectively. The SMPS mea-sured particles in the size range of 16 to 600 nm. One scan required 6 min. During CLACE2002 and CLACE2004, the SMPS was installed behind a pinch valve to switch between the two inlets after each scan (i.e. 6 min). The data in 2002 and 2004 are therefore at 12 min resolution. For CLACE2010 and CLACE2011, two SMPS measured simultaneously be-hind each inlet so that a higher time resolution (approxi-mately 6 min) could be achieved. Each SMPS consisted of a differential mobility analyser (DMA), a bipolar charger to obtain charge equilibrium (krypton source,85Kr), and a con-densation particle counter (CPC) (Wiedensohler et al., 2012). During cloud-free periods, the interstitial and the total SMPS should measure the same aerosol number size distribution. For the campaigns where two SMPS measured simultane-ously, the out-of-cloud particle size distribution showed dif-ferences of up to 10 % for particles with diameters between 20 and 600 nm (Hammer et al., 2014). This is within the typi-cal uncertainty for this type of measurements (Wiedensohler et al., 2012). To account for these differences between the two units, the interstitial number size distributions (for each
campaign specific instrument) were corrected towards the to-tal aerosol size distribution. A size- and time-dependent cor-rection factor was determined by comparing the total and in-terstitial number size distributions during all cloud-free peri-ods (Verheggen et al., 2007).
To monitor the cloud presence, the LWC was measured using a particle volume monitor (PVM-100; Gerber, 1991), which measures the LWC by forward light scattering.
A measurement of the horizontal wind speed and direc-tion was provided by the Rosemount Pitot tube anemometer, which is mounted on a 10 m mast as part of the SwissMetNet network of MeteoSwiss. Likewise, temperature measured at the site as part of the SwissMetNet network was used.
In recent years, outdoor tourism activities around the JFJ have increased, resulting in more frequent local pollution events. Data that are likely affected by construction activities, snow groomer operation, and other local anthropogenic in-fluences (mainly cigarette smoke; Fröhlich et al., 2015) have been removed from the data sets. As the JFJ is character-ized as a background site, sudden, short-lived fluctuations in the aerosol size distribution can be interpreted as local pollu-tion (Herrmann et al., 2015). Therefore the affected data were identified by visual inspection of the aerosol size distribution spectra.
In situ trace gas measurements of O3and CO were
con-ducted as part of the Swiss National Air Pollution Moni-toring Network (NABEL). Measurements were recorded at 10 min intervals throughout all study periods, using a UV absorption technique for O3(Thermo Environmental
Instru-ment, TEI49C) and non-dispersive IR absorption photometry (NDIR) for CO (Horiba APMA360, APMA370) (Gilge et al., 2010; Zellweger et al., 2009).
4 Data analysis 4.1 Data processing
For years where two SMPSs were operating simultaneously (CLACE2010, CLACE2011),nact, as a function of dry
par-ticle diameter, could be calculated directly from the differ-ence between the total and the interstitial particle number size distributions. For the remaining 2 years (CLACE2002 and CLACE2004), the SMPS was switched between the total and the interstitial inlet. For these 2 years, the total measure-ment was taken to be the first measuremeasure-ment, with the intersti-tial measurement immediately following it used to calculate nact. The two scans inside this 12 min period were assumed
to represent the same atmospheric conditions.
generally the case at remote sites such as the JFJ). This size is known as the activation diameter and depends on the peak supersaturation reached within the air parcel. The activation diameter of the aerosol was calculated for each measurement time, following Hammer et al. (2014). In atmospheric mea-surements, the fraction of activated particles increases be-tween approximately 0 and 1 over a small range of diameters, rather than making a sharp transition at a particular diameter. Therefore the activation diameter is defined as that at which half the particles are activated and half are unactivated.
As described below, for the aged aerosol found at the JFJ, the critical diameter lies around 80–100 nm. Entrainment and mixing of air into the cloud will lead to non-activated parti-cles larger than the activation diameter co-existing with acti-vated particles and therefore the maximum actiacti-vated fraction above the activation diameter will be less than 1. Similarly, the lower water vapour pressure over ice particles in mixed-phase clouds will lead to evaporation of droplets and deac-tivation of aerosol, reducing the activated fraction above the activation diameter. A threshold of 0.9 was defined, and all measurements with maximum activated fractions of less than this threshold were assumed to be influenced by entrainment or partial glaciation of the cloud and thus excluded from the analysis.
The data were also filtered to remove any data points that were measured outside of clouds, in patchy cloud, or on the edges of clouds. This was achieved based on the mea-sured LWC. For the campaigns that had two SMPS scanners operating simultaneously (CLACE2010 and CLACE2011), the criterion follows Hammer et al. (2014), where cloud was defined to be present when the 30th percentile of the 10 s LWC values’ distribution during one 6 min scan pe-riod was higher than 5 mg m−3. For the other campaigns which had only one SMPS system operating (CLACE2002 and CLACE2004), creating a 12 min resolution data set, the criterion used was that of Henning et al. (2002) and Cozic et al. (2008), which defined cloudy conditions if the LWC was higher than 20 mg m−3for more than 85 % of an hourly period. This more stringent criterion was used to avoid the inclusion of cloud-free periods in the longer (12 min) SMPS scanning time. In contrast, using the criterion of Hammer et al. (2014), which was found to be adequate for excluding cloud-free periods during the 6 min scan time, allowed the inclusion of more data from the 2010 and 2011 campaigns.
Total water content (TWC) was calculated by adding mea-sured LWC to calculated gas-phase water (GPW), except during CLACE2010 where it could be determined directly from a dew point measurement in air sampled through the total inlet. In campaigns other than CLACE2010, such dew point measurements were not available and the GPW was calculated, using the ambient temperature, under the assump-tion that the in-cloud relative humidity was 100 %.
Data were classified according to wind direction (north and south), in order to determine whether different factors
influence the CCN quality depending on the origin of the aerosol particles.
For the purposes of this study, an estimate of the updraught velocity (wact) at cloud base was calculated, similarly to
Hammer et al. (2014), from the local topography and the hor-izontal wind speed measured at the JFJ (vJFJh ) using
wact=tan(α)vhJFJ, (1)
whereαis the inclination angle of the flow lines at the cloud base. These values wereα=46◦for the northern terrain and α=15◦for the southern terrain (for further details see Ham-mer et al., 2014). This equation is based on the assumptions that the flow lines of the updraught strictly follow the terrain on either side of the JFJ research station and that there is nei-ther sideways convergence nor divergence of the flow lines between the cloud base and the JFJ.
4.2 Selection of predictor variables
Six different predictor variables either measured at the JFJ or calculated for the cloud base were included in the statistical analysis. These were the height of the JFJ above cloud base, updraught velocity, number of available potential CCN parti-cles (hereafter referred to asnCCN, see definition below), air
temperature at the cloud base, CO, and O3.
The height of the JFJ above the cloud base was calculated by using the TWC and temperature measured at the JFJ, as-suming a moist adiabatic temperature lapse rate (6 K km−1) and thus calculating the temperature (and therefore the dis-tance below the JFJ) at which the partial pressure of water in the air mass decreased below the saturation vapour pressure. This approach is described in detail in Hammer et al. (2014) and implicitly assumes that a minimal amount of water is lost from the air mass via precipitation between the cloud base and the JFJ. The height of the JFJ above the cloud base was included as a predictor variable as it determines the amount of condensed water at the altitude of the measurements, and it is also related to the age of the cloud, during which scav-enging or coagulation processes may occur.
The updraught velocity, estimated as described in Sect. 4.1, was chosen as it is known to influence the peak supersaturation achieved during cloud formation and, there-fore, the activation diameter of the aerosol and the activated fraction of a particular aerosol size distribution.
ThenCCNis estimated from the measured aerosol size
approxi-mately 100 cm−3, Henning et al. (2002) found that the activa-tion diameter at the JFJ is around 100 nm. Further, Hammer et al. (2014) reported that there is a systematic difference in the activation diameter for aerosol in air masses approaching the JFJ from the north (87 nm) and from the south (106 nm). Here we have chosen a diameter of 80 nm as the lower size bound defining potential CCN. The relatively low value was chosen so as not to exclude potentially important sizes of aerosols.
The air temperature at cloud base (calculated from the temperature at the JFJ) was chosen to account for any temperature-dependent effects on water uptake to the aerosols which may influence activation. However, the cloud base temperature was found not to contribute significantly in the linear regression models for the years 2010 and 2011 (i.e. the years with most observational data). It was thus ex-cluded by backward elimination of explanatory variables for final model selection. Likewise, no significant relationship between air pressure andnactwas found.
Finally, the two chemical tracers CO and O3were included
in the analysis to account for the history of the air parcels. While CO is a primary pollutant and O3 is produced
pho-tochemically as a secondary pollutant from precursors such as volatile organic compounds and nitrogen oxides, both of these can act as tracers of anthropogenic emissions or of biomass burning events (e.g. Staudt et al., 2001; Liang et al., 2004; Yashiro et al., 2009; Zhang et al., 2006, 2009; Gilge et al., 2010), and therefore in this study they are used as indi-cators of the degree of influence of polluted air masses, in an attempt to determine whether this has an important effect on particle activation at the JFJ. Ozone at the JFJ may be influ-enced by stratospheric intrusions, but a modelling study (Cui et al., 2009) has suggested that this is the case for less than 20 % of the year, making such events relatively rare. 4.3 Statistical analysis
In order to determine if and how environmental and chem-ical factors can be related to the number of cloud droplets (i.e. the number of activated aerosol,nact), we chose a
sim-ple multisim-ple linear regression model for the analysis. Multi-ple linear regression is a commonly used statistical method for explanatory and theory-testing purposes, and thus it is appropriate to use in assessing how the environmental and chemical variables contribute to the prediction ofnact
(John-son et al., 2004; Tonidandel and LeBreton, 2011). It is likely that several of the predictor variables selected for this anal-ysis will be cross-correlated; thus traditional regression in-dices (pvalue, regression coefficients) will fail to appropri-ately partition the predictor variables into respective contri-bution to the overallR2of the model (Tonidandel and Le-Breton, 2011). Nevertheless, active research in the statistical sciences has led to a set of tools for the assessment of the relative importance of individual covariates in linear regres-sion models in the presence of correlated explanatory
vari-ables. A widely used approach, first proposed by Lindeman et al. (1980), hence referred to as LMG, but better known in the sequential additive version proposed by Kruskal (1987), allows assigning shares of “relative importance” to a set of regressors in a linear model (Grömping, 2007). Here we use the LMG method, in its implementation in the “relaimpo” package, developed by Grömping (2006) and available for the scientific computing language R (R Core Team, 2014), to assess the relative importance of individual explanatory variables in a simple linear regression model for the cloud droplet numbers in warm tropospheric clouds.
Below we detail the LMG method and its application to our statistical model following Grömping (2006). Once the set of explanatory variables/regressors (xi1, . . ., xip) is de-fined, as in our analysis in Eq. (5), the multiple linear re-gression model is fitted and the rere-gression coefficients for each explanatory variable(βk, k=0, . . ., p)included in the model are estimated by minimising the sum of squared unex-plained parts. The coefficient of determination(R2)can then be expressed using the fitted response values(yˆi)and esti-mated coefficients(βˆk)as the ratio between the model and total sum of squares (MSS and TSS respectively), i.e.R2=
MSS T SS =
Pn i=1([yi− ¯y)2 Pn
i=1(yi− ¯y)2. The LMG method decomposes the coef-ficient of determination into non-negative contributions that sum to the totalR2. First sequential (i.e. regressors are used in listed order, e.g. as given in our model in Eq. 5) sums of squares (SSS) are derived via analysis of variance (ANOVA). These sequential sums of squares, for each regressor, sum to the MSS of the TSS. Next sequentialR2 contributions are derived by dividing SSS by TSS. These sequentialR2 contri-butions are then utilized in the LMG method. As the order of the explanatory variables in any regression model is a permu-tation of the available regressorsx1, . . ., xp, it can be denoted
by the tuple of indicesr=(r1, . . ., rp). The set of regressors
entered in the model before regressorxkin the order ofrcan
then be denoted asSk(r). Thus the portion ofR2allocated to
explanatory variablexkin the orderrcan be written as
seqR2({xk}|Sk(r))=R2({xk} ∪Sk(r))−R2(Sk(r)). (2)
Using Eq. (2) the metric LMG can be written as LMG(xk)=
1 p!
X
permutation
seqR2({xk}|r), (3)
which can be further simplified to LMG(xk)=
1 p!
X
S⊆{x1,...,xp}/{xk}
n(S)!(p−n(S)−1)!
seqR2({xk}|S), (4)
as orders with the sameSk(r)can be summarized into one
summand (Grömping, 2006).
Figure 1.Time series for several quantities measured directly during the CLACE2011 campaign or derived from other CLACE2011 data. The number of CCN, shown in the top panel, refers the number of particles larger than 80 nm in diameter, which are considered potential CCN in constructing the statistical models (see text). In the bottom panel, the colour of the points indicates the wind direction, with yellow showing wind classified as being northwest and red southeast. Data are only plotted for times when the JFJ was in cloud.
JFJ, Switzerland. Additionally, the best performing regres-sion model was run for subsets of the data corresponding to the different years, and wind directions, to identify any fea-tures in the data which were particular to these subsets. The aim of this analysis was to determine whether a single statis-tical model can be constructed which will be generally appli-cable for the prediction of the number of cloud droplets for all years and wind directions.
5 Results
In total, 2399 data points were included in the analysis, with the majority being from 2010 (1087) and 2011 (896). Data were limited in 2002 (206 points) and 2004 (210 points) compared to those in 2010 and 2011, since there were more episodes of entrainment or partially glaciated clouds where data were excluded from this analysis. The 2002 campaign was relatively short and the time resolution of the measure-ment data set was lower in 2004 and 2002 than in later years, as described above, yielding fewer data points. In Figs. 1 to 4, time series of the predictor variables are shown for each campaign. In these plots, it can be seen that the data sets in-clude a wide range of conditions with respect to meteorol-ogy and air parcel composition. In the upper panels of the plots,nCCN is plotted together withnact. In 2011 and 2010
(Figs. 1 and 2) there are episodes of relatively high nCCN,
during which not all particles larger than 80 nm are activated,
as shown by the lowernactnumbers. Additionally, the
frac-tion of particles that are activated appears to be lower when the wind is from the southeast (red symbols in the bottom panel of the plots). In 2004 (Fig. 3), however,nCCN is
gen-erally fairly low, with, in a few cases, largernact than CCN,
indicating that also particles below the chosen cut-off diam-eter for potential CCN are being activated. In 2002 (Fig. 4), there is a broad range ofnCCNvalues, and activation appears
to be high in almost all cases, regardless of wind direction or updraught velocity. In all years, the mixing ratios of CO and O3(second panel) appear to be fairly well correlated with
each other, except around day 12 of the 2002 campaign (over-allR=0.65). There does not appear to be an appreciable link between wind direction and CO or O3mixing ratio. The
temperature range is similar for all the data sets, with tem-peratures generally between 270 and 280 K. An episode of warmer temperatures in the first half of the 2010 campaign corresponds with relatively high CO and O3values, as well as
higher aerosol number concentrations. The cooling after day 20 is accompanied by a marked reduction innCCN, as well as
Figure 2.As for Fig. 1 but for CLACE2010. Note that the axis ranges differ from those in Fig. 1.
Figure 3.As for Fig. 1 but for CLACE2004. Note that the axis ranges differ from those in Fig. 1.
5.1 Statistical relationships for combined data
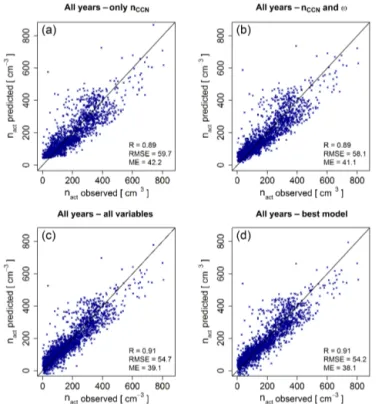
The modelled number of cloud droplets is plotted against the observed number (nact), for a variety of statistical model
formulations, in Fig. (5). In panel a, only nCCN is used to
predict the number of cloud droplets. Already here a good relationship is found, with a correlation (R) of 0.89;
updraught velocity rather than the updraught velocity itself. The latter statistical model was found to provide the best rep-resentation of the observed number of droplets, with an R value of 0.91, RMSE of 54.2, and a mean error (ME) of 38.1. The statistical model presented in panel d of Fig. 5 pro-vides a simple and reasonably accurate way of predicting the number of cloud droplets formed based on only a few ex-planatory variables. The number of activated aerosol (con-sidered equivalent to the number of droplets) predicted by this model is given by
nact =0.57nCCN+2.58O3+0.03H−1.02CO
+28.48 log(ω)−41.28, (5)
where ωis the estimated updraught velocity at cloud base in m s−1, CO and O3are mixing ratios in ppb, andH is the
height of the JFJ above the cloud base in metres (H must be greater than 0).
The model considering only the number of CCN, as shown in panel a of Fig. 5, is
nact=0.57nCCN+43.27. (6)
The same analysis was performed with changes in the min-imum size of aerosol considered to be CCN to 70, 90, and 100 nm (Fig. 6), but this did not improve the model skill in relation to the results obtained when counting only aerosol larger than 80 nm to determinenCCN. In fact, there was little
variation in the model skill when these different size criteria were used in the definition of potential CCN.
It should be noted that at very low nCCN, the statistical
model may return negative values for the number of droplets, which is obviously unphysical. However, this only applies to a very small number of points (16 of the 2399 points pre-sented here) and thus does not compromise the general ap-plicability of the proposed model.
5.2 Comparison with physically based parametrization To put the results presented in Figs. 5 and 6 into the context of previous work, a state of the art cloud droplet formation parametrization was used to calculate the cloud droplet num-ber for the same data points. Here we apply the sectional form of the cloud droplet formation model of Nenes and Se-infeld (2003) and Fountoukis and Nenes (2005), with the gi-ant CCN correction as described by Barahona et al. (2010). In applying this parametrization, input data are required, describing the chemical composition, aerosol size distribu-tion, updraught velocity, pressure, and temperature. For the aerosol, the size distributions obtained by the SMPS are used (in original bin form), while an average aerosol hygroscop-icity of 0.25 (corresponding to an aerosol mixture of roughly 42 % ammonium sulfate and 48 % insoluble aerosol) is as-sumed, which is similar to the hygroscopicity value found from 17 months of measurements at the JFJ by Jurányi et al. (2011), for particles with a critical dry diameter of around
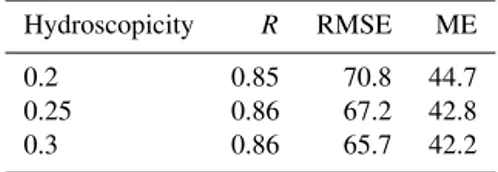
Table 2.Parameters describing the performance of the microphys-ical parametrization in capturing the number of observed cloud droplets, when run for three different hydroscopicity parameters.
Hydroscopicity R RMSE ME
0.2 0.85 70.8 44.7 0.25 0.86 67.2 42.8 0.3 0.86 65.7 42.2
80–100 nm. The parametrization was also run for the overall median hygroscopicity value given by Jurányi et al. (2011) of 0.2, as well as a value of 0.3, to test the sensitivity of the re-sults to small changes in assumed hygroscopicity within the bounds of that which has been measured at the JFJ. Vertical velocity for the parametrization input was calculated using the method of Hammer et al. (2014), multiplied by an esti-mated correction factor of 0.25, following the suggestions of Hammer et al. (2015). Pressure and temperature at cloud base are also used, calculated in the same way as for the statisti-cal model. A comparison of the predicted number of cloud droplets and the number of observed cloud residuals is shown in Fig. 7. The agreement between the modelled and observed data is excellent, with anRvalue of 0.86, RMSE of 67.2, and an ME of 42.8. The errors for Eq. (5), in panel d of Fig. 5, are only slightly lower than this. TheRand error values for the microphysical parametrization run for the three different hygroscopicity parameters are shown in Table 2. There it can be seen that within the range of likely hygroscopicity values for the JFJ there is little variation in theR values or errors from the model calculations. A slight decrease in the RMSE and ME is found when the hygroscopicity value is increased from 0.2 to 0.25 and 0.3.
5.3 Difference between wind directions
Figure 4.As for Fig. 1 but for CLACE2002. Note that the axis ranges differ from those in Fig. 1.
Figure 5.The number of cloud droplets calculated using different statistical models, plotted against the observed number of residuals. The model used for(a)included only thenCCN; for(b)nCCNand
updraught velocity are included in the model; in(c)all variables are included. In(d) all variables are included, but the log of the updraught velocity is used.
Figure 6.The number of cloud droplets calculated using a statistical model, based on a regression analysis including only the number of potential CCN, plotted against the observed number of residuals. Potential CCN are considered to be all particles with a diameter(a)
Figure 7.The number of cloud droplets calculated with the micro-physical parametrization, plotted against the measured number of residuals.
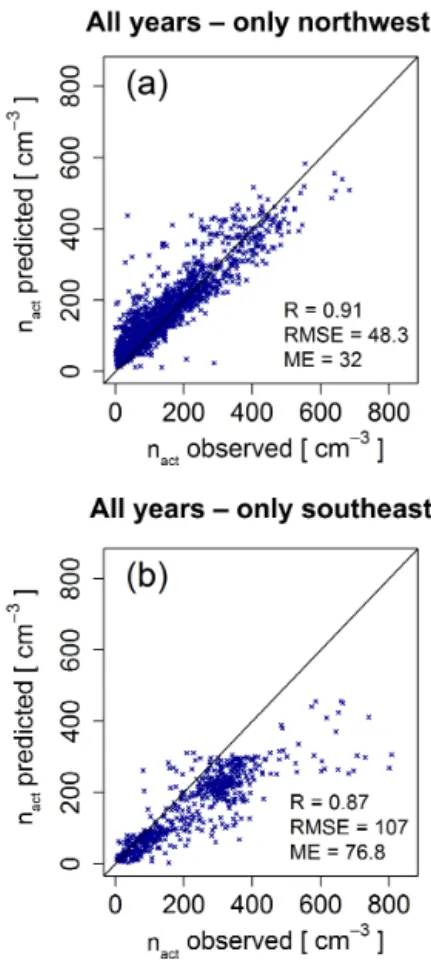
Figure 8.The modelled number of cloud droplets (Eq. 5) plotted against the observed number of residuals. Only data for northwest-ern wind conditions are included in(a), while only data for south-eastern wind directions are included in(b).
Therefore there appears to be no systematic bias introduced by considering both wind directions in the model together.
The results of the microphysical parametrization simula-tions, separated by wind direction, are shown in Fig. 9. Here it is seen that the microphysical parametrization is better able
Figure 9.The number of cloud droplets calculated by the micro-physical parametrization, separated by wind direction, compared to the number of observed cloud droplet residuals.
to represent the number of droplets in the northwestern wind case (Rof 0.91), while in the southeastern case the RMSE in-creases to 107, and the model underestimates the number of cloud droplets, particularly for numbers of residuals above about 300 cm−3. This may be due to differences in turbu-lence and vertical wind velocity between the northwestern and southeastern wind cases, which are not resolved by our vertical wind velocity estimation.
5.4 Difference between years
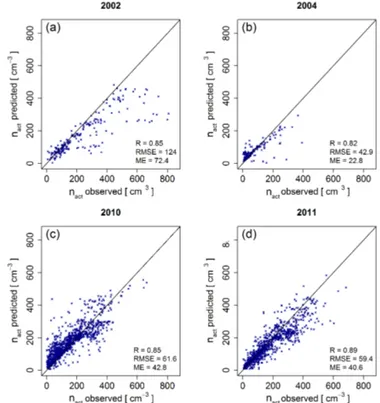
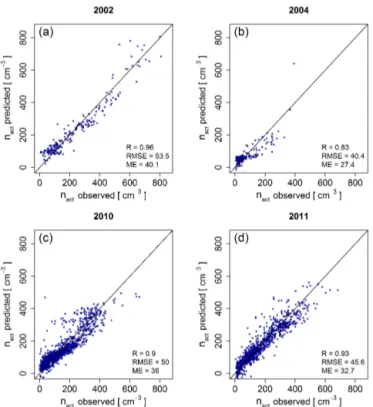
Figure 10.The modelled droplet numbers (Eq. 5) plotted against the observed number of residuals for each year separately.
all years, but many of the data points are below the 1:1 line and the RMSE was higher than for the other years (82.7). The data collected during 2004 are less well fit by the model (R of 0.76, RMSE of 47.2). However, as there were so few data points in 2004, and these were mostly at low droplet numbers, it is difficult to say whether this is due to the data sampled or the conditions being fundamentally different dur-ing 2004.
Again, the results of the microphysical parametrization are shown, this time separated by year, in Fig. 11. The RMSE for the 2002 data is higher than for the statistical model (124 vs. 82.7), and the microphysical parametrization was found to generally underestimate the number of cloud droplets in cases where there were more than approximately 200 resid-uals cm−3. It is interesting to note that the statistical model also generally underestimates the observed values for 2002. For 2004, the microphysical parametrization represents the observational data better than the statistical model, with anR value of 0.82 compared with the 0.76 of the statistical model and an RMSE of 42.9 compared to 47.2 for the statistical model. For 2010 and 2011, both the statistical model and the microphysical parametrization represent the observed data well.
The differences between the years were also investigated by re-fitting the statistical model to each individual year of data (Fig. 12). Naturally, this results in higher values of R and smaller errors. For example, in 2002 a good correla-tion is seen, withR of 0.96 and an RMSE of only 53.5. In
Figure 11.The number of cloud droplets calculated by the micro-physical parametrization, separated by year, compared to the num-ber of observed cloud droplet residuals.
2002, it can also be seen that the model underestimation of points above 500 drops cm−3seen in previous plots is not due to a saturation effect, as the observed droplet number can be predicted over the whole range ofnCCN with one set of
parameters. The model representation of 2004 is improved when the model is fitted to only 2004 data, but theRvalue is still only 0.83, lower than for the other years. This appears to be related to the overall low range ofnCCNobserved in 2004.
Both 2010 and 2011 are well represented by models fitted specifically to these data.
Figure 12.As for Fig. 10, but the model was re-calculated to pro-vide the best fit for each year individually.
the overlap of the inner quartile ranges in both Rand error values, the general model can be considered to be robust for the data set and applicable over a wide range of observed conditions.
6 Discussion
The analysis above shows that the number of cloud droplets can be reasonably well predicted by a single statistical model, containing thenCCN, the log of the updraught velocity, the
height above cloud base, and the mixing ratios of CO and O3.
The contribution of each variable to the variance explained by Eq. (5) is shown in Fig. 14, along with error bars, de-noting the range of the contributions of each variable in the random sampling analysis described in the previous section. The range of the parameters included in Fig. 14 is relatively small, indicating that the contribution to the explained vari-ance is similar regardless of the sample taken from the data set.
By far the greatest contribution to the explained variance is fromnCCN, but including additional explanatory variables
does improve the model with respect to absolute biases. The O3and CO mixing ratios contributed around 10 and 4 %
re-spectively of predictive ability to the model, suggesting that for sites such as the JFJ, which are located relatively far from direct emissions sources, the chemical history or source re-gion of the air mass is not greatly relevant in predicting the activation of aerosol to cloud droplets. Previously, Jurányi
Figure 13.A box plot of theR2, RMSE and ME values for the application of the general model (Eq. 5) to 1000 random samples of 100 data points from each year. The red boxes show the range ofR2and error values when Eq. (5) is applied to the sampled data, while the blue boxes show the ranges when the model is refitted individually to the data sampled in each case.
Figure 14. The contribution of each of the model variables in Eq. (5) to the explained variance. The error bars show the spread of the variation of the contribution values in the random samples from Fig. 13.
et al. (2011) and Hammer et al. (2014) found that the hy-groscopicity parameter of aerosols observed at the JFJ is not highly variable. The results presented here also indicate that changes in aerosol properties, which would generally be cor-related with CO or O3concentrations, are not large enough to
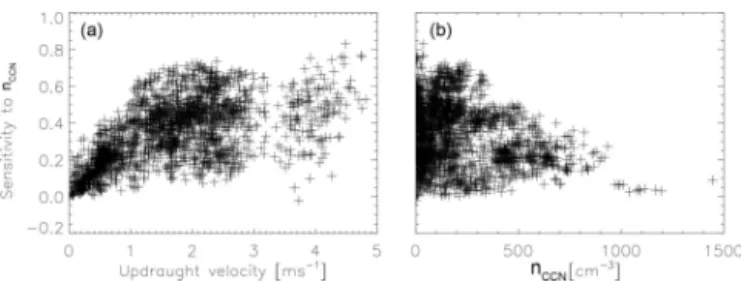
Figure 15.The sensitivity of the modelled droplet number to the up-draught velocity (corrected by a factor of 0.25, following Hammer et al. 2015)(a)and to the number of particles larger than 80 nm(b).
nactdoes not deteriorate at low particle numbers, possibly
be-cause in this work particles larger than 80 nm are considered potential CCN.
A linear dependence of the number of cloud droplets on nCCNimplies that there is not a strong competition for water
vapour during most of the activation phase of cloud droplet formation. Whether or not this occurs depends on the CCN number, the slope of the CCN spectrum, vertical velocity, the degree of external mixing, the presence of giant CCN (sea salt, dust), and temperature (e.g. Rissman et al., 2004; Reutter et al., 2009; Ghan et al., 1997; Morales Betancourt and Nenes, 2014). A good indicator of linearity is expressed by the partial sensitivity of the droplet number to the num-ber of aerosol,∂Nd/∂Na (also known as the aerosol–cloud
index, ACI), for a given set of aerosol and cloud formation conditions. The closer the ACI is to unity, the less competi-tion effects are present, linearity applies, and vice versa. The ACI can be calculated either numerically with a parcel model (Reutter et al., 2009) or with a parametrization adjoint (Riss-man et al., 2004; Moore et al., 2013; Morales Betancourt and Nenes, 2014). The latter is used here to establish the degree to which linearity holds for the conditions at the JFJ. The results of this calculation are shown in Fig. 15. In panel a, it can be seen that the ACI increases from near zero at low updraught velocities to around 0.4 at updraught velocities of approxi-mately 1 ms−1and higher (note that the updraught velocities shown in Fig. 15 have been corrected by a factor of 0.25, as described in Sect. 5.2). This suggests that the form of the relationship between the number of droplets andnCCN does
not change at updraught velocities higher than approximately 1 ms−1. Therefore while the updraught has only a small in-fluence on the number of cloud droplets under these condi-tions, it does slightly influence the relationship between the number concentration of aerosol and the number of droplets. Panel b of Fig. 15 shows the sensitivity of the droplet number tonCCN as a function ofnCCN. Here it can be seen that the
sensitivity does not display any obvious trend with increasing nCCN, supporting our choice of a linear relationship between
the number of droplets andnCCN.
These results correspond with previous studies. For exam-ple, Reutter et al. (2009) found the number of cloud droplets to be directly proportional to the particle number
concentra-tion when the ratio of updraught velocity to particle number concentration was high, but they found that, under low ra-tios, the number of cloud droplets formed was only depen-dent on the updraught velocity. In that study, the lower limit of the regime where the number of cloud droplets depends on the number of particles was found to be an updraught to particle number concentration ratio of 10−3ms−1cm3), which, for a CCN concentration of 800 cm−3, requires a ver-tical wind speed of only 0.8 ms−1. Examining Figs. 1 to 4, it can be seen that almost all of the northwestern wind cases, and most of the southeastern wind cases, have vertical wind speeds higher than 1 ms−1(if the wind speeds in Figs. 1 to 4 were corrected by a factor of 0.25, as was done for the mi-crophysical modelling, 67 % would still be above 1 ms−1). Therefore, based on the study of Reutter et al. (2009), a di-rect dependence of the number of droplets on the number of potential CCN would be expected. The study of Partridge et al. (2012) showed that under relatively clean conditions, the details of the aerosol number size distribution determined the number of cloud droplets; however, when the accumula-tion mode particle concentraaccumula-tions were above approximately 1000 cm−3, the chemical composition of the particles played the major role in determining the number of cloud droplets. Partridge et al. (2012) also found that the importance of the particle chemistry increases relatively to that of the particle sizes at lower updraught velocities. Under conditions where the aerosol population is externally mixed, the number of cloud droplets formed may also not be directly dependent on the number of CCN, as changes in the relative abun-dance of particles with differing hygroscopicities will influ-ence the formation of cloud droplets. Nevertheless, Dusek et al. (2006) found that there was little change in the acti-vation diameter of particles (less than 20 nm) when compar-ing polluted and background air masses at a non-urban site. These studies support the idea that for cloud formation at re-mote sites such as the JFJ, with updraught velocities above approximately 1.0 ms−1 and relatively low aerosol number concentrations, the number of cloud droplets formed should be dependent on the number and size of the aerosol present.
Finally, the statistical models and the microphysical parametrization presented in this study are compared with two existing parametrizations, those of Jones (1994) and Martin et al. (1994), both of which usednCCNto predict the
number of cloud droplets which would be formed. The Mar-tin et al. (1994) parametrization is given by
Ndroplets= −2.10×10⁻⁴A2+0.568A−27.9, (7)
Figure 16.A comparison of the statistical models developed in this study, and the microphysical parametrization, with the performance of two existing models by Martin et al. (1994) and Jones (1994), which are based only onnCCN.
The maritime parametrization is described as being valid over the range of aerosol number concentrations of 36 to 280 cm−3.
The Jones (1994) parametrization is derived from a com-bination of the continental and maritime parametrizations of Martin et al. (1994) and should therefore be valid over the range of aerosol number concentrations of 36 to 1500 cm−3. It is given by
Ndroplets=375
1−exph−2.5×10⁻³Ai. (8) The modelled cloud droplet number concentration is plot-ted against the measured values for Eqs. (5) and (6) as well as against the models of Martin et al. (1994) and Jones (1994) and the microphysical parametrization, in Fig. 16. Compar-ison of Eqs. (5) and (6) with the other models considered shows that, although all five models provide a similar degree of explained variance (between 74 and 83 %), error values are higher for the Jones (1994) and Martin et al. (1994) mod-els. The microphysical parametrization has a slightly lowerR value than the other models but has better error values than the Jones (1994) and Martin et al. (1994) models. While all five models show a good correlation between modelled and measured cloud droplet numbers, the model of Martin et al. (1994) has a too shallow slope, resulting in a general under-estimation of the observed values. Both the Jones (1994) and Martin et al. (1994) models have included a saturation effect at higher nCCN which limits the number of cloud droplets
formed, similarly to the effect described by Reutter et al. (2009). No such saturation effect is observed at the JFJ, but it cannot be ruled out that such an effect may occur at higher aerosol number concentrations than those presented here.
7 Conclusions
Using data from four summertime CLACE campaigns per-formed at the high-altitude research station at the Jungfrau-joch, we have shown that the number of cloud droplets formed in warm clouds can be rather accurately represented by a simple statistical model (Eq. 5), producing a similar degree of accuracy to that achieved with a microphysical parametrization. The majority of the variance in the observed
droplet numbers is explained by the number of potential CCN, which is defined in this study as the total number of particles with a dry diameter greater than 80 nm. Using the number of potential CCN alone, 79 % of the observed vari-ance is explained (Eq. 6). With the addition of further ex-planatory variables, such as CO and O3 mixing ratios, and
the height above cloud base, the RMSE and ME errors can be slightly reduced.
Although tuning the statistical model to each year of data separately produces slightly improved results, Eq. (5) repre-sents the observed droplet numbers from the individual years quite adequately. Likewise, the model is applicable to data from both of the predominant wind directions at the JFJ, and although there is more variability in the model’s ability to predict the number of droplets formed during southeasterly wind conditions, there appears to be no substantial bias.
In contrast to previous studies in which such models were constructed (e.g. Martin et al., 1994; Jones, 1994), no ev-idence for a saturation effect of high CCN numbers was observed; instead, the number of droplets formed increased continually withnCCN. Such a saturation effect is expected to
occur at higher aerosol number concentrations, for example closer to aerosol sources or in more polluted environments.
It should be noted that the statistical model is based only on data collected during summer campaigns and that periods with partially or fully glaciated clouds have been excluded from the data set (as described in Sect. 4.1). During such pe-riods the number of activated aerosol is also influenced by water uptake by ice particles, changing the relationship be-tween the number of CCN and the number of cloud droplets. The statistical model is thus considered valid only for liquid clouds.
effi-cient way to calculate the number of cloud droplets in warm clouds, when appropriately applied.
Acknowledgements. C. R. Hoyle was funded by Swiss National Science Foundation (SNSF) grant number 200021_140663. M. Gy-sel was supported by the ERC under grant 615922-BLACARAT. EU FP7 project BACCHUS (project number 603445) is ac-knowledged for financial support.A. Nenes acknowledges support from a US Department of Energy EaSM proposal, a Georgia Power Faculty Scholar chainr and from a Cullen-Peck Faculty Fellowship. The CLACE experiments were supported by the Global Atmosphere Watch plus (GAW+) research program through MeteoSwiss. Meteorological measurements from the SwissMetNet Network were obtained through MeteoSwiss. The JFJ experimental site is supported by the International Foundation High Altitude Research Stations Jungfraujoch and Gornergrat (HFSJG). The Swiss National Air Pollution Monitoring Network is run by Empa in collaboration with the Swiss Federal Office for the Environment.
Edited by: V.-M. Kerminen
References
Abdul-Razzak, H. and Ghan, S. J.: A parameterization of aerosol activation: 2. Multiple aerosol types, J. Geophys. Res.-Atmos., 105, 6837–6844, 2000.
Albrecht, B. A.: Aerosols, cloud microphysics, and fractional cloudiness, Science, 245, 1227–1230, 1989.
Anttila, T., Brus, D., Jaatinen, A., Hyvärinen, A.-P., Kivekäs, N., Romakkaniemi, S., Komppula, M., and Lihavainen, H.: Re-lationships between particles, cloud condensation nuclei and cloud droplet activation during the third Pallas Cloud Experi-ment, Atmos. Chem. Phys., 12, 11435–11450, doi:10.5194/acp-12-11435-2012, 2012.
Baltensperger, U., Gaggeler, H., Jost, D., Emmenegger, M., and Nageli, W.: Continuous background aerosol monitoring wiht the epiphaniometer, Atmos. Environ. Pt. A, 25, 629–634, 1991. Baltensperger, U., Gaggeler, H. W., Jost, D. T., Lugauer, M.,
Schwikowski, M., Weingartner, E., and Seibert, P.: Aerosol cli-matology at the high-alpine site Jungfraujoch, Switzerland, J. Geophys. Res.-Atmos., 102, 19707–19715, 1997.
Baltensperger, U., Schwikowski, M., Jost, D. T., Nyeki, S., Gaggeler, H. W., and Poulida, O.: Scavenging of atmospheric constituents in mixed phase clouds at the high-alpine site Jungfraujoch part I: Basic concept and aerosol scavenging by clouds, Atmos. Environ., 32, 3975–3983, 1998.
Barahona, D. and Nenes, A.: Parameterization of cloud droplet formation in large-scale models: Including effects of entrainment, J. Geophys. Res.-Atmos., 112, D16206, doi:10.1029/2007JD008473, 2007.
Barahona, D., West, R. E. L., Stier, P., Romakkaniemi, S., Kokkola, H., and Nenes, A.: Comprehensively accounting for the effect of giant CCN in cloud activation parameterizations, Atmos. Chem. Phys., 10, 2467–2473, doi:10.5194/acp-10-2467-2010, 2010. Boucher, O., Randall, D., Artaxo, P., Bretherton, C., Feingold, G.,
Forster, P., Kerminen, V.-M., Kondo, Y., Liao, H., Lohmann, U., Rasch, P., Satheesh, S., Sherwood, S., Stevens, B., and Zhang,
X.: Cloud and Aerosols, in: Climate Change 2013: The Physi-cal Science Basis. Contribution of Working Group I to the Fifth Assessment Report of the Intergovernmental Panel on Climate Change, edited by: Stocker, T. F., Qin, D., Plattner, G.-K., Tig-nor, M., Allen, S. K., Boschung, J., Nauels, A., Xia, Y., Bex, V., and Midgley, P. M., Cambridge University Press, Cambridge, United Kingdom and New York, NY, USA, 571–657, 2013. Bukowiecki, N., Weingartner, E., Martin, G., Collaud Coen, M.,
Zieger, P., Herrmann, E., Steinbacher, M., Gäggeler, H. W., and Baltensperger, U.: A Review of More Than 20 Years of Aerosol Observation at the High Altitude Research Station Jungfraujoch, Switzerland (3580 m a.s.l.), Aerosol Air Qual. Res., 16, 764–788, doi:10.4209/aaqr.2015.05.0305, 2016.
Christensen, S. I. and Petters, M. D.: The role of temperature in cloud droplet activation, J. Phys. Chem. A, 116, 9706–9717, 2012.
Conant, W. C., VanReken, T. M., Rissman, T. A., Varutbangkul, V., Jonsson, H. H., Nenes, A., Jimenez, J. L., Delia, A. E., Bahreini, R., Roberts, G. C., Flagan, R. C., and Seinfeld, J. H.: Aerosol-cloud drop concentration closure in warm cumulus, J. Geophys. Res.-Atmos., 109, D13204, doi:10.1029/2003JD004324, 2004. Cozic, J., Verheggen, B., Mertes, S., Connolly, P., Bower, K.,
Petzold, A., Baltensperger, U., and Weingartner, E.: Scav-enging of black carbon in mixed phase clouds at the high alpine site Jungfraujoch, Atmos. Chem. Phys., 7, 1797–1807, doi:10.5194/acp-7-1797-2007, 2007.
Cozic, J., Verheggen, B., Weingartner, E., Crosier, J., Bower, K. N., Flynn, M., Coe, H., Henning, S., Steinbacher, M., Henne, S., Collaud Coen, M., Petzold, A., and Baltensperger, U.: Chemi-cal composition of free tropospheric aerosol for PM1 and coarse mode at the high alpine site Jungfraujoch, Atmos. Chem. Phys., 8, 407–423, doi:10.5194/acp-8-407-2008, 2008.
Cui, J., Sprenger, M., Staehelin, J., Siegrist, A., Kunz, M., Henne, S., and Steinbacher, M.: Impact of stratospheric intrusions and intercontinental transport on ozone at Jungfraujoch in 2005: comparison and validation of two Lagrangian approaches, At-mos. Chem. Phys., 9, 3371–3383, doi:10.5194/acp-9-3371-2009, 2009.
Dusek, U., Frank, G. P., Hildebrandt, L., Curtius, J., Schneider, J., Walter, S., Chand, D., Drewnick, F., Hings, S., Jung, D., Bor-rmann, S., and Andreae, M. O.: Size Mmatters more than chem-istry for cloud-nucleating ability of aerosol particles, Science, 312, 1375–1378, 2006.
Fitzgerald, J. W. and Spyers-Duran, P. A.: Changes in cloud nucleus concentration and cloud droplet size distribution associated with pollution from St. Louis, J. Appl. Meteor., 12, 511–516, 1973. Fountoukis, C. and Nenes, A.: Continued development of
a cloud droplet formation parameterization for global climate models, J. Geophys. Res.-Atmos., 110, D11212, doi:10.1029/2004JD005591, 2005.
Friedman, A.: Statistics for library and information services: A primer for using open source R software for accessibility and visualization, Rowman & Littlefield, 2015.
Fröhlich, R., Cubison, M. J., Slowik, J. G., Bukowiecki, N., Canonaco, F., Croteau, P. L., Gysel, M., Henne, S., Herrmann, E., Jayne, J. T., Steinbacher, M., Worsnop, D. R., Baltensperger, U., and Prévôt, A. S. H.: Fourteen months of on-line measure-ments of the non-refractory submicron aerosol at the Jungfrau-joch (3580 m a.s.l.) – chemical composition, origins and or-ganic aerosol sources, Atmos. Chem. Phys., 15, 11373–11398, doi:10.5194/acp-15-11373-2015, 2015.
Gerber, H.: Supersaturation and droplet spectral evolution in fog, J. Atmos. Sci., 48, 2569–2588, 1991.
Ghan, S. J., Leung, L. R., Easter, R. C., and Abdul-Razzak, H.: Pre-diction of cloud droplet number in a general circulation model, J. Geophys. Res.-Atmos., 102, 21777–21794, 1997.
Gilge, S., Plass-Duelmer, C., Fricke, W., Kaiser, A., Ries, L., Buch-mann, B., and Steinbacher, M.: Ozone, carbon monoxide and nitrogen oxides time series at four alpine GAW mountain sta-tions in central Europe, Atmos. Chem. Phys., 10, 12295–12316, doi:10.5194/acp-10-12295-2010, 2010.
Grömping, U.: Relative importance for linear regression in R: the package relaimpo, Journal of Statistical Software, 17, 1–27, 2006.
Grömping, U.: Estimators of relative importance in linear regression based on variance decomposition, American Statistican, 61, 139– 147, 2007.
Hammer, E., Bukowiecki, N., Gysel, M., Jurányi, Z., Hoyle, C. R., Vogt, R., Baltensperger, U., and Weingartner, E.: Investigation of the effective peak supersaturation for liquid-phase clouds at the high-alpine site Jungfraujoch, Switzerland (3580 m a.s.l.), Atmos. Chem. Phys., 14, 1123–1139, doi:10.5194/acp-14-1123-2014, 2014.
Hammer, E., Bukowiecki, N., Luo, B. P., Lohmann, U., Marcolli, C., Weingartner, E., Baltensperger, U., and Hoyle, C. R.: Sen-sitivity estimations for cloud droplet formation in the vicinity of the high-alpine research station Jungfraujoch (3580 m a.s.l.), Atmos. Chem. Phys., 15, 10309–10323, doi:10.5194/acp-15-10309-2015, 2015.
Henning, S., Weingartner, E., Schmidt, S., Wendisch, M., Gaggeler, H. W., and Baltensperger, U.: Size-dependent aerosol activation at the high-alpine site Jungfraujoch (3580 m a.s.l.), Tellus B, 54, 82–95, 2002.
Herrmann, E., Weingartner, E., Henne, S., Vuilleumier, L., Bukowiecki, N., Steinbacher, M., Conen, F., Collaud Coen, M., Hammer, E., Jurányi, Z., Baltensperger, U., and Gysel, M.: Anal-ysis of long-term aerosol size distribution data from Jungfrau-joch with emphasis on free tropospheric conditions, cloud in-fluence, and air mass transport, J. Geophys. Res.-Atmos., 120, 9459–9480, 2015.
Hu, Y. X. and Stamnes, K.: An accurate parameterization of the radiative properties of water clouds suitable for use in climate models, J. Climate, 6, 728–742, 1993.
Johnson, B. T., Shine, K. P., and Forster, P. M.: The semi-direct aerosol effect: Impact of absorbing aerosols on marine stratocu-mulus, Q. J. Roy. Meteor. Soc., 130, 1407–1422, 2004. Jones, A.: A climate model study of indirect radiative forcing by
anthropogenic sulphate aerosols, Nature, 370, 450–453, 1994.
Jurányi, Z., Gysel, M., Weingartner, E., DeCarlo, P. F., Kam-mermann, L., and Baltensperger, U.: Measured and modelled cloud condensation nuclei number concentration at the high alpine site Jungfraujoch, Atmos. Chem. Phys., 10, 7891–7906, doi:10.5194/acp-10-7891-2010, 2010.
Jurányi, Z., Gysel, M., Weingartner, E., Bukowiecki, N., Kammer-mann, L., and Baltensperger, U.: A 17 month climatology of the cloud condensation nuclei number concentration at the high alpine site Jungfraujoch, J. Geophys. Res.–Atmos., 116, 2156– 2202, 2011.
Kammermann, L., Gysel, M., Weingartner, E., and Baltensperger, U.: 13-month climatology of the aerosol hygroscopicity at the free tropospheric site Jungfraujoch (3580 m a.s.l.), Atmos. Chem. Phys., 10, 10717–10732, doi:10.5194/acp-10-10717-2010, 2010. King, S. M., Rosenoern, T., Shilling, J. E., Chen, Q., and Martin, S. T.: Increased cloud activation potential of secondary organic aerosol for atmospheric mass loadings, Atmos. Chem. Phys., 9, 2959–2971, doi:10.5194/acp-9-2959-2009, 2009.
Kivekäs, N., Kerminen, V.-M., Anttila, T., Korhonen, H., Li-havainen, H., Komppula, M., and Kulmala, M.: Parameterization of cloud droplet activation using a simplified treatment of the aerosol number size distribution, J. Geophys. Res.-Atmos., 113, D15207, doi:10.1029/2007JD009485, 2008.
Köhler, H.: The nucleus in and the growth of hygro-scopic droplets, Trans. Faraday Soc., 32, 1152–1161, doi:10.1039/TF9363201152, 1936.
Kruskal, W.: Relative importance by averaging over orderings, American Statistican, 41, 6–10, 1987.
Kumar, P., Sokolik, I. N., and Nenes, A.: Parameterization of cloud droplet formation for global and regional models: including ad-sorption activation from insoluble CCN, Atmos. Chem. Phys., 9, 2517–2532, doi:10.5194/acp-9-2517-2009, 2009.
Liang, Q., Jaegle, L., Jaffe, D. A., Weiss-Penzias, P., Heckman, A., and Snow, J. A.: Long-range transport of Asian pollution to the northeast Pacific: Seasonal variations and transport pathways of carbon monoxide, J. Geophys. Res.-Atmos., 109, D23S07, doi:10.1029/2003JD004402, 2004.
Lindeman, R., Merenda, P., and Gold, R.: Introduction to Bivariate and Multivariate Analysis, Scott Foresman, Glenview IL., 1980. Lugauer, M., Baltensperger, U., Furger, M., Gaggeler, H., Jost, D., Schwikowski, M., and Wanner, H.: Aerosol transport to the high Alpine sites Jungfraujoch (3454 m a.s.l.) and Colle Gnifetti (4452 m a.s.l.), Tellus B, 50, 76–92, 1998.
Martin, G. M., Johnson, D. W., and Spice, A.: The measurement and parameterization of effective radius of droplets in warm stra-tocumulus clouds, J. Atmos. Sci., 51, 1823–1842, 1994. McFiggans, G., Artaxo, P., Baltensperger, U., Coe, H., Facchini,
M. C., Feingold, G., Fuzzi, S., Gysel, M., Laaksonen, A., Lohmann, U., Mentel, T. F., Murphy, D. M., O’Dowd, C. D., Snider, J. R., and Weingartner, E.: The effect of physical and chemical aerosol properties on warm cloud droplet activation, Atmos. Chem. Phys., 6, 2593–2649, doi:10.5194/acp-6-2593-2006, 2006.
Meskhidze, N., Nenes, A., Conant, W. C., and Seinfeld, J. H.: Eval-uation of a new cloud droplet activation parameterization with in situ data from CRYSTAL-FACE and CSTRIPE, J. Geophys. Res.-Atmos., 110, D16202, doi:10.1029/2004JD005703, 2005. Moore, R. H., Karydis, V. A., Capps, S. L., Lathem, T. L., and
an assessment using observations and a global model adjoint, Atmos. Chem. Phys., 13, 4235–4251, doi:10.5194/acp-13-4235-2013, 2013.
Morales Betancourt, R. and Nenes, A.: Understanding the contri-butions of aerosol properties and parameterization discrepan-cies to droplet number variability in a global climate model, Atmos. Chem. Phys., 14, 4809–4826, doi:10.5194/acp-14-4809-2014, 2014.
Nenes, A. and Seinfeld, J. H.: Parameterization of cloud droplet formation in global climate models, J. Geophys. Res.-Atmos., 108, 4415, doi:10.1029/2002JD002911, 2003.
Nenes, A., Charlson, R. J., Facchini, M. C., Kulmala, M., Laak-sonen, A., and Seinfeld, J. H.: Can chemical effects on cloud droplet number rival the first indirect effect?, Geophys. Res. Lett., 29, 1–4, 2002.
Nyeki, S., Baltensperger, U., Colbeck, I., Jost, D., Weingartner, E., and Gaggeler, H.: The Jungfraujoch high-Alpine research station (3454 m) as a background clean continental site for the mea-surement of aerosol parameters, J. Geophys. Res.-Atmos., 103, 6097–6107, 1998.
Partridge, D. G., Vrugt, J. A., Tunved, P., Ekman, A. M. L., Struthers, H., and Sorooshian, A.: Inverse modelling of cloud-aerosol interactions – Part 2: Sensitivity tests on liquid phase clouds using a Markov chain Monte Carlo based simulation ap-proach, Atmos. Chem. Phys., 12, 2823–2847, doi:10.5194/acp-12-2823-2012, 2012.
Petters, M. D. and Kreidenweis, S. M.: A single parameter repre-sentation of hygroscopic growth and cloud condensation nucleus activity, Atmos. Chem. Phys., 7, 1961–1971, doi:10.5194/acp-7-1961-2007, 2007.
R Core Team: R: A Language and Environment for Statistical Com-puting, R Foundation for Statistical ComCom-puting, Vienna, Austria, http://www.R-project.org, ISBN 3-900051-07-0, 2014.
Raga, G. B. and Jonas, P. R.: On the link between cloud-top radia-tive properties and sub-cloud aerosol concentrations, Q. J. Roy. Meteor. Soc., 119, 1419–1425, 1993.
Reutter, P., Su, H., Trentmann, J., Simmel, M., Rose, D., Gunthe, S. S., Wernli, H., Andreae, M. O., and Pöschl, U.: Aerosol- and updraught-limited regimes of cloud droplet formation: influence of particle number, size and hygroscopicity on the activation of cloud condensation nuclei (CCN), Atmos. Chem. Phys., 9, 7067– 7080, doi:10.5194/acp-9-7067-2009, 2009.
Rissman, T., Nenes, A., and Seinfeld, J.: Chemical amplification (or dampening) of the Twomey effect: Conditions derived from droplet activation theory, J. Atmos. Sci., 61, 919–930, 2004. Shilling, J. E., King, S. M., Mochida, M., and Martin, S. T.: Mass
spectral evidence that small changes in composition caused by oxidative aging processes alter aerosol CCN properties, J. Phys. Chem. A, 111, 3358–3368, 2007.
Shulman, M., Jacobson, M., Carlson, R., Synovec, R., and Young, T.: Dissolution behavior and surface tension effects of organic compounds in nucleating cloud droplets, Geophys. Res. Lett., 23, 277–280, 1996.
Sjogren, S., Gysel, M., Weingartner, E., Alfarra, M. R., Duplissy, J., Cozic, J., Crosier, J., Coe, H., and Baltensperger, U.: Hygro-scopicity of the submicrometer aerosol at the high-alpine site Jungfraujoch, 3580 m a.s.l., Switzerland, Atmos. Chem. Phys., 8, 5715–5729, 2008.
Spiegel, J. K., Zieger, P., Bukowiecki, N., Hammer, E., Weingart-ner, E., and Eugster, W.: Evaluating the capabilities and uncer-tainties of droplet measurements for the fog droplet spectrometer (FM-100), Atmos. Meas. Tech., 5, 2237–2260, doi:10.5194/amt-5-2237-2012, 2012.
Staudt, A., Jacob, D., Logan, J., Bachiochi, D., Krishnamurti, T., and Sachse, G.: Continental sources, transoceanic transport, and interhemispheric exchange of carbon monoxide over the Pacific, J. Geophys. Res.-Atmos., 106, 32571–32589, 2001.
Tonidandel, S. and LeBreton, J. M.: Relative importance analysis: A useful supplement to regression analysis, J. Bus. Psychol., 26, 1–9, 2011.
Twomey, S.: Pollution and the planetary albedo, Atmos. Environ., 8, 1251–1256, doi:doi:10.1016/0004-6981(74)90004-3, 1974. Twomey, S. A.: The influence of pollution on the shortwave albedo
of clouds, J. Atmos. Sci., 34, 1149–1152, 1977.
Verheggen, B., Cozic, J., Weingartner, E., Bower, K., Mertes, S., Connolly, P., Gallagher, M., Flynn, M., Choularton, T., and Bal-tensperger, U.: Aerosol partitioning between the interstitial and the condensed phase in mixed-phase clouds, J. Geophys. Res.-Atmos., 112, 2156–2202, 2007.
Weingartner, E., Nyeki, S., and Baltensperger, U.: Seasonal and di-urnal variation of aerosol size distributions (10< D <750 nm) at a high-alpine site (Jungfraujoch 3580 m a.s.l.), J. Geophys. Res.-Atmos., 104, 26809–26820, 1999.
Wiedensohler, A., Birmili, W., Nowak, A., Sonntag, A., Weinhold, K., Merkel, M., Wehner, B., Tuch, T., Pfeifer, S., Fiebig, M., Fjäraa, A. M., Asmi, E., Sellegri, K., Depuy, R., Venzac, H., Vil-lani, P., Laj, P., Aalto, P., Ogren, J. A., Swietlicki, E., Williams, P., Roldin, P., Quincey, P., Hüglin, C., Fierz-Schmidhauser, R., Gysel, M., Weingartner, E., Riccobono, F., Santos, S., Grün-ing, C., Faloon, K., Beddows, D., Harrison, R., Monahan, C., Jennings, S. G., O’Dowd, C. D., Marinoni, A., Horn, H.-G., Keck, L., Jiang, J., Scheckman, J., McMurry, P. H., Deng, Z., Zhao, C. S., Moerman, M., Henzing, B., de Leeuw, G., Löschau, G., and Bastian, S.: Mobility particle size spectrometers: har-monization of technical standards and data structure to facili-tate high quality long-term observations of atmospheric parti-cle number size distributions, Atmos. Meas. Tech., 5, 657–685, doi:10.5194/amt-5-657-2012, 2012.
Yashiro, H., Sugawara, S., Sudo, K., Aoki, S., and Nakazawa, T.: Temporal and spatial variations of carbon monoxide over the western part of the Pacific Ocean, J. Geophys. Res.-Atmos., 114, D08305, doi:10.1029/2008JD010876, 2009.
Zellweger, C., Forrer, J., Hofer, P., Nyeki, S., Schwarzenbach, B., Weingartner, E., Ammann, M., and Baltensperger, U.: Partition-ing of reactive nitrogen (NOy) and dependence on meteoro-logical conditions in the lower free troposphere, Atmos. Chem. Phys., 3, 779–796, doi:10.5194/acp-3-779-2003, 2003.
Zellweger, C., Hüglin, C., Klausen, J., Steinbacher, M., Vollmer, M., and Buchmann, B.: Inter-comparison of four different car-bon monoxide measurement techniques and evaluation of the long-term carbon monoxide time series of Jungfraujoch, At-mos. Chem. Phys., 9, 3491–3503, doi:10.5194/acp-9-3491-2009, 2009.
Ozone-CO correlations determined by the TES satellite instrument in continental outflow regions, Geophys. Res. Lett., 33, L18804, doi:10.1029/2006GL026399, 2006.