*e-mail: [email protected]
Thermal Characterization of Commercially Pure Titanium for Dental Applications
Enori Gemelli, Alex Scariot, Nelson Heriberto Almeida Camargo*
Santa Catarina State University – UDESC, Center of Technological Science – CCT,
Department of Mechanical Engineering – DEM, Campus Universitário, Bairro Bom Retiro,
P.O. Box 631, Zip code 89223-100 Joinville - SC, Brazil
Received: August 4, 2006; Revised: June 19, 2007
Thermal characterization of commercially pure titanium was carried out in dry air to investigate the oxidation kinetics, the oxide structures and their properties. Oxidation kinetics were performed by thermogravimetry in isothermal conditions between 300 and 750 °C for 48 hours and the oxide structures were studied by differential thermal analyses and X ray diffraction between room temperature and 1000 °C. The oxidation kinetic increases with temperature and is very fast in the initial period of oxidation, decreasing rapidly with time, especially up to 600 °C. Kinetic laws varied between the inverse logarithmic for the lower temperatures (300 and 400 °C) and the parabolic for the higher temperatures (650, 700 and 750 °C). Evidences from X ray diffraction and differential thermal analyses showed that crystallization of the passive oxide film, formed at room temperature, into anatase occurs at about 276 °C. The crystallized oxide structure is composed of anatase between 276 and 457 °C, anatase and rutile sublayers between 457 and 718 °C, and a pure layer of rutile after 718 °C. Rockwell-C adhesion tests reveled that the oxide films formed up to 600 °C have a good adhesion. Vickers indentations on the oxidized surfaces showed that the hardness of the oxide film, measured at 600 and 650 °C, is approximately 9500 MPa. At these temperatures the surface roughness varied between 0.90 and 1.30 µm.
Keywords: titanium, corrosion, biomaterial, dental material
1. Introduction
Titanium is one of the few metals on which osseointegration takes place after implantation1. There are two types of response after
implan-tation of a biomaterial2: the first type involves the formation of a fibrous
soft tissue capsule around the implant. This fibrous tissue capsule does not ensure proper biomechanical fixation and leads to clinical failure of the implant. The second type of bone response is related to direct bone-implant contact without an intervening connective tissue layer. This is what is known as osseointegration. This biological interaction occurs with the titanium and its alloys because the oxide film formed on the material is bio-inert and prevents the dissolution of metallic ions into the surrounding tissue3, leading bone cells attaching directly on
the oxide surface, without the formation of a fibrous tissue capsule4,5.
Osseointegration and cell proliferation between the implant (oxide film) and the bone depend on the morphology (roughness) and composition of the oxide layer6,7. Nevertheless, the characteristics of the oxide
film depend on the chemical composition, structure, morphology and mechanical conditions of the implanted material.
There are numerous reports that demonstrate that the surface roughness of titanium implants affects the rate of osseointegration and biomechanical fixation8,9. Also, early fixation and long-term
mechanical stability of the implant can be improved by a high roughness profile compared to smooth surfaces10-12. Many surface
treatments have been proposed to create a rough surface and improve the osseointegration of titanium dental implants. These methods use titanium plasma-spraying, blasting with ceramic particles, acid-etch-ing and anodization (anodic oxidation). Recent studies demonstrated that anodization of titanium in strong acids increases the thickness and roughness of the oxide layer, which leads to a beneficial effect on the biological performance of the titanium implants13-16. The result
of the anodization is to thicken the oxide layer to more than 1 µm on titanium. Anodized surfaces result in strong reinforcement of the bone response with higher values for biomechanical and histomorphometric tests in comparison to machined surfaces17,18. A higher clinical success
rate was observed for the anodized titanium implants in comparison with turned titanium surfaces of similar shapes. These beneficial ef-fect promoted by anodic oxidation may be also achieved by thermal oxidation. In this case, similar structures, thickness and morphology can be obtained by controlling the temperature and the exposition time of titanium in oxygen containing atmosphere. Nevertheless, data available in the literature are not enough to evaluate the use of this technique on dental implants. Investigations on titanium were performed basically at 600 °C for short period of time (30 minutes), indicating that this treatment increases surface roughness, resulting in greater numbers of attached osteoblasts and higher cell activity19.
These results are also backed up by Advincula et al.20, who
When titanium is exposed to ambient air at room temperature, a passive oxide film is spontaneously formed on its surface. This passive film is amorphous, very thin (5-10 nm thickness21), and composed of
three layers22,23: the first layer adjacent to metallic titanium is TiO, the
intermediary layer is Ti2O3, and the third layer, which is in contact with the environment, is anatase TiO2. At room temperature, anatase TiO2 is the most important layer in thickness and responsible for the osseointegration between the implant and the human bone when the material is not submitted to a thermal treatment at high temperature. The surface oxide film on titanium formed in the air is so protective that the further oxidation of titanium is prevented in various circum-stances and mediums24. Even during sterilization in autoclave under
a saturated water vapor pressure at 120 °C for 1.8 ks, oxidation of titanium does not proceed24.
Oxidation at high temperatures promotes the development of a crystalline oxide film. Increasing temperature induces the formation of a thicker oxide layer, which is accompanied with dissolution of oxygen beneath it25. Feng et al.19 investigated the oxidation of a
commercially pure titanium at 600 °C for 30 minutes in air, in the oxygen and in the water vapor with 1.13-1.15 Pa. Surface composi-tion and crystal structure analyses carried out by X ray photoelectron spectroscopy (XPS) and by X ray diffraction (XRD), respectively, indicated that titanium was oxidized in every medium, and formed films of rutile TiO2 instead of anatase TiO2. Therefore, the heat-treat-ment converted the passive oxide film on titanium to a rutile film20.
Nevertheless, thermal oxidation at 600 °C and 650 °C for 48 hours at normal atmospheric condition revealed that the oxidized surfaces of the Ti-6Al-4V alloy principally consist of rutile but the anatase form of TiO2 was also detected at limited number of diffraction angles, especially after oxidation at 600 °C25. However, at 650 °C rutile totally
dominated the oxide structure25.
Although some works have reported the structure of the oxide film in many temperatures, none of them have investigated the crystalliza-tion temperature of the passive oxide film and the stability domain of anatase and rutile as a function of temperature. In this paper, a system-atic study has been carried out to evaluate the transition temperatures of each oxide phase formed on commercially pure titanium.
2. Materials and Methods
Samples of commercially cast titanium were gradually polished up to 1 µm alumina, cleaned in ethanol, and dried at room temperature. The chemical composition, measured by X ray fluorescence spec-troscopy (Shimadzu RF-5301), was found to be Ti – 0.078 wt. (%) Fe – 0.065 wt. (%) Mn – 0.026 wt. (%) Zn. Oxidation kinetics of this material were performed by thermogravimetry between 300 and 750 °C for 48 hours in dry air with an accuracy of 10-6 g.
Characteri-zation of the oxide films was made by differential thermal analyses (DTA), X ray diffraction (XRD), and scanning electron microscopy (SEM). Thermogravimetry (TG) and DTA tests were carried out on disks of 5 mm diameter and 2 mm thickness with a Netzsch equipment (Jupiter STA 449C). DTA was performed in dry air between room temperature and 1000 °C at a heating speed of 5 °C/minutes. Samples of 20 mm x 17 mm x 2 mm were oxidized in a furnace, at normal atmospheric conditions, for 48 hours between 200 and 800 °C. After oxidation, a XRD-6000 Shimadzu X ray diffractometer was used to identifier the oxides formed on the titanium. CuKα radiation source was used and the incidence beam scan was 2°/min. Diffraction angle range was between 10° and 80°, with a step increment of 0.02° and a count time of 0.6 seconds.
A hardness test was used to assess Rockwell-C adhesion. This test method uses a standard Rockwell-C hardness tester causing dam-age adjacent to the boundary of the indentation. The damdam-age to the
oxide film was compared with a defined adhesion strength quality26.
HF 1 - HF 4 are defined as good adhesion, while HF 5 – HF 6 are de-fined as poor adhesion. The Rockwell-C adhesion test was developed in Germany and is standardized in the VDI guidelines 3198 (1991) and is expected to become a DIN standard in the near future27. On
each sample three indentations were produced. After indentation, a SEM (Zeiss, 940A) was used to evaluate the Rockwell-C test and the surface morphology of the oxidized specimens. Hardness tests were performed with a Vickers pyramid indenter under 98.1 mN, using a Shimadzu HMV-2T micro hardness tester. Ten measurements were made on each specimen. A digital profilometer (Mitutoyo – surftest 211) was used to examine the surface roughness of the samples. The roughness was determined according to the average roughness (Ra) values, which define the arithmetic mean of departure of a surface profile from a mean line.
3. Results and Discussions
3.1. Oxidation kinetics
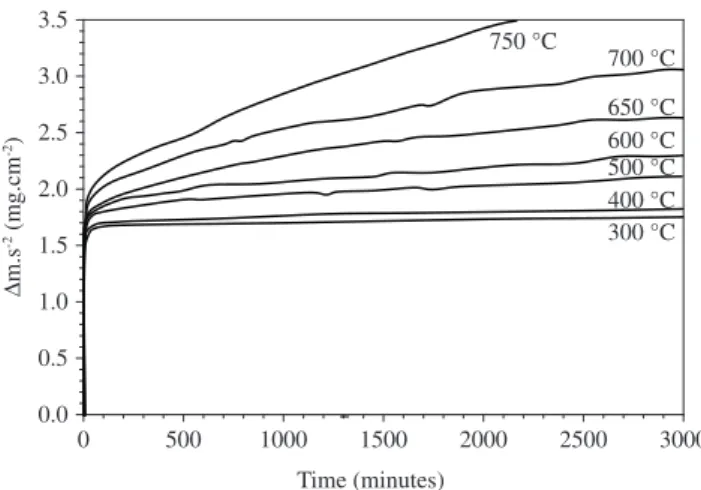
Figure 1 shows that the oxidation kinetics are very fast in the beginning of the oxidation and decrease gradually with time within the firsts 10 and 20 minutes. The steady state is reached after a short time and depends on the oxidation temperature. At lower temperatures (300 and 400 °C) the weight gain per surface unity (∆m.s-2) is very low
and the oxide film oxidized in inverse ratio of the logarithmic law. At 650, 700 and 750 °C the oxidation kinetics are parabolic and at 500 and 600 °C the oxide film grows somehow between a parabolic and an inverse logarithmic law. These oxidation kinetics are very close to a paralinear law. Nevertheless, the weight gain remains relatively low up to 600 °C.
3.2. Differential thermal analyses and X ray diffraction
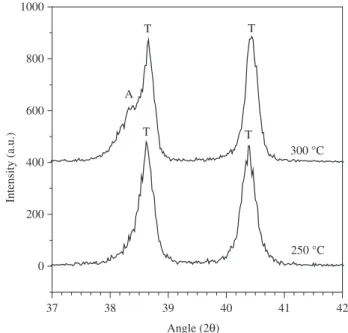
Figure 2 shows the transformations of the oxide film during the heating. The peak at 73.5 °C is due to volatilization of ethanol mol-ecules adsorbed on the surface of the passive film. At 276.1 °C the passive film converted to a crystalline film. The next transformation is observed at about 444-470 °C (peak at 457.2 °C). Evidences from XRD have shown a crystalline film of anatase between these two peaks (Figure 3). The major peak of anatase was found at 2θ = 38.1°. Actually, between 276 and 500 °C there are a double peak composed of anatase (2θ = 38.1°) and titanium (2θ = 38.3°). A systematic investigation between 200 and 300 °C confirmed that the transitionTime (minutes)
0 500 1000 1500 2000 2500 3000
0.0 0.5 1.0 1.5 2.0 2.5 3.0 3.5
400 °C 300 °C 500 °C 600 °C 650 °C 700 °C 750 °C
$
m.s
-2 (mg.cm -2)
Figure 1. Isothermal oxidation kinetics of titanium in dynamic air
temperature between the passive film and the crystalline film of anatase might occur at approximately 275 °C. At this temperature the oxide film is very thin and the peaks observed are from titanium substrate. At 300 °C the anatase peak can be clearly detected by XRD (Figure 4). In this figure it is possible to observe that the peaks of titanium are
not exactly at the same angle because beneath the oxide layer oxygen can dissolves into titanium structure causing an expansion of lattice parameter, and then provoking a shift in the peaks28. At approximately
444 °C (peak at 457 °C) rutile begins to nucleate and then the oxide film is constituted of anatase and rutile sublayers (Figure 2). The peak at 680-730 °C (718 °C) indicates that anatase is no longer stable, converting to rutile, which is the only stable oxide above 718 °C. This results are also back up by XRD, which indicates that the oxide film formed at 500 and 600 °C is constituted of anatase and rutile, and at 750 and 800 °C rutile totally dominated the oxide structure (Figure 3). At 700 °C a slight peak of anatase was identified after 48 of oxidation showing that the reaction needs more time or higher temperatures to complete the transformation. The peak at 900 °C, which starts at about 885 °C, is due to the allotropic transformation of αTi to βTi (Figure 2). Allotropic transformation of pure titanium is reported to be at 882.5 °C as a result of a new atomic structure arrangement, from hexagonal (α phase) at room temperature to cubic (β phase) between 882.5 °C and its melting point at 1670 °C29.
The formation of defective oxide structure after crystallization provides easier diffusion paths for oxygen and/or titanium ions al-lowing oxidation progress with temperature. At 300 and 400 °C the oxide film is very thin and the matter transport is influenced by the electric field formed between the internal (metal/film) and the exter-nal (film/air) interfaces. Therefore, migration of the ionic species is predominant leading to an oxidation kinetic that corresponds to the well known Cabrera and Mott’s model, i.e. the oxide film grows ac-cording to the inverse logarithmic law. At 650 °C diffusion takeovers the migration and the oxidation kinetic is controlled by diffusion of the species through the oxide layer. Therefore, an intermediary mechanism is speculated at 500 and 600 °C, which could explain the oxidation kinetics observed in Figure 1. At these temperatures the oxide film is still somewhat thin and the migration due to the electric field might play an important role along with the diffusion that is improved by the crystallization, which creates easier diffusion paths through the grain boundaries. The large peak at 276.1 °C (Figure 2) also represents the oxidation energy, i.e. at low temperatures (200-400 °C) the reaction is very fast leading to a thicker layer which increases steady and very
0 200 400 600 800 1000
–0.5 0.0 0.5 1.0 900 °C 718 °C 457.2 °C 276.1 °C 73.5 °C Ti (TG) Ti (DTA) DT A ( M V .mg -1) 100 101 102 103 104 105 TG (%) T (°C)
Figure 2. TG and DTA curves of titanium.
30 40 50 60 70 80
0 200 400 400 °C R A A T T T T T T T Angle 2Q 0 200 400 500 °C R
R R AR T
T T T T T T 0 200 400 600 600 °C T T R R R R R R R R R R A A 0 1000 2000 A R 700 °C R R R R R R R R R 0 1000 2000 3000 800 °C R R R R R R R R R R R R Intensity (a.u.)
Figure 3. XRD patterns of titanium surfaces oxidized 48 hours in air (T =
ti-tanium, A = anatase, R = Rutile).
37 38 39 40 41 42
0 200 400 600 800 1000 250 °C 300 °C T T T A T Intensity (a.u.)
Angle (2Q)
Figure 4. XRD patterns showing the crystallization of the passive film of
slowly between 400 °C and 700 °C. From 700 °C the reaction is ac-celerated again as it can be observed in the TG curve (Figure 2). This result shows that the oxide film is very effective against corrosion up to 650 °C. From this temperature, the oxide film growth is stimulated by diffusion as a result of temperature and oxide structure. Nevertheless, the effect of the oxide structure is overlapped by the temperature effect and it is still unclear whether or not the rutile structure is less effective than anatase to prevent matter transport in the scale.
3.3. Adhesion, hardness and roughness tests
Adhesion strength quality was assessed on oxidized surfaces between 300 and 700 °C for 48 hours. Table 1 shows the results ac-cording to the adhesion strength quality (Figure 5). At 300 and 400 °C the oxide film showed typical radial cracks of a ductile layer, which can be related to the adhesion strength quality HF 1. At 500 °C the
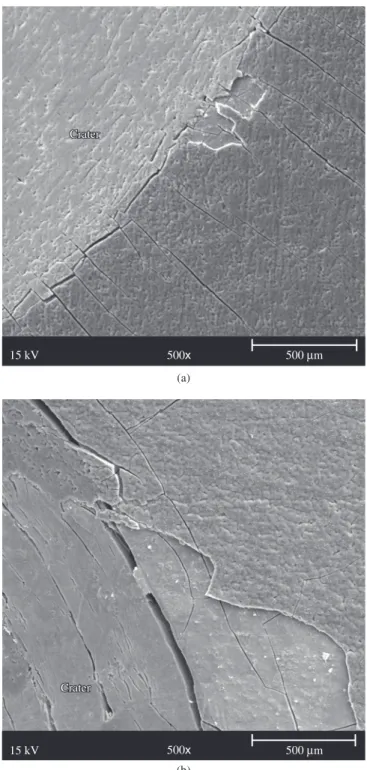
oxide film showed a higher density of radial cracks, but was found to be ductile (HF 2). At 600 °C fine cracks adjacent to the bound-ary of the indentation with small delaminations in the vicinity of the crater were found. This cracking mode represents the adhesion strength quality HF 3 – HF 4, and is also consider a ductile layer. At 650 and 700 °C the oxide film has a brittle behaviour with large delamination areas. At 650 °C the material has a behaviour which lies between HF 4 and HF 5, and at 700 °C the oxide film fails essentially by delamination (HF 6). Figures 6a and 6b show the cracks and the delaminations observed at 600 and 650 °C, respectively. Observations
Table 1. Adhesion strength quality (HF) of titanium oxide films.
Temperature (°C) HF
300 1
400 1
500 2
600 3-4
650 4-5
700 6
HF 1 HF 2
HF 3 HF 4
HF 5 HF 6
Crack network
Delaminations
Figure 5. Adhesion strength quality HF 1 to HF 626.
Crater
500Mm
500x
15 kV
Crater
(a)
500Mm
500x
15 kV
Crater Crater
(b)
Figure 6. Damages adjacent to the craters produced by Rockwell-C
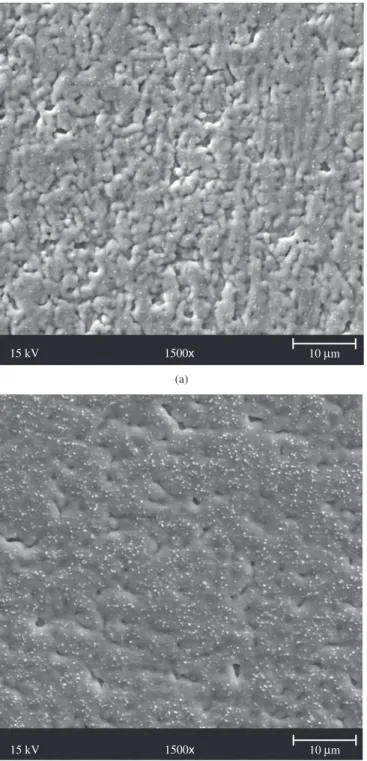
on top of the oxide films, far from Rockwell indentations, showed that the surfaces are crack-free and uniformly roughness (Figure 7). On these areas the hardness of the oxide films formed at 600/650 °C and at 700 °C is approximately the same (9500 MPa), but the failure modes are different. From 650 °C the oxidation rate is accelerated due to intrinsic and thermal effects putting the whole oxide layer in a more stressed conditions, resulting in oxide failure by delamination. This behaviour indicates that the oxide film has a poor adhesion, contrary to the samples oxidized up to 600 °C, on which the oxide film has a good adhesion.
The roughness of the oxidized surfaces at 600 and 650 °C for 48 hours was 0.90 and 1.30 µm, respectively. Average roughness of untreated sample was 0.08 µm before oxidation. The roughness ob-tained at 600 and 650 °C after 48 hours of oxidation are considered appropriate for implanted materials. A major risk with high surface roughness may be an increase in peri-implantitis as well as an increase in ionic leakage30. A moderate roughness of 1-2 µm may limit these
two parameters31. Therefore, the assessed results in this work showed
that a good compromise between adhesion of the oxide film and os-seointegration probably occurs at 600 °C. Adhesion of osteoblasts and scratching tests using a pyramidal Berkovich diamond indenter are in progress in order to evaluate more precisely the biological and mechanical performance of titanium oxide films.
4. Conclusion
Commercially pure titanium was thermally characterized up to 1000 °C. Oxidation reaction is very fast in the early stages of the oxidation process leading to the formation of oxide layers composed of anatase and rutile structures of TiO2. After the initial period, the oxi-dation kinetics are very slow up to 600 °C due to the excellent thermal behavior of the scale. Crystallization of the passive film into anatase occurs at 276 °C. Rutile starts growing from about 444 °C (peak at 457 °C) and is the only stable oxide above 718 °C. Between 457 and 718 °C the oxide film is composed of anatase and rutile sublayers. SEM analysis have shown that the oxide film formed on titanium is crack-free and uniformly roughness. The Rockwell-C adhesion test showed that the oxide film has a good adhesion on the samples oxidized up to 600 °C. These results indicate that titanium oxidized at approximately 600 °C may achieve a good biological performance, since the surface roughness at this temperature is moderate and can improve osseointegration by biomechanical fixation.
References
1. Sul YT. The significance of the surface properties of oxidized titanium to the bone response: special emphasis on potential biochemical bonding of oxidized titanium implant. Biomaterials. 2003; 24:3893-3907. 2. Hench LL, Wilson J. Introduction to bioceramics. Singapore: Word
Scientific Publishing Co. Pte Ltd.; 1993. p. 1-15.
3. Okazaki Y, Gotoh E. Comparison of metal release from various metallic biomaterials in vivo. Biomaterials. 2005; 26:11-21.
4. Sul YT, Johansson CB, Jeong Y, Röser K, Wennenberg A, Albrektsson T. Oxidized implants and their influence on the bone response. J. Mater. Sci. Mater. Med. 2001; 12:1025-1031.
5. Thomsen P, Larsson C, Ericson LE, Sennerby L, Lausma J, Kasemo B. Structure of the interface between rabbit cortical bone and implants of gold, zirconium and titanium. J. Mater. Sci. Mater. Med. 1997; 8:653-665. 6. Li D, Ferguson SJ, Beutler T, Cochran DL, Sitting C, Hirt HP, Buser D.
Biomechanical comparison of the sandblasted and acid-etched and the machined and acid-etched titanium surface for dental implants. J. Biomed. Mater. Res. 2002; 60:325-332.
7. Wennerberg A. The importance of surface roughness for implants incor-poration. Int. J. Mach. Tools Manuf. 1998; 38:657-662.
8. Cochran DL, Schenk RK, Lussi A, Higginbottom FL, Buser D. Bone response to unloaded and loaded titanium implants with a sandblasted and acid-etched surface: a histometric study in the canine mandible. J. Biomed. Mater. Res. 1998; 40:1-11.
9. Wennerberg A, Hallgren C, Johansson C, Danelli SA. Histomorphometric evaluation of screw-shaped implants each prepared with two surface roughnesses. Clin. Oral Implants Res. 1998; 9:11-19.
10. Buser D, Schenk R, Steinemann S, Fiorellini J, Fox C, Stich H. Influence of surface characteristics on bone integration of titanium implants. J. Biomed. Mater. Res. 1991; 25:889-902.
Figure 7. SEM micrographs of surface appearances of oxidized samples for
48 hours in air at a) 600 °C; and b) 650 °C.
10Mm
x
15 kV
(b)
10Mm
x
15 kV
11. Gotfredsen K, Wennerberg A, Johansson C, Skovgaard LT, Hjorting-Hansen E. Anchorage of TiO2-blasted, HA-coated, and machined
im-plants: an experimental study with rabbits. J. Biomed. Mater. Res. 1995; 29:1223-1231.
12. Wennerberg A, Albrektsson T, Albrektsson B, Krol JJ. Histomorphometric and removal torque study of screw-shaped titanium implants with three different surface topographies. Clin. Oral Implants Res. 1996; 6:24-30.
13. Li LH, Kong YM, Kim HW, Kim YW, Kim HE, Heo SJ, Koak JY. Im-proved biological performance of Ti implants due to surface modification by micro-arc oxidation. Biomaterials. 2004; 25:2867-2875.
14. Sul YT, Johansson C, Wennerberg A, Cho LR, Chang BS, Albrektsson T. Optimum surface properties of oxidized implants for reinforcement of osseointegration: surface chemistry, oxide thickness, porosity, rough-ness, and crystal structure. Int. J. Oral Maxillofac. Implants. 2005; 20:349-359.
15. Xiropaidis AV, Qahash M, Lim WH, Shanaman RH, Rohrer MD. Bone-implant contact at calcium phosphate-coated and porous titanium oxide (TiUnite)-modified oral implants. Clin. Oral Implants Res. 2005; 16:532-539.
16. Huang YH, Xiropaidis AV, Sorensen RG, Albandar JM, Hall J, Wikesjo UM. Bone formation at titanium porous oxide (TiUnite) oral implants in type IV bone. Clin. Oral Implants Res. 2005; 16:105-111.
17. Sul YT, Johansson CB, Jeong Y, Wennerberg A, Albrektsson T. Resonance frequency and removal torque analysis of implants with turned and ano-dized surface oxides. Clin. Oral Implants Res. 2002; 13:252-259. 18. Rocci A, Martignoni M, Gotllow J. Immediate loading of Branemark
System TiUnite and machined-surface implants in the posterior mandible: a randomized open-ended clinical trial. Clin. Implant Dent. Relat. Res.
2003; 5:557-563.
19. Feng B, Chen JY, Qi SK, He L, Zhao JZ, Zhang XD. Characterization of surface oxide films on titanium and bioactivity. J. Mater. Sci. Mater. Med. 2002; 13:457-464.
20. Advincula MC, Rahemtulla FG, Advincula RC, Asda ET, Lemons JE, Bellis SL. Osteoblast adhesion and matrix mineralization on sol–gel-derived titanium oxide. Biomaterials. 2006; 27. p. 2201-2207.
21. Feng B, Weng j, Yang BC, Chen JY, Zhao JZ, He L, Qi SK, Zhang XD. Surface characterization of titanium and adsoption of bovine serum albumin. Materials Characterization. 2003; 49:129-137.
22. Cheng X, Roscae SG. Corrosion behavior of titanium in the pres-ence of calcium phosphate and serum proteins. Biomaterials. 2005; 26:7350-7356.
23. Pouilleau J, Devilliers D, Garrido F, Durand-vidal S, Mahe E. Structure and composition of passive titanium oxide films. Mater. Sci. Eng. 1997; B47:235-243.
24. Hiromoto S, Hanawa T, Asami K. Composition of surface oxide film of titanium with culturing murine fibroblasts L929. Biomaterials. 2004; 25:979-986.
25. Güleryüz H, Cimenoðlu H. Effect of thermal oxidation on corrosion and corrosion-wear behaviour of a Ti-6Al-4V alloy. Biomaterials. 2004; 25:3325-3333.
26. Heinke, W, Leyland A, Matthews A, Berg G, Friedrich C, Broszeit E. Evaluation of PVD nitride coatings, using impact, scratch and Rockwell-C adhesion tests. Thin Solid Films. 1995; 270:431-438.
27. Jehn H, Reiners G, Siegel N, Editors. DIN Fachbericht 39. Characteris-ierung dünner Schichten. Beuth Verlag: Berlin, 1993.
28. Wang X-X, Yan W, Hayakawa S, Tsuru K, Osaka A. Apatite deposition on thermally and anodically oxidized titanium surfaces in a simulated body fluid. Biomaterials. 2003; 24:4631-4637.
29. Rocha Mello GM, Aleixo GT, Chaves RR, Caram R. Estabilidade e meta-estabilidade em ligas de titânio e sua relação com teores de Nb, Ta e Zr. Proceedings of the XVI Brazilian conference in Materials Science and Engineering. Porto Alegre/RS, CDROM, Brazil; 2004.
30. Becker W, Becker BE, Ricci A, Bahat O, Rosenberg E, Rose LF. A pro-spective multicenter clinical trial comparing one –and two-stage titanium screw-shaped fixtures with one stage plasma sprayed solid-screw fixtures.
Clin. Implant Dent. Relat. Res. 2000; 2:159-165.