NPGD
1, 51–96, 2014Physics-guided data mining techniques
A. R. Ganguly et al.
Title Page
Abstract Introduction
Conclusions References
Tables Figures
◭ ◮
◭ ◮
Back Close
Full Screen / Esc
Printer-friendly Version Interactive Discussion
Discussion
P
a
per
|
D
iscussion
P
a
per
|
Discussion
P
a
per
|
Discuss
ion
P
a
per
|
Nonlin. Processes Geophys. Discuss., 1, 51–96, 2014 www.nonlin-processes-geophys-discuss.net/1/51/2014/ doi:10.5194/npgd-1-51-2014
© Author(s) 2014. CC Attribution 3.0 License.
Open Access
Nonlinear Processes in Geophysics
Discussions
This discussion paper is/has been under review for the journal Nonlinear Processes in Geophysics (NPG). Please refer to the corresponding final paper in NPG if available.
Toward enhanced understanding and
projections of climate extremes using
physics-guided data mining techniques
A. R. Ganguly1,*, E. A. Kodra1,*, A. Banerjee2, S. Boriah2, S. Chatterjee3,
S. Chatterjee2, A. Choudhary4, D. Das1, J. Faghmous2, P. Ganguli1, S. Ghosh5, K. Hayhoe6, C. Hays7, W. Hendrix4, Q. Fu2, J. Kawale2, D. Kumar1, V. Kumar2, S. Liess8, R. Mawalagedara1, V. Mithal2, R. Oglesby7, K. Salvi5, P. K. Snyder8, K. Steinhaeuser2, D. Wang1, and D. Wuebbles9
1
Sustainability and Data Sciences Laboratory, Department of Civil and Environmental Engineering, Northeastern University, Boston, MA, USA
2
Department of Computer Science and Engineering, University of Minnesota, Twin Cities, MN, USA
3
School of Statistics, University of Minnesota, Twin Cities, MN, USA 4
Department of Electrical and Computer Engineering, Northwestern University, Evanston, IL, USA
5
Department of Civil Engineering, Indian Institute of Technology Bombay, Mumbai, Maharashtra, India
6
Texas Tech University, Lubbock, TX, USA 7
NPGD
1, 51–96, 2014Physics-guided data mining techniques
A. R. Ganguly et al.
Title Page
Abstract Introduction
Conclusions References
Tables Figures
◭ ◮
◭ ◮
Back Close
Full Screen / Esc
Printer-friendly Version Interactive Discussion
Discussion
P
a
per
|
D
iscussion
P
a
per
|
Discussion
P
a
per
|
Discuss
ion
P
a
per
|
8
Department of Soil, Water, and Climate, University of Minnesota, Twin Cities, MN, USA 9
Department of Atmospheric Sciences, University of Illinois, Urbana-Champaign, IL, USA *
These authors contributed equally to this work.
Received: 28 January 2014 – Accepted: 2 February 2014 – Published: 14 February 2014
Correspondence to: A. R. Ganguly ([email protected])
NPGD
1, 51–96, 2014Physics-guided data mining techniques
A. R. Ganguly et al.
Title Page
Abstract Introduction
Conclusions References
Tables Figures
◭ ◮
◭ ◮
Back Close
Full Screen / Esc
Printer-friendly Version Interactive Discussion
Discussion
P
a
per
|
D
iscussion
P
a
per
|
Discussion
P
a
per
|
Discuss
ion
P
a
per
|
Abstract
Extreme events such as heat waves, cold spells, floods, droughts, tropical cyclones, and tornadoes have potentially devastating impacts on natural and engineered sys-tems, and human communities, worldwide. Stakeholder decisions about critical infras-tructures, natural resources, emergency preparedness and humanitarian aid typically
5
need to be made at local to regional scales over seasonal to decadal planning horizons. However, credible climate change attribution and reliable projections at more localized and shorter time scales remain grand challenges. Long-standing gaps include inade-quate understanding of processes such as cloud physics and ocean-land-atmosphere interactions, limitations of physics-based computer models, and the importance of
in-10
trinsic climate system variability at decadal horizons. Meanwhile, the growing size and complexity of climate data from model simulations and remote sensors increases op-portunities to address these scientific gaps. This perspectives article explores the pos-sibility that physically cognizant mining of massive climate data may lead to signifi-cant advances in generating credible predictive insights about climate extremes and
15
in turn translating them to actionable metrics and information for adaptation and pol-icy. Specifically, we propose that data mining techniques geared towards extremes can help tackle the grand challenges in the development of interpretable climate projec-tions, predictability, and uncertainty assessments. To be successful, scalable methods will need to handle what has been called “Big Data” to tease out elusive but robust
20
statistics of extremes and change from what is ultimately small data. Physically-based relationships (where available) and conceptual understanding (where appropriate) are needed to guide methods development and interpretation of results. Such approaches may be especially relevant in situations where computer models may not be able to fully encapsulate current process understanding, yet the wealth of data may offer additional
25
NPGD
1, 51–96, 2014Physics-guided data mining techniques
A. R. Ganguly et al.
Title Page
Abstract Introduction
Conclusions References
Tables Figures
◭ ◮
◭ ◮
Back Close
Full Screen / Esc
Printer-friendly Version Interactive Discussion
Discussion
P
a
per
|
D
iscussion
P
a
per
|
Discussion
P
a
per
|
Discuss
ion
P
a
per
|
1 Introduction
Observed and projected changes in the frequency and severity of heat waves and heavy precipitation events have been explicitly linked to human-induced climate change by the recent literature, as summarized in the IPCC Special Report on Managing the Risk of Extreme Events and Disasters to Advance Climate Change Adaptation, also
5
known as the IPCC-SREX (Field et al., 2012) and in a perspective article in Nature Climate Change (Coumou and Rahmstorf, 2012). However, the impact of the changing climate on other types of extremes such as severe weather and hydrological events, including floods, droughts, storms, hurricanes, cyclones, and tornadoes, remains un-clear. Mitigation policy requires quantifying the benefits of reducing emissions in terms
10
of impacts avoided. Adaptation to natural hazards and constrained natural resources requires credible projections of extremes, along with their uncertainties, at local to re-gional scales. Delineating possible links between changes in weather extremes with changes in climate or land use are therefore directly relevant to both mitigation and adaptation planning.
15
High-resolution global climate models, in conjunction with downscaling based on sta-tistical approaches or regional climate models, may bridge the gap. Unfortunately, the recent literature and our analyses suggest that physics-based modeling alone may not be able to keep pace with the urgency of stakeholder requirements. Each generation of climate models brings new advances, such as the recent expansion of more
tra-20
ditional atmosphere-ocean general circulation models into fully coupled earth system modelling systems in the Coupled Model Intercomparison Project version 5 (CMIP; Taylor et al., 2012). Coupling new models brings its own issues, however, and eval-uation studies suggest that, despite noticeable improvements, regional-scale biases persist in the latest generation of climate models, despite enhanced resolutions and
25
NPGD
1, 51–96, 2014Physics-guided data mining techniques
A. R. Ganguly et al.
Title Page
Abstract Introduction
Conclusions References
Tables Figures
◭ ◮
◭ ◮
Back Close
Full Screen / Esc
Printer-friendly Version Interactive Discussion
Discussion
P
a
per
|
D
iscussion
P
a
per
|
Discussion
P
a
per
|
Discuss
ion
P
a
per
|
Climate extremes continue to represent a major challenge. Consider the example of droughts: according to the IPCC-AR5 (IPCC, 2013) report on the “physical science basis” of climate change, scientific confidence in the ability to characterize and project droughts may have reduced over the last several years (see also Table SPM.1 in the IPCC-AR5 summary for policymakers). Two recent papers on droughts, one published
5
in Nature Climate Change (Dai, 2012) and another in Nature (Sheffield et al., 2012), offered diametrically opposite insights. While Dai (2012) concluded that droughts glob-ally have shown an increasing trend in the past and will worsen in the future; Sheffield et al. (2012) found a lack of trends in global drought over the past 60 yr. The differing insights are summarized by Trenberth et al. (2014) in a perspectives article in Nature
10
Climate Change.
Climate-related data are rapidly increasing in size and complexity (Overpeck et al., 2011; Taylor et al., 2012). This begs the question whether data science, which has al-ready transformed disparate data-rich fields from biological sciences to social media to information retrieval, may also offer fresh insights to address fundamental
knowledge-15
gaps related to climate extremes. Going back to the droughts example, Trenberth et al. (2014) suggest that the reasons for the diverging insights were the different choices of underlying data and metrics.
While confidence in scientific understanding and attribution of observed trends to human-induced climate change continues to increase, the IPCC-SREX highlights key
20
gaps in present scientific understanding of climate extremes. Previous and current research on climate extremes typically focuses on one of three areas: the physical science basis, statistics of extremes, or adaptation and potential impacts. Physical science-based analyses tend to emphasize mechanistic understanding and attribution; statistical analyses generally develop data-driven techniques for descriptive and
pre-25
NPGD
1, 51–96, 2014Physics-guided data mining techniques
A. R. Ganguly et al.
Title Page
Abstract Introduction
Conclusions References
Tables Figures
◭ ◮
◭ ◮
Back Close
Full Screen / Esc
Printer-friendly Version Interactive Discussion
Discussion
P
a
per
|
D
iscussion
P
a
per
|
Discussion
P
a
per
|
Discuss
ion
P
a
per
|
change, and climate extremes is still insufficient to facilitate confident and risk-informed decision-making, particularly at regional and decadal scales.
Reliable projections need to generate interpretable predictive insights while account-ing for the knowledge-gaps and intrinsic system variability. The wealth of data contin-ues to increase, as does our conceptual understanding of processes that may
gen-5
erate extremes, such as the influence of oceans and climate oscillators, and local or regional terrestrial drivers. The lack of significant improvement in the latest genera-tion of computer models may suggest that the enhanced understanding may not yet translate to improved projections. Data-driven methods by themselves may not be ad-equate for long-lead time projections of a nonlinear dynamical system such as climate.
10
Data assimilation methods have limited ability to contribute in the future when pro-jection lead times are large. However, dependence characterization and data-driven predictive modeling may be conditioned on the results of physics-based models, and further based on physical or process understanding, that in turn may be difficult to cap-ture within the current set of model parameterizations. In such cases, pure data-driven
15
methods may lead to spurious correlations or predictions, but physical constraints in the design and interpretation of such methods may guard against the possibility. Thus, ocean or atmospheric temperatures from climate models may generate better charac-terizations and projections of precipitation extremes statistics with uncertainties (e.g., Kao and Ganguly, 2011; Steinhaeuser et al., 2012).
20
2 The climate science question: interdisciplinary perspectives
This article focuses on what may be viewed as three inter-related grand challenges in climate change studies: (1) characterization of climate extremes, (2) comprehensive assessment of uncertainties, and (3) enhanced predictive understanding, with a goal of improving projections. Climate and earth sciences have grown from data–poor to
25
NPGD
1, 51–96, 2014Physics-guided data mining techniques
A. R. Ganguly et al.
Title Page
Abstract Introduction
Conclusions References
Tables Figures
◭ ◮
◭ ◮
Back Close
Full Screen / Esc
Printer-friendly Version Interactive Discussion
Discussion
P
a
per
|
D
iscussion
P
a
per
|
Discussion
P
a
per
|
Discuss
ion
P
a
per
|
Can the rapid and recent increases in computational power and analysis capabilities, as well as steady progress on foundational theories in statistics, nonlinear physics, in-formation theory, signal processing, computer science, and econometrics, enable fun-damental advances in climate science through computational data sciences? Can the data science methods be carefully designed to avoid spurious generalizations, and to
5
extract physically-based patterns that can be interpreted by climate scientists?
Solutions for massive data volume and complexity have already made their mark in scientific and engineering disciplines as diverse as biology, astrophysics, and Inter-net phenomena such as Google or Facebook (Berriman et al., 2010; Langmead et al., 2010; Yang et al., 2011) and spawned new fields of research such as sensor networks
10
(Ganguly et al., 2009a). Climate problems increasingly demand data-driven solutions, but the relevant approaches need to consider relatively unique challenges not present, or not as predominant, in fields where data sciences have proved enormously suc-cessful thus far. Thus, carefully-designed parallel and distributed algorithms may be required to ensure that sophisticated methods designed for nonlinear processes and
15
complex long-memory or long-range associations can scale and remain resilient to spurious “discoveries”.
3 Big data challenges in climate science
Over the last few decades, climate data has expanded rapidly in both size and complex-ity. While weather station records remain small and relatively manageable, the advent
20
of the satellite era and remote sensors in general, and the evolution of high-resolution weather and climate models, both of which divide the planet up into ever-decreasing grid-sizes, are the primary factors driving data increases. Ensembles of archived cli-mate model outputs have grown from a few hundred terabytes after the last IPCC as-sessment cycle (AR4) to the petabyte scale (AR5). The global archive of climate data
25
NPGD
1, 51–96, 2014Physics-guided data mining techniques
A. R. Ganguly et al.
Title Page
Abstract Introduction
Conclusions References
Tables Figures
◭ ◮
◭ ◮
Back Close
Full Screen / Esc
Printer-friendly Version Interactive Discussion
Discussion
P
a
per
|
D
iscussion
P
a
per
|
Discussion
P
a
per
|
Discuss
ion
P
a
per
|
but also from in-situ observations (Overpeck et al., 2011; Taylor et al., 2012). The pace of data growth appears to suggest that even these projections may represent lower bounds.
Disk space and processing speeds are perennial challenges. Today, however, the major technical barriers for mining massive data lie in scalable data–intensive analysis
5
capabilities, where fast storage and scalable input/output are major concerns (Schadt et al., 2010; Trelles et al., 2011), along with mathematical and algorithmic capabilities. Data–driven methods are not new in climate, meteorology or geophysics; the novelty is in the scalability challenges for massive data as well as the opportunities to infer novel process understanding and new predictive insights.
10
Recent developments in data science have sometimes focused almost exclusively on scalability to massive data rather than data complexity (Armbrust et al., 2010; Dean and Ghemawat, 2008). New methods need to consider several crucial aspects that are rather unique to climate science and related disciplines: climate data exhibit complex space-time dependence; the data-generation processes are highly nonlinear and may
15
be extremely sensitive to initial conditions; variability may occur over long time frames and thus may be difficult to evaluate with limited historical data; spatial dependencies may be based on proximity as well as long range teleconnections with time lags or leads, which makes the discovery of associations a combinatorial challenge; and ex-tremes, unusual patterns or anomalies are of interest, particularly at higher resolutions.
20
The dominance of nonlinear and non-stationary processes, combined with the need for projections (e.g., for extreme values) over long-lead time precludes data-driven projec-tions alone.
Predictability studies (e.g., Karamperidou et al., 2014) leading to characterization of irreducible uncertainties is a major challenge in climate science that may be relatively
25
NPGD
1, 51–96, 2014Physics-guided data mining techniques
A. R. Ganguly et al.
Title Page
Abstract Introduction
Conclusions References
Tables Figures
◭ ◮
◭ ◮
Back Close
Full Screen / Esc
Printer-friendly Version Interactive Discussion
Discussion
P
a
per
|
D
iscussion
P
a
per
|
Discussion
P
a
per
|
Discuss
ion
P
a
per
|
studied predictability of precipitation in the context of climate variability. Branstator and Teng (2010) and Branstator et al. (2012) studied decadal-scale predictability from an ensemble of multiple initial condition runs using relative entropy. Giannakis and Majda et al. (2012) have used data driven methods for dynamical systems (with applications in climate atmosphere ocean science) to quantify predictability and extract
spatiotem-5
poral patterns. The approaches are relatively new to climate but have tremendous im-plications for stakeholders and decision makers. The imim-plications of adapting these methods to Big Data have not been studied in detail.
Big Data has its own unique problems. A major challenge related to working with large datasets is avoiding false positives, especially when looking for patterns in the
10
data that are rare. The problem arises from the fact that when a large amount of data is considered, the probability of encountering random occurrence of the target pattern in the data is also high. From the view-point of statistical tests, the p value has little relevance for a sample size big enough to be called really Big Data. Thus, virtually any hypothesis will be accepted if the sample size is large enough, since thep value
15
of the null hypothesis will always be almost zero. Bonferroni correction, a theorem of statistics that gives a statistically naive way to avoid these false positive responses to a search through the data, has been used widely in the past with large datasets. However, avoiding false discoveries is still an active research area and several new methods have been proposed in last two decades (Benjamini and Hochberg, 1995;
20
Bogdan et al., 2008; Dudoit et al., 2003; Efron, 2007) that improve upon the Bonferroni theorem both by new methodological and theoretical developments. Another problem with big data arises if one tries to identify the distribution a variable follows based solely onp values. The goodness-of-fit tests become extremely sensitive to small, inconse-quential changes when the sample size is large. The issue of false positives with Big
25
NPGD
1, 51–96, 2014Physics-guided data mining techniques
A. R. Ganguly et al.
Title Page
Abstract Introduction
Conclusions References
Tables Figures
◭ ◮
◭ ◮
Back Close
Full Screen / Esc
Printer-friendly Version Interactive Discussion
Discussion
P
a
per
|
D
iscussion
P
a
per
|
Discussion
P
a
per
|
Discuss
ion
P
a
per
|
(Kleiner et al., 2012) and other alternatives require further study, in order to understand how to use resampling for extremes of climate variables from large datasets.
Due to this ever-present risk of coming up with spurious discoveries and insights with Big Data, the importance of physics-guided data mining needs to be emphasized further. We can either use physical constraints to validate the data-driven knowledge
5
discoveries or incorporate the physical constraints in the knowledge discovery process by mapping them either as statistical constraints or in the selection of variables and distributions.
4 Societal urgency and state of the science
The types of extreme events discussed here have the potential to cause significant
dev-10
astation; as shown in Fig. 1, the largest number of deaths results from droughts, tropical cyclones and floods, and the most significant economic loss from hurricanes/cyclones and floods. Mortality and economic losses from tornadoes and severe thunderstorms has been of significant concern in the United States, given the devastating losses in 2011 (Simmons et al., 2012). The size depicting each type of hazard provides a
mea-15
sure of our uncertainty under climate change; unfortunately, we find that the level of uncertainty is generally high for the most destructive hazards (Bouwer, 2011). Even for the relatively better understood temperature extremes, such as heat waves and cold snaps, large uncertainties remain, especially at regional scales (Ganguly et al., 2009b). Hazards are expected to be more severe for poorer and more vulnerable regions;
de-20
veloped economies, however, are not immune to loss either, as demonstrated by Paris and Chicago heatwave mortality (Hayhoe et al., 2010) and United States Gulf Coast hurricane impacts (Burby, 2006). Recent studies have advanced our understanding of observed trends in heavy precipitation or flooding and attributions to global warm-ing (Min et al., 2011; Pall et al., 2011). However, uncertainties remain in interpretwarm-ing
25
NPGD
1, 51–96, 2014Physics-guided data mining techniques
A. R. Ganguly et al.
Title Page
Abstract Introduction
Conclusions References
Tables Figures
◭ ◮
◭ ◮
Back Close
Full Screen / Esc
Printer-friendly Version Interactive Discussion
Discussion
P
a
per
|
D
iscussion
P
a
per
|
Discussion
P
a
per
|
Discuss
ion
P
a
per
|
2011; Kharin et al., 2007) that are crucial for water and flood management. Floods in particular are less well understood owing to cascading uncertainty from projections of heavy rainfall to consequences for surface hydrology and impacts on water manage-ment (Schneider and Kuntz-Duriseti, 2002). Nevertheless, generating credible projec-tions of climate variables at regional or even local scales remains an important step for
5
reliable assessments of hazards and their consequences.
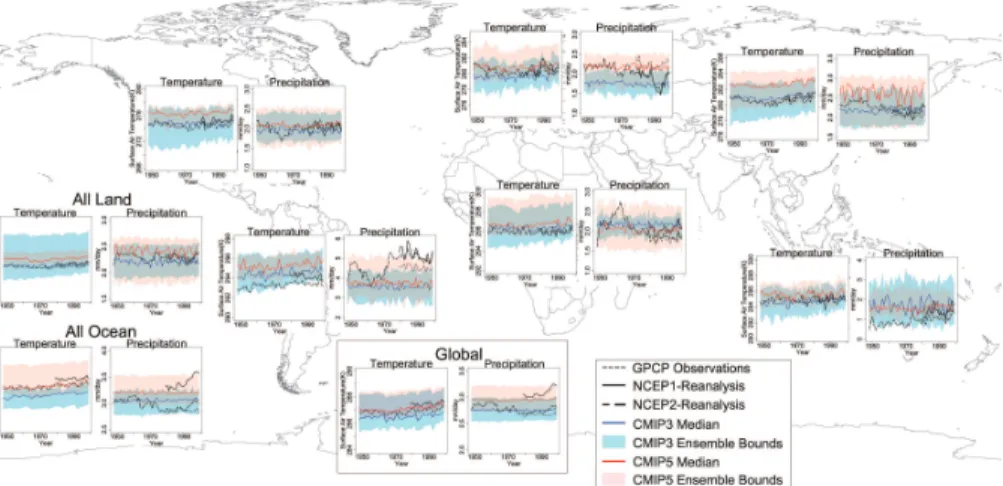
Can improvements in physics and higher-resolution models, increase otherwise in-adequate precision and enhance the accuracy, of projections for climate-related ex-tremes? Projections from global models tend to grow more uncertain with increased spatial and temporal resolution, especially for precipitation, particularly so over the
10
tropics (Kao and Ganguly, 2011). The possibility that the current-generation and higher resolution CMIP5 models will improve projections compared to the previous-generation phase 3 (CMIP3) models remains to be tested at appropriate scales.
While comparing the performance of GCMs (or the newer generation of earth sys-tem models), it is important to carefully distinguish between model evaluation versus
15
translating model outputs into information relevant for impacts, adaptation, and vulner-ability (IAV) studies. GCMs are designed to model large-scale atmospheric dynamics, and from that perspective, recent results suggest general improvement of the ensem-ble of CMIP5 models compared to CMIP3 (e.g. Ryu and Hayhoe, 2013). However, any improvement in the internal physics or dynamical behavior of models may not be
20
immediately manifested in, for example, model ability to reproduce absolute values of temperature or precipitation at regional and seasonal scales, or in their extremes. Nonetheless, IAV studies may occasionally rely on GCM simulations of temperature and precipitation for future assessments, either directly or indirectly after statistical or dynamical downscaling. One of the primary functions of downscaling, particularly
sta-25
NPGD
1, 51–96, 2014Physics-guided data mining techniques
A. R. Ganguly et al.
Title Page
Abstract Introduction
Conclusions References
Tables Figures
◭ ◮
◭ ◮
Back Close
Full Screen / Esc
Printer-friendly Version Interactive Discussion
Discussion
P
a
per
|
D
iscussion
P
a
per
|
Discussion
P
a
per
|
Discuss
ion
P
a
per
|
Global Precipitation Climatology Project (GPCP) precipitation. Based on a straightfor-ward comparison, no improvements are apparent either in terms of the multimodel median projections or in terms of the uncertainty bounds. In fact, CMIP5 almost con-sistently predicts higher temperatures and precipitation compared to the CMIP3 multi-model median, but these higher values do not necessarily agree better with the
ob-5
servations. These preliminary results (further details in Kumar et al., 2014) may ap-pear to provide further support to arguments (Hulme et al., 2009) that model improve-ments alone may not provide immediate answers to stakeholder questions or adapta-tion needs and addiadapta-tional analyses are clearly required in order to extract informaadapta-tion from GCM simulations directly relevant to and able to be used by IAV assessments.
10
This is precisely where Big Data solutions (and in the case of extremes, Big Data solutions that are ultimately geared towards rare events and small data, or elusive in-dicators thereof) may provide value. Improvements in internal physics and large-scale dynamics of GCMs may not directly improve the variables of most immediate interest to IAV studies. However, data-driven methods may still be able to leverage the
improve-15
ments in the larger-scale or internal model variables and yield improved projections for the variables of interest to IAV. For the data-driven projections to be interpretable and useful, they need to be guided by physical understanding, where physics may not be directly captured by GCMs, perhaps even after downscaling.
5 Characterization of climate extremes
20
Climate extremes often refer to well-defined weather or climate events that are quan-tified using measurable physical quantities such as temperature, precipitation, or wind speed and that are rare (i.e., occurring at the tails of the distribution) relative to cur-rent climate states (Zwiers et al., 2013). The definition of climate extremes, in general, varies with the nature of the phenomena and may be based on their impacts. Extremes
25
NPGD
1, 51–96, 2014Physics-guided data mining techniques
A. R. Ganguly et al.
Title Page
Abstract Introduction
Conclusions References
Tables Figures
◭ ◮
◭ ◮
Back Close
Full Screen / Esc
Printer-friendly Version Interactive Discussion
Discussion
P
a
per
|
D
iscussion
P
a
per
|
Discussion
P
a
per
|
Discuss
ion
P
a
per
|
have longer-lasting impacts. While phenomena like heat waves under climate change are better understood than most other climate-related extremes (Coumou and Rahm-storf, 2012; Field et al., 2012), their very definitions may depend on the impact sector of interest (Ebi and Meehl, 2007). Figure 2 (top) shows that different definitions of heat waves can significantly impact the final insights; however each definition remains
use-5
ful for its specific context, such as energy demand (Christenson et al., 2006) or public health (Kovats and Kristie, 2006).
As model-simulated and observational databases, and the importance of inform-ing adaptation or mitigation policy, continue to grow, descriptive analysis of multiple definitions of model-projected and observed extremes will at once become a larger
10
and more complex task. Surprising insights about cold temperature extremes (Kaspi and Schneider, 2011; Kodra et al., 2011) are still being discovered from observed and model-simulated data. Thus, while decreasing frequency of cold extremes has been re-ported (Coumou and Rahmstorf, 2012), there is still a need for better characterization and improved mechanistic understanding of their potential persistence in a warming
15
world.
Recent advances in attribution of heavy rainfall do not directly translate to improved information for adaptation (Min et al., 2011; Pall et al., 2011). Thus, intensification of precipitation extremes under warming, which is partially explained through our concep-tual process understanding (O’Gorman and Schneider, 2009; Sugiyama et al., 2010),
20
is projected relatively credibly in the extra-tropics and at continental to global average scales (Kao and Ganguly, 2011; Kharin et al., 2007). However, large uncertainties re-main in estimating the precise degree of change and for specific regions such as the tropics (Kharin et al., 2007), where diverging insights (Ghosh et al., 2011; Goswami et al., 2006) have been recently reported owing to differing characterizations of
ex-25
NPGD
1, 51–96, 2014Physics-guided data mining techniques
A. R. Ganguly et al.
Title Page
Abstract Introduction
Conclusions References
Tables Figures
◭ ◮
◭ ◮
Back Close
Full Screen / Esc
Printer-friendly Version Interactive Discussion
Discussion
P
a
per
|
D
iscussion
P
a
per
|
Discussion
P
a
per
|
Discuss
ion
P
a
per
|
(Zhang and Singh, 2007) for floods and severity, duration, intensity and spatial extent for droughts (Reddy and Ganguli, 2013; Song and Singh, 2010).
Univariate frequency analyses cannot provide accurate assessment of the proba-bility of occurrence of extremes if the underlying event is characterized by mutually correlated random variables and may lead to over or under estimation of associated
5
risk (Chebana and Ouarda, 2011). Hence, multivariate statistical approaches are often necessary in order to completely assess risk of hydrological extremes. Further de-velopments in the statistical theories related to multivariate extremes are needed for advancing our ability to quantify the complex dependencies of climate extremes more completely, and with greater certainty (Kuhn et al., 2007; Marty and Blanchet, 2011;
10
Mastrandrea et al., 2011; Turkman et al., 2009; Wadsworth and Tawn, 2012). Descrip-tions of rainfall extremes, whether based on EVT or fixed/dynamic thresholds, need to characterize changing statistics of storm events (Kao and Ganguly, 2011), droughts (van Huijgevoort et al., 2012) and be relevant to multiple sectors, including hydraulic infrastructure design, flood and drought management policy. A recent study of probable
15
maximum precipitation (PMP) and climate change (Kunkel et al., 2013) may offer new ways to blend physics and data-driven insights for precipitation extremes.
Can data-driven methods provide new insights for understanding and characterizing these extremes? Figure 3 (bottom) presents fully automated and computationally ef-ficient spatio-temporal characterization of long-term droughts using a Markov random
20
field-based approach (Fu et al., 2012). The algorithm was able to detect some of the major global droughts and proved to be efficient in detecting droughts as compared to fixed percentile-based approaches for drought detection. The method has been applied to detect all persistent droughts over the past century (1901–2006). Negative precipi-tation anomalies of at least 5 yr are considered as significant (hydrologic) droughts and
25
NPGD
1, 51–96, 2014Physics-guided data mining techniques
A. R. Ganguly et al.
Title Page
Abstract Introduction
Conclusions References
Tables Figures
◭ ◮
◭ ◮
Back Close
Full Screen / Esc
Printer-friendly Version Interactive Discussion
Discussion
P
a
per
|
D
iscussion
P
a
per
|
Discussion
P
a
per
|
Discuss
ion
P
a
per
|
height. In fact, this MRF-based approach, once generalized to multiple variables, may be viewed as a methodological improvement to the wavelet-based method (Narisma et al., 2007) for abrupt drought detection in the literature. One of the advantages is the ability to fully automate the drought detection procedure with a lesser number of pre-defined parameters, which may be useful for the detection of megadroughts from
pa-5
leoclimate data or plausible megadroughts from model projections. The value-addition of the MRF-based approach, beyond proof-of-concept detection of known droughts, would be demonstrated when the methods are generalized for multiple variables, and subsequently used for the evaluation of historical multi-model ensembles as well as for the generation of future projections with uncertainty from model projections in
fore-10
cast mode. On a completely different scale, our recent research (Ganguli and Gan-guly, 2013) explores severity-duration-frequency curves for observed meteorological droughts over the continental US during the last few decades through copula-based approaches.
6 Computational challenges in downscaling
15
As long as the spatiotemporal scales relevant to stakeholders and policymakers are inadequately resolved by global climate models, downscaling will continue to remain highly relevant to impact analyses. Driven by global climate model outputs, downscal-ing inherits many of their problems and generates (often massive volumes of) additional data, thus amplifying the Big Data challenge in terms of both data size and
complex-20
ity. Statistical downscaling (Bürger et al., 2012; Mannshardt-Shamseldin et al., 2010; Robertson et al., 2004) model outputs are relatively computationally inexpensive to generate, but criticisms (Eden et al., 2012; Schmith, 2008) have focused on model complexity and the lack of clarity on whether statistical models will perform well far into the future or on disparate regions. Dynamical downscaling (Pierce et al., 2012;
25
NPGD
1, 51–96, 2014Physics-guided data mining techniques
A. R. Ganguly et al.
Title Page
Abstract Introduction
Conclusions References
Tables Figures
◭ ◮
◭ ◮
Back Close
Full Screen / Esc
Printer-friendly Version Interactive Discussion
Discussion
P
a
per
|
D
iscussion
P
a
per
|
Discussion
P
a
per
|
Discuss
ion
P
a
per
|
either. The primary advantages over statistical downscaling are explicit incorporation of topography and higher-resolution process-models, which are critical given the possible importance of finer-scale processes (Jung et al., 2012; Diffenbaugh et al., 2005). How-ever, regional climate models parameterize such processes, often leading to significant inter-model disagreement, e.g., on precipitation (Palmer et al., 2004).
5
Figure 4 illustrates the ability of both statistical (Ghosh, 2010) and dynamical (Heikkilä et al., 2010) downscaling to provide precise insights compared to the orig-inal global model results. Dynamical downscaling over the island-nation of Sri Lanka (Fig. 4, top) suggests, upon visual inspection, that the approach may be able to better capture the expected influence of topography on heat waves beyond global models,
10
particularly since successive resolution-enhancements reveal distinct orographic pat-terns. On the other hand, the statistical hypothesis test does not necessarily indicate significant improvement, which suggests the importance of multi-metric explorations and rigorous evaluation of downscaling results. However, while the value of dynamical downscaling as a tool for hypothesis testing cannot be denied (despite news articles
15
such as Kerr, 2013), the propagation of uncertainty (Sain et al., 2011) remains a chal-lenge for projections. Over India, while global models suggest a uniform increase in rainfall extremes trends, the results from statistical downscaling (Fig. 4, bottom) show evidence for considerable geographical heterogeneity, which in turn agree with the lat-est findings on spatial variability of extremes (Ghosh et al., 2011).
20
7 Complexity of uncertainty assessments
A thorough and comprehensive characterization and quantification of uncertainty, which may result from imprecise observational data, inadequate models, or intrinsic climate system variability, is invaluable for stakeholders and policy-makers but difficult and often even impossible to achieve. Best-estimate projections and corresponding
un-25
NPGD
1, 51–96, 2014Physics-guided data mining techniques
A. R. Ganguly et al.
Title Page
Abstract Introduction
Conclusions References
Tables Figures
◭ ◮
◭ ◮
Back Close
Full Screen / Esc
Printer-friendly Version Interactive Discussion
Discussion
P
a
per
|
D
iscussion
P
a
per
|
Discussion
P
a
per
|
Discuss
ion
P
a
per
|
historical climate patterns (Pierce et al., 2009), but that alone may not be sufficient for climate models in view of non-stationarity and long lead time projections. Multimodel agreement in the future becomes an important metric, with the notion that consensus implies higher certainty (Overpeck et al., 2011; Weigel et al., 2010). Empirical stud-ies suggest that averages of output from multiple models outperform individual
mod-5
els, this insight being insensitive to which specific models are averaged (Pierce et al., 2009). However, the value of multimodel averages has been questioned (Knutti, 2010), particularly for regional assessments (Knutti et al., 2010; Kodra et al., 2012). Recent attempts at regional assessments include the development of statistical methods that consider both model performance relative to historical observed data and model
en-10
semble agreement (Smith et al., 2009; Ganguly et al., 2013).
One way to improve the uncertainty assessment approaches may be to consider physical and correlative relations in combination with historical model skills and future multimodel agreement. For example, in Fig. 5, observations and model simulations may exhibit regional differences in their adherence to known physical relations.
Eval-15
uating the extent to which observed rainfall extremes follow physical relationships like the Clausius-Clapeyron (CC) may help identify systematic patterns in extreme rainfall behavior that could be encapsulated in multimodel uncertainty quantification method-ology. We are not aware of any existing statistical strategy (e.g., along the lines of Smith et al., 2009) that attempts to explicitly utilize theoretical physical processes in
20
addition to historical skills and multimodel agreement. In the top panel of Fig. 5, the ob-servations and multiple ESMs are compared to the theoretical CC (scaled to compare with the other curves) over the Eastern United States. An analogous plot is shown for the southwestern United States in (b); the use of different regions makes appar-ent the degree to which data (observed and modeled) adheres to conceptual physical
25
NPGD
1, 51–96, 2014Physics-guided data mining techniques
A. R. Ganguly et al.
Title Page
Abstract Introduction
Conclusions References
Tables Figures
◭ ◮
◭ ◮
Back Close
Full Screen / Esc
Printer-friendly Version Interactive Discussion
Discussion
P
a
per
|
D
iscussion
P
a
per
|
Discussion
P
a
per
|
Discuss
ion
P
a
per
|
return values on mean temperature. This is performed for all models and for NCEP2 reanalysis. Regression model fits are depicted by the colored lines. The theoretical CC relation is depicted by the red line; a manually calibrated multiplication scaling factor of 0.00023 (0.00027 for the southwest) was applied for visual purposes (to line the CC up in the same space as the data) that should not affect the results significantly. Note
5
that the level of the CC line has no real meaning beyond this scaling; only the expo-nential pattern does. Uncertainty bounds for the multimodel ensemble are created with a resampling scheme combined with the same spline regression.
Besides model-to-model uncertainty, internal model variability due to different choices of parameters is also a major source of uncertainty but is more difficult to
quan-10
tify due to computational constraints. Generating model simulations with multiple sets of parameters generates (Stainforth et al., 2005) a large number of simulations from a single global climate model but requires enormous computational resources (Stain-forth et al., 2002, 2005). Such an approach may generate substantial single model insights (Stainforth et al., 2005) but is not yet feasible on a massive, multimodel scale.
15
Evaluation of multiple models remains an important step in comprehensive uncertainty assessments, even though structural differences may make inter-model comparisons difficult and at times even infeasible.
Requirements to provide uncertainty estimates almost invariably magnify the data challenge, both by generating more model-simulated data (Stainforth et al.,
20
2005) and/or by requiring more data-intensive approaches. Even relatively easily-parallelizable approaches like the bootstrap method, which has been used with EVT (Ghosh et al., 2011; Kao and Ganguly, 2011; Kharin et al., 2007) to characterize uncer-tainties in return level estimates of climate variables, can benefit significantly from par-allel processing. The recently developed method of “bag of little bootstraps” (Kleiner et
25
NPGD
1, 51–96, 2014Physics-guided data mining techniques
A. R. Ganguly et al.
Title Page
Abstract Introduction
Conclusions References
Tables Figures
◭ ◮
◭ ◮
Back Close
Full Screen / Esc
Printer-friendly Version Interactive Discussion
Discussion
P
a
per
|
D
iscussion
P
a
per
|
Discussion
P
a
per
|
Discuss
ion
P
a
per
|
climate data across multimodel and multiple initial condition runs and with different statistical estimation approached may represent major challenges.
8 Enhanced understanding and predictions
Climate extremes, such as heavy rainfall or tropical cyclones, are known to depend on other climate variables (including mean states, local or regional variables, as well
5
as large-scale effects such as oceanic indices) that may be better simulated by mod-els, such as land and sea surface temperatures. Developments in correlative analysis (Reshef et al., 2011; Khan et al., 2007), extended to handle correlated data at multiple spatial and temporal scales, may help quantify conceptual understanding and possibly even discover new dependencies (Khan et al., 2006). Challenges in analyses of
histor-10
ical extreme events such as tornado and hurricane data involve attributing spatial and temporal scales of their behavior to climate change versus natural variability (Emanuel et al., 2008; Webster et al., 2005), as well as to data collection issues for tornadoes and cyclones (Brooks and Doswell, 2001; Emanuel, 2005) and discontinuity of operational definitions for tornadoes (Doswell et al., 2009). Innovative data-driven approaches that
15
consider these complexities are needed to build understanding of the physical behav-ior and drivers of tornadoes and hurricanes because physics-based modeling for these types of processes is still in early stages (Emanuel et al., 2008; Trapp et al., 2010).
New process understanding or novel insights from mining climate data may help enhance projections and ultimately reduce uncertainty. Although relatively
coarse-20
resolution global climate models are not able to directly simulate tropical cyclones, they have been used to develop aggregate statistics of hurricanes (Emanuel et al., 2008) under climate change. In the same manner, temperature and updraft velocity profiles have been used to constrain or enhance multimodel projections of precipi-tation extremes (Knutson et al., 2010; Wilhite and Glantz, 1985). These approaches
25
NPGD
1, 51–96, 2014Physics-guided data mining techniques
A. R. Ganguly et al.
Title Page
Abstract Introduction
Conclusions References
Tables Figures
◭ ◮
◭ ◮
Back Close
Full Screen / Esc
Printer-friendly Version Interactive Discussion
Discussion
P
a
per
|
D
iscussion
P
a
per
|
Discussion
P
a
per
|
Discuss
ion
P
a
per
|
and process understanding mutually inform, complement, and improve each other. Re-cently, even tornado occurrences have been associated with monthly environmental parameters (Tippett et al., 2012), though not necessarily in a climate change context.
Linear dimensionality reduction has been used (Mishra et al., 2012) for advancing understanding of climate processes like monsoons, which are known to be important
5
for hydrometeorological extremes. The relationships among large and high dimensional climate data can improve understanding of dominant processes and lead to enhanced projections through predictive modeling. The IPCC-SREX indicates that crucial pro-cesses that may influence climate extremes, such as El Niño or other climate oscilla-tors and monsoons, are not well understood. Inferences from surrogate data may yield
10
new insights on extremes processes: the use of ocean salinity data to understand the intensification of climate extremes (Durack et al., 2012) provides an example using a proxy data set for precipitation. Figure 6 (top) provides an example where new data mining methods (Kawale et al., 2011, 2013) for dipole discovery were used to extract information about climate oscillators that may be useful for model evaluation.
15
An intelligent combination of process understanding with data mining methods may yield new explainable predictive insights beyond statistical downscaling. In fact, the premise of statistical downscaling (discussed earlier), where one overall approach is linear dimensionality reduction followed by nonlinear regression (Ghosh, 2010), is that lower-resolution model outputs have information content about higher-resolution
vari-20
ables. We propose taking this one step further. Variables that are more reliably pro-jected by climate models may be used not only to improve our process understanding, but also to enhance projections of the climate extremes of interest. For enhanced cli-mate projections, especially given the importance of spatiotemporal neighborhoods, prevailing winds, intra-decadal to multi-decadal climate oscillators, and
teleconnec-25
tions, the number of potential explanatory variables may far exceed the number of observations available, which creates problems for classic regression.
NPGD
1, 51–96, 2014Physics-guided data mining techniques
A. R. Ganguly et al.
Title Page
Abstract Introduction
Conclusions References
Tables Figures
◭ ◮
◭ ◮
Back Close
Full Screen / Esc
Printer-friendly Version Interactive Discussion
Discussion
P
a
per
|
D
iscussion
P
a
per
|
Discussion
P
a
per
|
Discuss
ion
P
a
per
|
do so in a way that maximizes information useful for predicting a specific variable. Sparse regression (Negahban and Wainwright, 2011; Negahban et al., 2012) repre-sents promising alternatives under these situations. Sparse regressions based on con-straining the L1-norm of the regression coefficients became popular due to their abil-ity to handle high dimensional data unlike the regular regressions, which suffer from
5
overfitting and model identifiability issues especially when sample size is small. They are often the method of choice in many fields of science and engineering for simul-taneously selecting covariates and fitting parsimonious linear models that are better generalizable and easily interpretable. Sparse regularization methods have just be-gun to be applied to statistical downscaling (Ebtehaj et al., 2012; Phatak et al., 2011).
10
However, this method can also be applied for improved understanding of the complex dependence structure between climate variables, especially in a high-dimensional set-ting (Chatterjee et al., 2012; Das et al., 2012, 2013). High-performance computational challenges related to this general approach represent an active area of research.
Networks that connect nodes defined as spatial grid-cells (Steinhaeuser et al.,
15
2011b; Donges et al., 2013) or climate oscillators (Donges et al., 2009a), often known as “climate networks”, may be useful to represent climate dependencies and develop process understanding (Donges et al., 2009a, b). Figure 6 (bottom) provides an exam-ple of new data-driven predictive approaches (Chatterjee et al., 2012) that appear well-suited for high-dimensional and geographically-distributed climate data with complex
20
dependence structures. Network-based graphical models have been used to discover causality among different modes of climate variability (Ebert-Uphoffand Deng, 2012). New methods in nonlinear data sciences, from complex networks (Steinhaeuser et al., 2011a) to multifractals (García-Marín et al., 2013; Muzy et al., 2006), have demon-strated initial promise for better description and predictive insights on climate-related
25
NPGD
1, 51–96, 2014Physics-guided data mining techniques
A. R. Ganguly et al.
Title Page
Abstract Introduction
Conclusions References
Tables Figures
◭ ◮
◭ ◮
Back Close
Full Screen / Esc
Printer-friendly Version Interactive Discussion
Discussion
P
a
per
|
D
iscussion
P
a
per
|
Discussion
P
a
per
|
Discuss
ion
P
a
per
|
uncertainty reduction but also for relatively abrupt change and disturbance analysis or even for early warning systems.
9 Summary
One of the largest scientific gaps in climate change studies is the inability to develop credible projections of extremes with the degree of precision required for adaptation
5
decisions and policy. The dire consequences of climate-related extremes, even in de-veloped economies (Gall et al., 2011), may call for a range of well-informed adap-tation strategies from low-regret (Wilby and Keenan, 2012) to transformative (Kates et al., 2012). Improving regional projections (e.g., through variable selection or statis-tical downscaling) and characterizing natural variability (e.g., irreducible uncertainty
10
at decadal scales: Deser et al., 2012) are necessary for informing adaptation at stakeholder-relevant scales and planning horizons. As climate-related data approaches the scale of hundreds of petabytes (Overpeck et al., 2011), and climate data mining re-search continues to improve (Smyth et al., 1999; Robertson et al., 2004, 2006; Khan et al., 2006; Camargo et al., 2007a, b; Gaffney et al., 2007), new opportunities will
15
emerge (e.g., Monteleoni et al., 2013; Ganguly et al., 2013). Data-driven methods are complementary to, and indeed conditioned on, physics-based models; however, they need to be tailored to the complexity of climate data and processes. The methods may be motivated from often disparate data-science disciplines such as statistics and econometrics, machine learning and data mining in computer science, nonlinear
dy-20
namics in physics and signal processing in engineering. The blend of physics and data-driven insights has conceptual similarities with data assimilation methods (e.g., Gerber and Joos, 2013). However, data assimilation methods are ultimately constrained by the physics encoded within climate models, and updates to parameters or state vari-ables cannot be made in the future where no observations exist. The physics-guided
25
NPGD
1, 51–96, 2014Physics-guided data mining techniques
A. R. Ganguly et al.
Title Page
Abstract Introduction
Conclusions References
Tables Figures
◭ ◮
◭ ◮
Back Close
Full Screen / Esc
Printer-friendly Version Interactive Discussion
Discussion
P
a
per
|
D
iscussion
P
a
per
|
Discussion
P
a
per
|
Discuss
ion
P
a
per
|
forecasting), physically motivated variable selection in statistical downscaling (e.g., cer-tain analog methods: Zorita and Von Storch, 1998), or physics-based model selection (Fasullo and Trenberth, 2012) and physically-guided climate networks (Donges et al., 2009b; Steinhaeuser and Tsonis, 2013). The climate extremes exemplars discussed here are a collection of outstanding challenges where data mining already does or
5
can play an innovative new role; various scientific communities will have to decide which specific directions to pursue guided by a combination of stakeholder priorities and which problems they are best positioned to address. Once developed and refined, physics-guided data mining methods are well positioned to produce new scientific un-derstanding and credible projections of climate extremes leading to more informed
10
adaptation and policy.
Acknowledgements. The work was primarily funded by the United States (US) National Sci-ence Foundation (NSF) Expeditions in Computing Grant #1029711. Partial funding was pro-vided by the US Nuclear Regulatory Commission, the Planetary Skin Institute, the US NSF Grant IIS-0905581, and the US Department of Energy (DOE) BES and BER Offices. We thank
15
Debadrita Das, David J. Erickson III, Joseph Kanney, Vimal Mishra and Habib Najm for helpful discussions. We are grateful to the Survey of India of the Government of India and the United Nations Refugee Agency (UNHCR) for the maps of India and Sri Lanka respectively used in Fig. 4.
References
20
Armbrust, M., Fox, A., Griffith, R., Joseph, A. D., Katz, R., Konwinski, A., Lee, G., Patterson, D., Rabkin, A., Stoica, I., and Zaharia, M.: A view of cloud computing, Commun. ACM, 53, 50–58, doi:10.1145/1721654.1721672, 2010.
Benjamini, Y. and Hochberg, Y.: Controlling the false discovery rate: a practical and powerful approach to multiple testing, J. R. Stat. Soc. Ser. B, 57, 289–300, 1995.
25
NPGD
1, 51–96, 2014Physics-guided data mining techniques
A. R. Ganguly et al.
Title Page
Abstract Introduction
Conclusions References
Tables Figures
◭ ◮
◭ ◮
Back Close
Full Screen / Esc
Printer-friendly Version Interactive Discussion
Discussion
P
a
per
|
D
iscussion
P
a
per
|
Discussion
P
a
per
|
Discuss
ion
P
a
per
|
Bogdan, M., Ghosh, J., and Tokdar, S.: A comparison of the Benjamini-Hochberg procedure with some Bayesian rules for multiple testing, Honor Prof. Pranab K., available at: http:// projecteuclid.org/euclid.imsc/1207058275 (last access: 17 January 2014), 2008.
Bouwer, L. M.: Have Disaster Losses Increased Due to Anthropogenic Climate Change?, Bull. Am. Meteorol. Soc., 92, 39–46, doi:10.1175/2010BAMS3092.1, 2011.
5
Branstator, G. and Teng, H.: Two limits of initial-value decadal predictability in a CGCM, J. Climate, 23, 6292–6311, 2010.
Branstator, G., Teng, H., Meehl, G. A., Kimoto, M., Knight, J. R., Latif, M., and Rosati, A.: Systematic estimates of initial-value decadal predictability for six AOGCMs, J. Climate, 25, 1827–1846, 2012.
10
Brooks, H. and Doswell, C. A.: Some aspects of the international climatology of tornadoes by damage classification, Atmos. Res., 56, 191–201, doi:10.1016/S0169-8095(00)00098-3, 2001.
Burby, R. J.: Hurricane Katrina and the Paradoxes of Government Disaster Policy: Bringing About Wise Governmental Decisions for Hazardous Areas, Ann. Am. Acad. Pol. Soc. Sci.,
15
604, 171–191, doi:10.1177/0002716205284676, 2006.
Bürger, G., Murdock, T. Q., Werner, A. T., Sobie, S. R., and Cannon, a. J.: Downscaling Ex-tremes – An Intercomparison of Multiple Statistical Methods for Present Climate, J. Climate, 25, 4366–4388, doi:10.1175/JCLI-D-11-00408.1, 2012.
Camargo, S. J., Robertson, A. W., Gaffney, S. J., Smyth, P., and Ghil, M.: Cluster analysis of
20
typhoon tracks. Part I: General properties, J. Climate, 20, 3635–3653, 2007a.
Camargo, S. J., Robertson, A. W., Gaffney, S. J., Smyth, P., and Ghil, M.: Cluster analysis of typhoon tracks. Part II: Large-scale circulation and ENSO, J. Climate, 20, 3654–3676, 2007b.
Chatterjee, S., Steinhaeuser, K., Banerjee, A., Chatterjee, S., and Ganguly, A. R.: Sparse Group
25
Lasso: Consistency and Climate Applications., in SDM, 47–58, SIAM., 2012.
Chebana, F. and Ouarda, T. B. M. J.: Multivariate quantiles in hydrological frequency analysis, Environmetrics, 22, 63–78, doi:10.1002/env.1027, 2011.
Christenson, M., Manz, H., and Gyalistras, D.: Climate warming impact on degree-days and building energy demand in Switzerland, Energy Convers. Manag., 47, 671–686,
30
doi:10.1016/j.enconman.2005.06.009, 2006.
NPGD
1, 51–96, 2014Physics-guided data mining techniques
A. R. Ganguly et al.
Title Page
Abstract Introduction
Conclusions References
Tables Figures
◭ ◮
◭ ◮
Back Close
Full Screen / Esc
Printer-friendly Version Interactive Discussion
Discussion
P
a
per
|
D
iscussion
P
a
per
|
Discussion
P
a
per
|
Discuss
ion
P
a
per
|
Dai, A.: Increasing drought under global warming in observations and models, Nat. Clim. Change, 3, 52–58, 2012.
Das, D., Ganguly, A., Banerjee, A., and Obradovic, Z.: Towards understanding dominant pro-cesses in complex dynamical systems, in Proceedings of the Sixth International Workshop on Knowledge Discovery from Sensor Data – SensorKDD ’12, 16–24, ACM Press, New York,
5
New York, USA, 2012.
Das, D., Ganguly, A. R., and Obradovic, Z.: A Sparse Bayesian Model for Dependence Analysis of Extremes: Climate Applications, in the International Conference on Machine Learning (ICML) workshop on Inferning: Interactions between Inference and Learning, 2013.
Dean, J. and Ghemawat, S.: MapReduce: simplified data processing on large clusters,
Com-10
mun. ACM, 51, 107–113, doi:10.1145/1327452.1327492, 2008.
DelSole, T. and Tippett, M. K.: Average predictability time. part I: Theory, J. Atmos. Sci., 66, 1172–1187, 2009a.
DelSole, T. and Tippett, M. K.: Average predictability time. Part II: Seamless diagnoses of pre-dictability on multiple time scales, J. Atmos. Sci., 66, 1188–1204, 2009b.
15
Deser, C., Phillips, A., Bourdette, V., and Teng, H.: Uncertainty in climate change projections: the role of internal variability, Clim. Dynam., 38, 527–546, 2012.
Diffenbaugh, N. S., Pal, J. S., Trapp, R. J., and Giorgi, F.: Fine-scale processes regulate the re-sponse of extreme events to global climate change, Proc. Natl. Acad. Sci. USA, 102, 15774– 15778, 2005.
20
Donges, J. F., Zou, Y., Marwan, N., and Kurths, J.: Complex networks in climate dynamics, Eur. Phys. J. Spec. Top., 174, 157–179, doi:10.1140/epjst/e2009-01098-2, 2009a.
Donges, J. F., Zou, Y., Marwan, N., and Kurths, J.: The backbone of the climate network, Eur. Phys. Lett., 84, 48007, doi:10.1209/0295-5075/87/48007, 2009b.
Donges, J. F., Petrova, I., Loew, A., Marwan, N., and Kurths, J.: Relationships between eigen
25
and complex network techniques for the statistical analysis of climate data. arXiv preprint arXiv:1305.6634, 2013.
Doswell, C. A., Brooks, H. E., and Dotzek, N.: On the implementation of the enhanced Fujita scale in the USA, Atmos. Res., 93, 554–563, doi:10.1016/j.atmosres.2008.11.003, 2009. Dudoit, S., Shaffer, J., and Boldrick, J.: Multiple hypothesis testing in microarray experiments,
30
NPGD
1, 51–96, 2014Physics-guided data mining techniques
A. R. Ganguly et al.
Title Page
Abstract Introduction
Conclusions References
Tables Figures
◭ ◮
◭ ◮
Back Close
Full Screen / Esc
Printer-friendly Version Interactive Discussion
Discussion
P
a
per
|
D
iscussion
P
a
per
|
Discussion
P
a
per
|
Discuss
ion
P
a
per
|
Durack, P. J., Wijffels, S. E., and Matear, R. J.: Ocean salinities reveal strong global water cycle intensification during 1950 to 2000, Science, 336, 455–458, doi:10.1126/science.1212222, 2012.
Ebert-Uphoff, I. and Deng, Y.: Causal Discovery for Climate Research Using Graphical Models, J. Climate, 25, 5648–5665, doi:10.1175/JCLI-D-11-00387.1, 2012.
5
Ebi, K. L. and Meehl, G. A.: The heat is on: climate change and heatwaves in the Midwest, in: Regional Impacts of Climate Change: Four Case Studies in the United States, Pew Center on Global Climate Change, Arlington, Virginia, 2007.
Ebtehaj, A. M., Foufoula-Georgiou, E., and Lerman, G.: Sparse regularization for precipitation downscaling, J. Geophys. Res., 117, D08107, doi:10.1029/2011JD017057, 2012.
10
Eden, J. M., Widmann, M., Grawe, D., and Rast, S.: Skill, Correction, and Downscaling of GCM-Simulated Precipitation, J. Climate, 25, 3970–3984, doi:10.1175/JCLI-D-11-00254.1, 2012. Efron, B.: Size, power and false discovery rates, Ann. Stat., available at: http://projecteuclid.
org/euclid.aos/1188405614 (last access: 17 January 2014), 2007.
Emanuel, K.: Increasing destructiveness of tropical cyclones over the past 30 years, Nature,
15
436, 686–688, doi:10.1038/nature03906, 2005.
Emanuel, K., Sundararajan, R., and Williams, J.: Hurricanes and Global Warming: Re-sults from Downscaling IPCC AR4 Simulations, Bull. Am. Meteorol. Soc., 89, 347–367, doi:10.1175/BAMS-89-3-347, 2008.
Fasullo, J. T. and Trenberth, K. E.: A less cloudy future: The role of subtropical subsidence in
20
climate sensitivity, Science, 338, 792–794, 2012.
Field, C. B., Barros, V., Stocker, T. F., and Qin, D.: Managing the Risks of Extreme Events and Disasters to Advance Climate Change Adaptation, edited by: Field, C. B., Barros, V., Stocker, T. F., and Dahe, Q., Cambridge University Press, Cambridge, 2012.
Fu, Q., Banerjee, A., Liess, S., and Snyder, P.: Drought Detection of the Last Century: An
25
MRF-based Approach, in: Proceedings of the 2012 SIAM International Conference on Data Mining, p. 11., 2012.
Gaffney, S. J., Robertson, A. W., Smyth, P., Camargo, S. J., and Ghil, M.: Probabilistic cluster-ing of extratropical cyclones uscluster-ing regression mixture models, Clim. Dynam., 29, 423–440, 2007.
30
NPGD
1, 51–96, 2014Physics-guided data mining techniques
A. R. Ganguly et al.
Title Page
Abstract Introduction
Conclusions References
Tables Figures
◭ ◮
◭ ◮
Back Close
Full Screen / Esc
Printer-friendly Version Interactive Discussion
Discussion
P
a
per
|
D
iscussion
P
a
per
|
Discussion
P
a
per
|
Discuss
ion
P
a
per
|
Ganguly, A. R. and Bras, R. L.: Distributed quantitative precipitation forecasting using informa-tion from radar and numerical weather predicinforma-tion models, J. Hydrometeorol., 4, 1168–1180, 2003.
Ganguly, A. R., Gama, J., Omitaomu, O. A., Gaber, M., and Vatsavai, R. R. (Eds.): Knowledge discovery from sensor data, CRC Press, 215 pp., 2009a.
5
Ganguly, A. R., Steinhaeuser, K., Erickson, D. J., Branstetter, M., Parish, E. S., Singh, N., Drake, J. B., and Buja, L.: Higher trends but larger uncertainty and geographic variability in 21st century temperature and heat waves, Proc. Natl. Acad. Sci. USA, 106, 15555–15559, doi:10.1073/pnas.0904495106, 2009b.
Ganguly, A. R., Kodra, E., Chatterjee, S., Banerjee, A., and Najm, H. N.: Computational Data
10
Sciences for Actionable Insights on Climate Extremes and Uncertainty, Computational Intel-ligent Data Analysis for Sustainable Development, Chap. 5, 1127–1156, 2013.
Ganguli, P. and Ganguly, A. R.: Severity-Duration-Frequency curves of meteorological droughts over continental United States, Abstract No. H44C-04, presented at 2013 Fall Meeting, AGU, San Francisco, Calif., 9–13 December, 2013.
15
García-Marín, A. P., Ayuso-Muñoz, J. L., Jiménez-Hornero, F. J., and Estévez, J.: Selecting the best IDF model by using the multifractal approach, Hydrol. Process., 27, 433–443, doi:10.1002/hyp.9272, 2013.
Gerber, M. and Joos, F.: An Ensemble Kalman Filter multi-tracer assimilation: Determining uncertain ocean model parameters for improved climate-carbon cycle projections, Ocean
20
Model., 64, 29–45, 2013.
Ghosh, S.: SVM-PGSL coupled approach for statistical downscaling to predict rainfall from GCM output, J. Geophys. Res., 115, D22102, doi:10.1029/2009JD013548, 2010.
Ghosh, S., Das, D., Kao, S.-C., and Ganguly, A. R.: Lack of uniform trends but increas-ing spatial variability in observed Indian rainfall extremes, Nat. Clim. Chang., 2, 86–91,
25
doi:10.1038/nclimate1327, 2011.
Giannakis, D. and Majda, A. J.: Quantifying the predictive skill in long-range forecasting. Part I: Coarse-grained predictions in a simple ocean model, J. Climate, 25, 1793–1813, 2012. Goswami, B. N., Venugopal, V., Sengupta, D., Madhusoodanan, M. S., and Xavier, P. K.:
In-creasing trend of extreme rain events over India in a warming environment, Science, 314,
30