Abstract—This study was undertaken to assess the visual
symptoms complaints among computer users in Industrially Developing Countries(IDCs) using the University of Benin, Benin City, Nigeria, as a case study. The focus was on Cathode-Ray Tube (CRT)-based Visual Display Units (VDUs). A total of 121 copies of structured questionnaires were administered to frequent computer users between the ages of 10 and 35 years (not having presbyopia) with exclusion criteria of magnitude +1 hyperopia. One hundred and three (103) completed questionnaires were returned and analyzed. Three (3) visual symptoms namely: eyestrain, blurred distance vision and headache were used in the study since these symptoms lead to the occurrence of other symptoms like red eyes, double vision etc. Only severities of moderate and severe were used while mild cases were considered
to be very close to no occurrence. We then used number of hours,
level of computer room illumination and screen contrast, viewing in determining visual symptoms occurrences. Our findings in this study revealed that proper computer workplace illumination, screen contrast, work interval before break, viewing distances and viewing angles during computer work go a long way in preventing the occurrence of visual symptoms thus, the need for proper computer workplace ergonomics.
Index Terms— Computer, Illumination, Presbyopia, VDU
I. INTRODUCTION
The introduction of mass-produced Visual Display Units (VDUs) into the workplace has existed for over 30years [1]. When first introduced into the workplace, the VDUs were suggested as the cause of many health complaints. In almost all offices, Colleges, Universities and homes today, the Video Display Terminals (VDTs) are becoming commonplace items [1], [3]. This is attributed to the rapid proliferation of computers since approximately 90million adults’ use computers regularly, worldwide [1]. Many individuals who work with a computer experience eye-related discomforts or visual problems. The level of discomfort appears to increase with the amount of computer use [2], [3]. However, based on
Manuscript received March 14, 2007.
S. C. Chiemeke is with the Department of Computer Science, University of Benin, Benin City, Nigeria (corresponding Author phone: +2348023158911; e-mail: [email protected]).
A. E. Akhahowa is with the Department of Computer Science, University of Benin, Benin City, Nigeria (e-mail: allen ).
O. B. Ajayi is with the Optometry Department, University of Benin, Benin City, Nigeria (e-mail: [email protected]).
current evidence, it is unlikely that the use of computers causes permanent changes or damage to the eyes or visual system [4], [5].
The use of computer software educational programs and computer-generated games are becoming commonplace in schools today. A high percentage of elementary schools introduce children to the basic skills of computing. Increasingly, schools are introducing computer-based curriculum as a component of the general education of the elementary aged students [6]. It was however proposed [7], that caution must be exercised to avoid overuse of computer programs as a learning and educational tool.
Studies ([2], [3], [8], [9], [10]) have found that the majority of computer workers experience some eye or vision symptoms. However, it is unclear whether these problems occur to a greater extent in computer workers than in workers in other highly visually demanding occupations. A national survey by doctors of optometry found that more than 14% of their patients were present with eye or vision-related symptoms resulting from computer work [11]. The most common symptoms reported [3] were eyestrain, headaches, blurred vision and, neck or shoulder pain. Vision problems experienced by computer operators are generally only temporary and will decline after stopping computer work at the end of the day [12], [13]. However, some workers may experience continued impaired or reduced visual abilities such as blurred distance vision, even after work [14], [15]. Work that is usually and physically fatiguing may result in lowered productivity, increased error rate and reduced job satisfaction. Therefore, steps should be taken to reduce the potential for development of stress and related ocular and physical discomfort in the workplace [16], [17].
The drastic reduction in the price of computers has resulted in an increase in its usage in many organizations and homes. Consequently, complaints of visual symptoms reported daily are on the increase, thus computer workers tend to abandon their jobs running into hours as a result of visual pains. The problem is further compounded by the fact that many Industrially Developing Countries (IDCs) like Nigeria, are suddenly adapting to prolonged use of computers. Awareness of these visual problems has been minimally stressed in most IDCs. Although, some of the reported studies lack uniformity even though they were carried out in the Developed Countries, having anthropometric dimensions, work culture of users, office culture and adaptability which are quite different from
Evaluation of Vision-Related Problems amongst
Computer Users: A Case Study of University of
Benin, Nigeria
those of Industrially Developing Countries (IDCs). Visual symptoms complaints associated with the use of computer systems affect millions of users in developed countries. With the proliferation of computer systems in the industrially Developing Countries (IDCs), the associated visual fatigue symptoms are yet to be investigated. This serves as impetus for this study. The aim of this study therefore is to evaluate visual-related problems among computer users in the IDCs, using University of Benin, Benin City, Nigeria, as a case study and then recommend measures that can be taken to prevent or reduce its development, so that they can become things of the past.
II. MATERIALS AND METHODS
The major instrument used for the study was a structured questionnaire. A total of 121 copies of 22 self-developed structured questionnaires were administered to obtain information from frequent computer users. It consists of four sections of questions. The first section requested for background information like sex, age and job title of the participants. The second section was designed to ascertain the mode, pattern and degree of usage of computers. This is to actually get some of the causes of visual fatigue due to the use of computer systems. The third section was designed to assess some of the visual symptoms due to the use of computer systems, as well as their severity, if any. The severity of visual symptoms was assessed using a 4-point visual symptoms index namely:
0. Never/No symptom 1. Mild symptom 2. Moderate symptom 3. Severe symptom
The fourth section was designed to assess the respondents’ knowledge on ergonomics and to test the knowledge of the subjects on the preventive measures, and to also know if ergonomics guidelines are offered at their various workplaces. Subjects involved in this study included university employees as well as public and private sector staff selected at offices, cyber cafes and other commercial centres (e.g. banks) in the University of Benin campus, who used computers during their working hours for a period of time. Subjects were between the ages of 10 and 35 years. Informed consent was obtained from the subjects and exclusion criteria were magnitude of +1 hyperopia. University of Benin, Benin City was chosen because frequent users of computers and Internet are easily found there. This is attributed to the rapid growth of ICT in the university following the introduction of e-learning centres and cybercafe’s run by UBTECH for students’ online facilities. Thus, staff and students are speedily embracing computer technology with many ignorant of the associated visual symptoms complaints which require preventive measures. Also, the case study was used as a result of its proximity to the researchers. A total of 103 respondents out of the 121 returned their questionnaires giving a response rate of 85.15%. The questionnaires were analyzed using Statistical Package for Social Scientists (SPSS) Version 11.0 for Windows.
III. RESULTS
One hundred and three (103) completed questionnaires were returned comprising 56 males and 47 females yielding a percentage of 54.4% and 45.6%, respectively. School pupils/children were involved in the study. These children are those who use computers frequently to watch films, play games and listen to instructional lectures. The mean age of the respondents was 26 ± 6.1years. Only a small percentage (32%) of the respondents was aware of preventive measures for visual symptoms, while minority (1%) had former ergonomics guidelines/policies at their workplace. Thus 15hours on the average were lost in the last one month due to visual related symptoms, because respondents said they had to abandon their works running into hours.
A. Severity of Visual Symptoms/Complaints
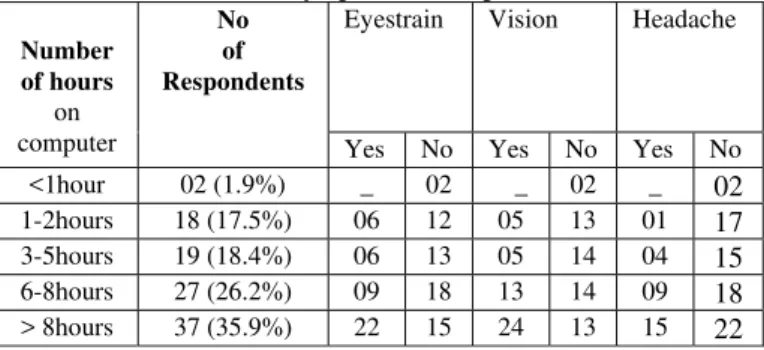
Table 1 shows the various visual symptoms experienced by respondents during computer work. The data shows that 42.7%, 45.7% and, 28.2% of the respondents experience eyestrain, blurred distance vision and, headache respectively (ranging from moderate to severe cases).
Table 1: Visual Related Symptoms of Respondents
Eyestrain Vision Headache Number
of hours on computer
No of Respondents
Yes No Yes No Yes No <1hour 02 (1.9%) _ 02 _ 02 _ 02 1-2hours 18 (17.5%) 06 12 05 13 01 17 3-5hours 19 (18.4%) 06 13 05 14 04 15 6-8hours 27 (26.2%) 09 18 13 14 09 18 > 8hours 37 (35.9%) 22 15 24 13 15 22
B. Number of Hours on Computer Daily Of Computer Users and Visual Symptom Severity
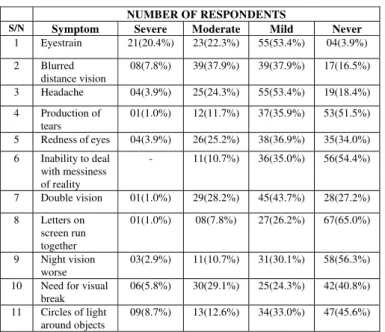
Table 2: Number of hours on computer daily and occurrence of eyestrain, blurred distance vision and headache
NUMBER OF RESPONDENTS
S/N Symptom Severe Moderate Mild Never
1 Eyestrain 21(20.4%) 23(22.3%) 55(53.4%) 04(3.9%)
2 Blurred distance vision
08(7.8%) 39(37.9%) 39(37.9%) 17(16.5%)
3 Headache 04(3.9%) 25(24.3%) 55(53.4%) 19(18.4%)
4 Production of tears
01(1.0%) 12(11.7%) 37(35.9%) 53(51.5%)
5 Redness of eyes 04(3.9%) 26(25.2%) 38(36.9%) 35(34.0%)
6 Inability to deal with messiness of reality
- 11(10.7%) 36(35.0%) 56(54.4%)
7 Double vision 01(1.0%) 29(28.2%) 45(43.7%) 28(27.2%)
8 Letters on screen run together
01(1.0%) 08(7.8%) 27(26.2%) 67(65.0%)
9 Night vision worse
03(2.9%) 11(10.7%) 31(30.1%) 58(56.3%)
10 Need for visual break
06(5.8%) 30(29.1%) 25(24.3%) 42(40.8%)
11 Circles of light around objects
09(8.7%) 13(12.6%) 34(33.0%) 47(45.6%)
C. Type of Computer Room Lighting, Break and Screen Contrast
Result in Table3 shows that majority of the respondents employ fluorescent lighting in their workplaces thus, it is common in Nigerians workplaces. Table 3 also shows that the brighter the light that illuminates the computer room, the longer a computer user tends to sit comfortably working with the computer (i.e. the higher the work interval before break). Also, those employing brighter light for room illumination prefer matching it with bright background screen, as seen in Table 3 where majority of those employing fluorescent light and other bright lights employ light background VDU screen. Visual symptom complaints were less for respondents employing dark background VDU screen.
D.
Viewing Distance and Visual Symptom Severity
The study also revealed that (Table 4) that 16.5%, 35.0%, 26.2%, 17.5% and 4.9% of respondents employ a viewing distance of less than 10inches, 10-20inches, 20-30inches, 30-40inches and above 40inches, respectively. The data shows that visual complaints were more pronounced with people employing a viewing distance of less than 10inches. Visual complaints at different anatomical regions were prompted among the respondents that employ viewing distances of less than 10 inches and 10-20inches. Visual complaints were less for respondents employing viewing distances of 20-30inches and 30-40inches.Table 4: Viewing Distance and Severities of Eyestrain, Blurred Distance Vision and Headache
Eyestrain Blurred Distance Vision
Headache
Number of hours
on computer
No of Respondents
Yes No Yes No Yes No
< 10inches 17 (16.5%) 11 06 06 11 11 06
10-20inches 36 (35.2%) 22 14 14 22 20 16
20-30inches 27 (26.2%) 04 23 02 25 11 16
30-40inches 18 (17.5%) 06 12 06 12 05 13
> 40inches 05 (4.9%) - 05 01 04 - 05
E.
Viewing Angle and Visual Symptom Severity
Table 5 shows that 33.0 %, 35.9% and 31.1% of respondents employ an upward viewing angle to the horizontal of less than 15 degree, 15-30 degree and 30-50 degree, respectively. The data also shows that visual complaints were more pronounced with respondents employing a viewing angle of 30-50 degree. Thus, visual complaints perceptions at different anatomical regions were prompted among the respondents that employ a viewing angle of 15-30 degree and, 30-50 degree. Those employing a gaze angle of less than 15 degree recorded the lowest visual complaints
Table 5: Viewing Angle and Severities of Eyestrain, Blurred Distance Vision and Headache
Eyestrain Blurred Distance Vision
Headache
Number of hours
on computer
No of Respondents
Yes No Yes No Yes No
< 15degrees 34 (33.0%) 01
33 01 33 03 31
15-30degrees 37 (35.9%) 22
15 11 26 18 19
30-50degrees 32 (31.1%) 21 11 14 18
24 08
IV. DISCUSSIONS
The purpose of this study was to assess the visual symptoms complaints associated with the use of computer systems in Industrially Developing Countries, taking University of Benin, Benin City, Nigeria, as a case study. It was also aimed at recommending ergonomic guidelines that can be obeyed by computer workplaces towards finding a lasting solution to this scourge. The response rate in this study of 85.125 shows that the respondents were enthusiastic towards finding a solution to the visual symptoms complaints they suffer during computer work, since majority did not have ergonomics guidelines in their workplaces.
studies ([18], [19]) have shown that computer users are at increased risk of having such visual symptoms.
The result also shows that visual symptoms complaints begin to occur (or set in) after an uninterrupted 1hour of computer work. This is in line with an earlier observation [1] that so many guidelines were asserted that if one is a user even for periods totaling at least two to three hours per day, there is a chance of possible eye injury including Computer Vision Syndrome (CVS).The result shows that visual symptoms complaints were lowest for participants employing viewing distance of between 20 and 40inches, and a viewing angle of less than 15degrees. However, those employing a viewing distance of less than 10inches consider it too close and many using a viewing distance greater than 40inches consider it too far. This correlates with previous study [18] where it was stated that as the viewing angle is lowered, the visual strain becomes less as it reduces ocular surface area.
Our study also shows that the colour of computer characters and background also influence the severity of visual symptoms. These correlate with earlier reports ([18] and [20]) which asserted that either black characters on a white background or white characters on a black background have been found to more visible than green, yellow-orange, blue or red characters. This was further corroborated by other studies ([11], [21], [22], [23]) where it was found that overall display legibility is an important factor in visual performance.
V. CONCLUSION
The result emanating under this study revealed that the most complained visual problem is eyestrain. Visual pain begins to occur after one hour of computer work in a day. Practically, the results of this study can be useful in preventing visual symptoms complaints associated with the use of computer system. Thus, we recommend the following:
i) Use fluorescent lighting with good design in the computer room/workplace. The computer room should be well lit to avoid straining the eyes. Bright light should be matched with dark background screen to prevent visual symptoms. Avoid uncurtained (unshaded) windows, and ensure that the overall room illumination is more than three times brighter than the screen. Monitor should not face the source of light and brighter lighting should be employed for older individuals.
ii) Take breaks regularly during VDU work. The recommended break rule in this study is 20/05/15, which implies: Every 20minutes take at most 5minutes break and move 15feet from your VDU to perform eye-blinking exercise.
iii) VDU users should blink more during computer work. They can apply artificial tears to their eyes at regular interval to keep the eyes wet.
iv) Make use of antiglare screen or “radiation absorbing devices” with VDUs, which help reduce glare, which may
result in eyestrain, blurred distance vision and headache in moderate and severe cases.
v) The recommended viewing distance (distance between user’s eyes and the VDU) and viewing angle (gaze angle) in this study is 20-40inches (i.e. 50-100cm) and
<15degrees, respectively. Thus, every VDU user should ensure that this distance and angle is strictly obeyed during VDU work.
vi) Arrange VDUs in the workplace in a way that the operator is at considerable distance from the VDU and that there is also a considerable distance between the operator and other VDUs in the workplace (i.e. to ensure that the recommended viewing distance of 20-40inches is obeyed). With these recommendations, companies should be able to establish ergonomic guidelines and also enhance (build) on the present guidelines, if any, in order to enhance their workers productivities and activities, and reduce visual-related problems due to computer work.
REFERENCES
[1] Sen, A., & Richardson, S. (2002). ‘Some controversies relating to the causes and preventive management of Computer Vision Syndrome”. Downloaded on September 24, 2005 from: http://cyberg.wits.ac.za/cyberg/sessiondocs/organisational/educ/educ6/e duc6.htm
[2] National Institute for Occupational Safety and Health (1981). “Potential health hazards of video display terminals”. DHHS (NIOSH) publication No. 81-129. Cincinnati: National Institute of Occupational Safety and Health.
[3] Smith, M. J., Cohen, B. C. F., & Stammerjohn, L. W. (1981). “An investigation of health complaints and job stress in video display operations”. Human Factors, 23, 387-400.
[4] Cole, B. L., Maddocks, J. D., & Sharpe, K. (1996). “Effects of VDUs on the eyes: Report of a 6-year epidemiological study”. Optom. Vis. Sci., 73, 8, 512-528.
[5] Mutti, D. O., & Zadnik, K.(1996). “Is computer use a risk factor for myopia?”. J. Am. Optom. Assoc., 67, 9, 521-530.
[6] Shelton(1999). Market date retrieval, Shelton, CT, Unpublished data (copyrighted), 1999.
[7] Godnig, O.D., & Edward, C. (2002). “Children and Computer use: the impact on learning and visual development”. Journal of Behavioural Optometry, 13, 5, 115-118
[8] Collins, M. J., Brown, B., Bowman, K. J., & Carkeet, A. (1990). “Symptoms associated with VDT use”. Clin. Exp. Optometry., 73, 111-118
[9] Dainoff, M. J., Happ, A., & Crane, P(1981). “Visual fatigue and occupational stress in VDT operators”. Human Factors, 23, 421-438. [10] Staff, S. J., Thompson, C. R., & Shute, S. J.(1982). “Effects of video
display terminals on telephone operators”. Human Factors, 24, 699-711. [11] Sheedy, J. E.(1992). “Vision Problems at video display terminals: A
survey of optometrists”. J. Am. Optom. Assoc., 63, 10, 687-692. [12] Yeow, P. T., & Taylor, S.P. (1989). “Effects of short-term VDT usage on
visual functions”. Optom. Vis. Sci., 66, 7, 459-466.
[13] Yeow, P. T., & Taylor, S. P. (1991). “ Effects of long-term visual display terminal usage on visual functions”. Optom. Vis. Sci., 68, 12, 930-941. [14] Gur, S., & Ron, S.(1992). “Does work with visual display units impair
visual activities after work?”. Documenta Ophthal, 79, 3, 253-259. [15] Kahn, J., Fitz, J., Psaltis, P., & Ide, C. H.(1984). “Prolonged
complementary chromatopsia in users of video display terminals”. Am J
Ophthal 98, 756-758.
[16] Chapnik, E. & Gross, C. (1987). “Evaluation, office improvements can reduce VDT operator problems”. Occup Health & Safety, 56, 7, 34-37. [17] Paznik, M. J. (1986), August). “Ergonomics does pay”. Admin
[18] Ankrum, D.R. (1996). “Viewing Distance at Computer Workstations”.
Workplace Ergonomics, 2, 5, 10-13.
[19] American Optometric Association (1997). “The effects of video display terminals use on eye health and vision”. St. Louis: Am. Optom. Assn, 1997. Downloaded on May 02, 2005 from:
http://www.aoa.org/x1874.xml
[20] Murch, G. (1982, March). “How visible is your display?”, Electro-optical Systems Design, 43-49.
[21] Gould, J., & Grischkowsky, N.(1984). “Doing the same work with hard copy and with cathode-ray tube (CRT) computer terminals”. Human Factors, 26, 323-337.
[22] Gould, J., Alfaro, L., & Barnes, V.(1987). “Reading is slower from CRT displays than from paper: attempts to isolate a single variable explanation”. Human Factors, 29, 269-299.