www.atmos-chem-phys.net/8/4499/2008/ © Author(s) 2008. This work is distributed under the Creative Commons Attribution 3.0 License.
Chemistry
and Physics
Measurement of ambient aerosols in northern Mexico City by single
particle mass spectrometry
R. C. Moffet1, B. de Foy2,3, L. T. Molina2,4, M. J. Molina1, and K. A. Prather1
1University of California, San Diego, La Jolla, California, USA
2Molina Center for Energy and the Environment (MCE2), La Jolla, California, USA 3Saint Louis University, St. Louis, Missouri, USA
4Massachusetts Institute of Technology, Cambridge, Massachusetts, USA
Received: 18 April 2007 – Published in Atmos. Chem. Phys. Discuss.: 11 May 2007 Revised: 9 May 2008 – Accepted: 2 July 2008 – Published: 5 August 2008
Abstract. Continuous ambient measurements with aerosol
time-of-flight mass spectrometry (ATOFMS) were made in an industrial/residential section in the northern part of Mex-ico City as part of the MexMex-ico City Metropolitan Area-2006 campaign (MCMA-2006). Results are presented for the pe-riod of 15–27 March 2006. The submicron size mode con-tained both fresh and aged biomass burning, aged organic carbon (OC) mixed with nitrate and sulfate, elemental car-bon (EC), nitrogen-organic carcar-bon, industrial metal, and in-organic NaK inin-organic particles. Overall, biomass burning and aged OC particle types comprised 40% and 31%, respec-tively, of the submicron mode. In contrast, the supermicron mode was dominated by inorganic NaK particle types (42%) which represented a mixture of dry lake bed dust and indus-trial NaK emissions mixed with soot. Additionally, alumi-nosilicate dust, transition metals, OC, and biomass burning contributed to the supermicron particles. Early morning pe-riods (2–6 a.m.) showed high fractions of inorganic particles from industrial sources in the northeast, composed of inter-nal mixtures of Pb, Zn, EC and Cl, representing up to 73% of the particles in the 0.2–3µm size range. A unique nitrogen-containing organic carbon (NOC) particle type, peaking in the early morning hours, was hypothesized to be amines from local industrial emissions based on the time series profile and back trajectory analysis. A strong dependence on wind speed and direction was observed in the single particle types that were present during different times of the day. The early morning (3:30–10 a.m.) showed the greatest contributions from industrial emissions. During mid to late mornings (7– 11 a.m.), weak northerly winds were observed along with the
Correspondence to: K. A. Prather (kprather@ucsd.edu)
most highly aged particles. Stronger winds from the south picked up in the late morning (after 11 a.m.), resulting in a decrease in the concentrations of the major aged particle types and an increase in the number fraction of fresh biomass particles. The highest wind speeds were correlated with the highest number fraction of fresh biomass particles (up to 76% of the submicron number fraction) when winds were coming directly from fires that were located south and south-east of the city based on MODIS fire count data. This study provides a unique clock of hourly changes in single parti-cle mixing state and sources as a function of meteorology in Mexico City. These new findings indicate that biomass burning and industrial emissions can make significant contri-butions to primary particle loadings in Mexico City that are strongly coupled with local meteorology.
1 Introduction
To help impose regulatory measures that will decrease particulate matter (PM) pollution in Mexico City, scientists and policy makers need a better understanding of the spatial and temporal variability of the sources, size distribution, and chemical composition of the ambient aerosol. Knowledge of these parameters enables well-guided strategies for decreas-ing the PM fraction that is suspected to be the most harmful to human health. Prior to the development of the Automatic Ambient Air Quality Monitoring Network (RAMA) mea-surements that began in the mid 1980s, there were very few detailed measurements of particulate matter chemical com-position in Mexico City. From the late 1980s to present, a number of research groups measured PM chemical composi-tion in Mexico City by using filters to collect PM followed by analysis with Proton Induced X-Ray Emission (PIXE) (Mi-randa et al., 1992; Aldape et al., 1996; Aldape et al., 1996; Cahill et al., 1996; Miranda et al., 1998; Flores et al., 1999; Miranda et al., 2004). Flores (1999) showed increased con-centrations of lead, copper and zinc existed in the northern (industrial) part of the city. These results were further cor-roborated by other results from the sampling period (Mugica et al., 2002).
In the late 1990s, as part of the Aerosol and Visibility Evaluation Research (IMADA-AVER) campaign, Chow and co-workers measured the chemical composition of PM2.5
and PM10 at a variety of sites using filter based techniques
while also publishing complementary results characterizing the chemical composition of fugitive dust sources (Chow et al., 2002; Chow et al., 2002; Vega et al., 2002). Moya and co-workers examined the gas-particle equilibrium of ammo-nium and nitrate during the same campaign for purposes of evaluating thermodynamic models (Moya et al., 2001). They followed up those studies with size resolved measurements focusing on ammonium and sulfate from winter of 2000 to fall of 2001, but also included measurements of other cations (Moya et al., 2003). From January to February of 2003, Moya and co-workers provided a size-resolved characteriza-tion of inorganic species. They found an unexpectedly large concentration of K particles, which they attributed to dust from the dry lake bed of Texcoco in the northeastern part of the city (Moya et al., 2004).
The most recent and detailed studies of aerosols in Mex-ico City were carried out during the MCMA-2003 campaign (Baumgardner et al., 2004; Dunn et al., 2004; Jimenez et al., 2004; Jiang et al., 2005; Marr et al., 2006; Molina et al., 2007). Electron microscopy was used to infer the mix-ing state and transformation of soot particles (Johnson et al., 2005). Chemically resolved PM2.5 mass distributions were
obtained using a variety of techniques including Aerosol Mass Spectrometry (AMS), and other filter based techniques (Salcedo et al., 2006). Salcedo et al. (2006) were also able to track mass concentrations of select, non-refractory aerosol components with a higher time resolution than previously reported by Chow et al. (2002a), while showing a general agreement between the two studies. Newer source
apportion-ment measureapportion-ments during the MCMA-2003 campaign were able to classify major sources of particles including industrial emissions using factor analysis (Johnson et al., 2006). In-dustrial emissions found by Johnston et al. (2006) were well correlated with Na and Zn as well as other metals.
Many earlier studies of aerosol size and composition in Mexico City from 1990 to the present day were carried out as a part of major campaigns funded through an interna-tional effort (Molina et al., 2007). Prior to 2006, there were three major research initiatives that measured aerosol physico-chemical properties: The Mexico City Air Quality Research Initiative (MARI), IMADA-AVER and MCMA-2003. The current effort: MILAGRO (Megacity Initiative: Local and Global Research Observations) is the largest to date representing the collaboration of over 400 scientists, from more than 120 institutions. A component of MILA-GRO, MCMA-2006, with cooperation from NSF, DOE and a variety of Mexican and European agencies, represents an effort to characterize boundary layer emissions within the MCMA. On-line single particle mass spectrometry repre-sented a new approach for studying air quality in Mexico City during MCMA-2006. The single particle results pre-sented in this manuscript provide unique insights into the sources and processes contributing to the aerosol concentra-tions.
2 Experimental
2.1 Sampling site – T0
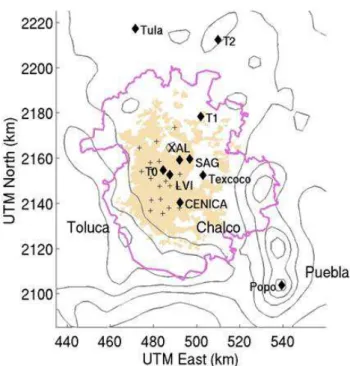
The ATOFMS instrument was located at the Instituto Mexi-cano del Petroleo (IMP) in the northern part of Mexico City (19◦29′23.60′′N, 99◦08′55.60′′W). This was one of the three supersites selected for the MILAGRO measurement cam-paign to characterize the transport of emissions from the ur-ban areas in the MCMA to the surrounding regions. Figure 1 shows the geographical location of the IMP site, referred as T0 (urban site). Measurements were located in a secondary structure on top of a five-story building. Sampling lines were placed>3 m above the building’s roof to minimize the ef-fects of sampling from the building ventilation exhaust ports. To the north was an 800 m high mountain, Pico Tres Padres, that served to block most of the winds coming from the north. Industrialized areas existed to the north, while residential ar-eas were located to the ar-east and south. The dry lake bed Lake Texcoco was located to the east. A busy roadway was also located on the east side of the site with traffic jams during most of the day and street vendors cooking primarily during the morning and afternoon.
Aerosol particles are drawn through a nozzle-type inlet where the gas undergoes a supersonic expansion, and the particles are accelerated to a specific terminal velocity de-pending on their aerodynamic size. Particle velocity is deter-mined by measuring the time-of-flight between two 50 mW diode pumped, solid state, frequency doubled Nd:YAG lasers operating at 532 nm. The single-particle scattering intensi-ties from the two light scattering channels were acquired and saved along with the other single particle size and chemistry data as described by Moffet et al. (2005). Particle size is cal-culated from the measured speed using a calibration curve generated with known sizes of standard polystyrene latex spheres. The speed of the particle is also used to time the arrival of the particle in the ion source region of the dual-polarity time-of-flight mass spectrometer. Once the particle is in the source region, a frequency quadrupled Nd:YAG laser operating at 266 nm with a typical pulse energy of 1.2 mJ desorbs and ionizes each particle. The ATOFMS measures both the positive and negative mass spectra of each particle simultaneously.
The ATOFMS has wide dynamic range (WDR) capabil-ities. This is accomplished by taking the two signals from the two mass spectra being measured (positive and nega-tive ion) and splitting them into an attenuated (30 dB) and non-attenuated channel, making four signals in total. The ATOFMS was operated from 6–29 March 2006. Due to dam-age incurred during shipment, from 6 March 2006 19:00:01 to 13 March 2006 16:00:01, the instrument was operated without the negative wide dynamic range channel. Thus, the results in this paper focus on the WDR period of the study between 15–27 March 2006.
A total of 1 million particles were sized and chemically analyzed with the ATOFMS. The typical percentage of parti-cles producing both size and chemical information was 50%; of these particles, 88% produced both positive and negative ion spectra. This percentage showed little variation over the study, indicating chemical matrix effects did not result in any major undetected particle types (Wenzel et al., 2003). Data from the ATOFMS were imported into a Matlab database program known as YAADA (www.yaada.org). Once in the Matlab database, the particles were split into two size groups: sub and super-micron having wide dynamic range. A sub-set of 24 000 particles from each size group were separately classified using ART-2a, a clustering algorithm (Song et al., 1999), run with a vigilance factor of 0.80 and a learning rate of 0.05. The clusters resulting from each analysis were matched to the rest of the particles in the complete dataset. In order to classify 933 000 out of 1 million particles, 60 sub-micron and 200 super-micron clusters (for each of the size groups) accounted for 88% of the chemically analyzed particles. The unclassified particles made up a large num-ber of sparsely populated clusters. The unclassified particles did not have any major temporal spikes indicating that the original number of particles given to ART-2a was sufficient. The particle clusters resulting from the ART-2a analysis were
Fig. 1. A map of the Mexico City Metropolitan Area (MCMA).
The site at which these measurements were carried out was called T0, and was located at the Instituto Mexicano Del Petroleo (IMP). RAMA sites are shown as the + symbol. The political border of the MCMA as of 2003 is in pink and urban areas (as of 1995) are in beige. Terrain contours are every 500 m.
grouped by hand into 15 general particle types based on the major ion peaks in their mass spectra. The uncertainties of all of the results presented here would mainly result from counting statistics. For the summary plots presented, the uncertainties (non-systematic errors) are normally less than 1% because the counts for these particle types were typically quite high (i.e. at least 1000 particles per type).
3 Results and discussion
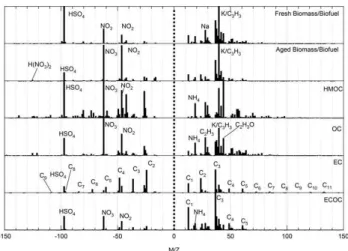
Fig. 2a. Average spectra of single particle types as determined with
the ART-2a clustering algorithm. The particle types shown here were the major types detected in the submicron size mode.
industrial emissions primarily occurring in the early morn-ing, and biomass and OC particles making the largest con-tributions to the aerosol fraction during the early morning to late afternoon hours. To identify possible source regions, a concentration field analysis was performed by combining ATOFMS time series with stochastic Lagrangian back tra-jectories (Sect. 3.5).
3.1 Mass spectral analysis of the major particle types The average mass spectra for the major single particle types are displayed in Fig. 2. In the submicron size mode, the top three ranked submicron particle clusters were 1) fresh biomass burning, 2) aged OC with ammonium, sulfate, and nitrate, and 3) aged biomass particles with nitrate, ammo-nium, oxidized OC, and nitrate. Other common submi-cron types include NaK, amines, and EC particles. Nitrate (−46NO−
2 and
−62NO−
3) was detected in most of the negative
ion spectra, indicating a significant amount of secondary pro-cessing. Other secondary markers in the positive ion spec-tra included 18NH+4 as well as 43C2H3O+, a marker used
to indicate oxidized organic species in the ATOFMS. The number fraction of particles mixed with ammonium, oxi-dized organic species, and nitrate tended to peak between 10 a.m.–12 p.m. LT. Fine mode carbonaceous particles also contained sulfate (97HSO−
4) in their negative ion spectra.
Coarse (super-micron) mode particle types (AlSi, NaK, Ca Dust) almost all contained secondary species such as nitrate in addition to other species such as35Cl−and79PO−
3. The
names for the categories presented below are based on the most abundant ion markers that allow them to be assigned to the original (primary) particle source. A discussion of the chemical associations between these primary particle types and other secondary species is given in Sect. 3.3.1 on mixing state.
Fig. 2b. Average spectra of single particle types as determined with
the ART-2a clustering algorithm. Them/zrange is extend to 250 Da compared to Fig. 2a to show important peaks such as Pb for the in-dustrial types and the unknown markers at 212–215 for the NOC type. Common coarse mode particle types shown here include: Ca, AlSi, and Na/K. The nitrogen organic carbon (NOC) type was pri-marily detected in the submicron size mode.
3.1.1 Carbonaceous particle types Biomass/Biofuel burning
In previous ATOFMS studies, signatures were obtained that can be used for the identification of biomass/biofuel burning particles (Silva et al., 1999; Guazzotti et al., 2003). Particles classified as biomass burning have39K+as one of the largest peaks in the positive ion mass spectrum. Additionally, the negative ion markers for many of the biomass particles show levoglucosan negative ion fragments at−45,−59, and−73. Many biomass particles also showed the presence of oxidized organic species as indicated by a peak atm/z43 (CH3CO+)
as well as ammonium (m/z18), nitrate (m/z−62), and sul-fate (m/z −97). Fresh and aged biomass clusters are split on the basis of nitrate ion intensity, with the aged biomass class having larger nitrate signals than sulfate. Additionally a nitrate cluster ion peak for aged biomass at m/z= −125 (H(NO3)2) was also observed, indicating significant amounts
OC
Organic carbon (OC) particles were the second most abun-dant submicron particle type observed during this study. These particles are similar to those detected in other ATOFMS field studies (Noble et al., 1996; Liu et al., 2003; Pastor et al., 2003) and vehicle source characterization stud-ies (Sodeman et al., 2005; Toner et al., 2006). OC particles are typified by hydrocarbon ion series that start with the base carbon peak12nC+
n. In Fig. 2a, two of the major OC peaks
are identified as27C2H+3 and43C2H3O+. Many spectra also
contain a large peak atm/z39 (K+), indicating coagulation between OC and biomass types or condensation of primary and secondary organic species on biomass seed particles. As discussed below, the majority of the OC particles were heav-ily processed and contained both secondary organic and inor-ganic species. This particle type is typically correlated with secondary organic aerosol as measured by other on-line tech-niques such as the aerosol mass spectrometer (Salcedo et al., 2006).
NaEC
The NaEC type is characterized by elemental carbon clus-ter ions at spacing of 12m/zunits in both the positive and negative ion spectra. This type has a dominant23Na+peak along with a smaller 39K+ in the positive ion spectrum; many of these particles also show a Li+ peak at m/z 6 and 7. In the negative ion spectra, peaks appear for Cl− (m/z−35/−37), EC cluster ions, OC, phosphate, and inor-ganic nitrogen (m/z−46 and−62) sulfur species (m/z−32, −80,−96). This particle type was most likely produced by industrial emissions and quite possibly related to incineration or refuse burning.
ECOC
The Elemental Carbon/Organic Carbon (ECOC) type is char-acterized by a positive ion mass spectrum that is dominated by clusters of carbon atoms. In addition to the major ele-mental carbon markers, smaller signals occur from OC, ni-trate, sulfate, and ammonium. In general, less OC, nini-trate, and sulfate are associated with these EC particles in the early morning during the high traffic period (Sect. 3.4.2).
High Mass OC
The high mass organic carbon class was a unique parti-cle type which was distinguishable from other OC types by the presence of hydrocarbon envelopes in the positive ions extending above 100 Da. Typically these hydrocarbon en-velopes have a1m/z=14, which is due to successive losses of a14CH2group. Although not shown in the figure, the
hy-drocarbon envelopes can extend out tom/z=200 and above. Similar high mass OC particles have been observed in foggy regions with high biomass emissions (Qin et al., 2006). The
larger particle sizes, higher molecular weight marker com-pounds, as well as the fact that they were detected at night suggest these may be processed organic biomass particles. Vanadium
Vanadium particles have been identified with other analyti-cal methods as well as single particle mass spectrometry in studies of light duty vehicle (LDV) emissions (Sodeman et al., 2005), industrial urban areas (Noble et al., 1996; Tolocka et al., 2004), and in coal and oil fired power plant emissions (Suarez et al., 2002). Particles containing vanadium produce a very unique mass spectrum with peaks at51V+and67VO+. Oxalate and vanadium were frequently internally mixed with oxalate anions detected in the negative ion mass spectrum of many vanadium particles atm/z=−89 (89C2O3OH−).
Sec-ondary sulfate and vanadium are a result of emissions from fossil fuel combustion. Oxalate may be produced by either biomass burning, or VOC oxidation followed by subsequent aqueous phase processing (Chebbi et al., 1996; Morawska et al., 2002). The fraction of the oxalic acid mass formed by cloud processing is currently a topic of research (Ervens et al., 2004; Kanakidou et al., 2005).
Nitrogen-organic carbon (NOC)
A nitrogen-containing organic carbon (NOC) particle type was detected virtually every morning during the study except during the holiday period (19–20 March). The “NOC” label is based on the large peak atm/z=58 which we hypothesize is due to an amine fragment at58C2H5NHCH+2 which has been
identified by ATOFMS and in other laboratory studies (Pitts et al., 1978; Angelino et al., 2001); and a collocated AMS instrument (Aiken et al., 2007). There is also a grouping of small ion peaks atm/z=212–215 of unknown identity on almost every NOC particle detected.
3.1.2 Dust and metallic particle types NaK
The highest fraction of supermicron particles in Mexico City had the positive ion spectrum dominated by23Na+ and/or
39K+. These particles were a combination of industrial emis-sions as well as salt particles from the Texcoco dry lake bed. A large fraction (87%) of these particles also contained ni-trate (46NO−
2 and 62NO−
3) as major peaks in the negative ion
mass spectra Significant ion signals were also present from phosphate (79PO3)−and chloride (35,37Cl−). Coarse mode
0% 20% 40% 60% 80% 100%
0.210.250.300.350.420.500.600.710.851.021.211.441.722.052.452.92
Aerodynamic Diameter (µm)
Aged Biomass Fe Dust Ca Dust AlSi Dust NaClZnPb MiscMetals NaK Amine Biomass Vanadium HMOC OC EC ECOC
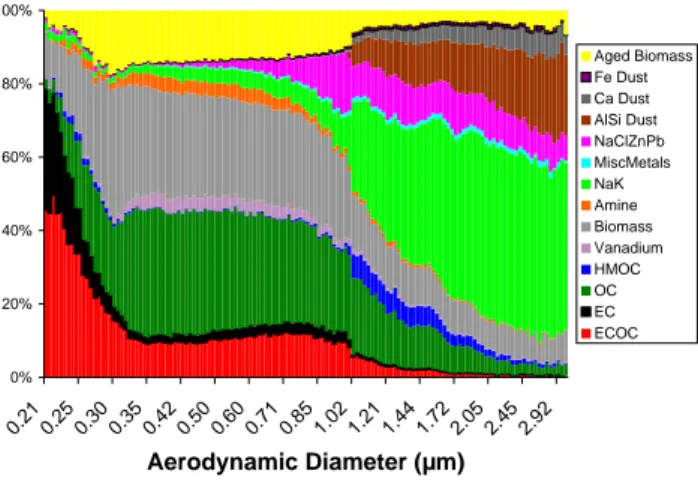
Fig. 3. Size-resolved particle classes by number percentage,
show-ing the contribution of the sshow-ingle particle types for the MCMA– 2006 campaign.
displacement chemistry is similar to previous ATOFMS ob-servations showing a strong anti-correlation between nitrate and chloride on sea salt particles (Gard et al., 1998). This heterogeneous processing of salt particles, from industry as well as from the dry lake bed, may well have a strong im-pact on the gas phase concentrations of NOx, chloride, and
other species in the Mexico City region. It will be interest-ing to compare the ATOFMS results with model predictions to test whether the models are capturing this heterogeneous chloride-nitrate chemistry.
AlSi
27Al+was frequently found to be mixed with23Na+,39K+ and35Cl−. When Al was associated with silicon markers
60SiO−
2 and 76SiO−
3, the particle was placed in the AlSi class.
The presence of these peaks suggests that the particle was composed of aluminosilicate species which are common in mineral dust. 7Li+was commonly detected in the positive ion mass spectrum of the AlSi type. Mass spectra containing an intense peak at m/z 56 with a smaller isotopic peak at m/z54 indicate the presence of56Fe+.
Ca
Atm/z=4040Ca+stands out as the largest peak in the posi-tive ion spectrum accompanied by smaller peaks atm/z=56 and 57 due to56CaO+and57CaOH+. Previous studies have described the ability of CaCO3dust to react with nitric acid
to form Ca(NO3)2(Krueger et al., 2004; Laskin et al., 2005).
It is likely that the calcium dust shown herein has undergone this heterogeneous reaction as indicated by the negative ion mass spectrum which shows intense markers for nitrite and nitrate at46NO−2 and 62NO−3. Smaller peaks occur in the positive ion spectrum atm/z24 and 27 due to Mg and Al, respectively.
NaClZnPb
In these particles, Zn is one of the largest contributors to the positive ion spectrum occurring atm/z=+64, +66, +67 and +68. Often internally mixed with Zn, Pb ions appear atm/z+206, +207, and +208. Other peaks in the positive ion spectrum include23Na+and39K+. It has been observed in other studies that Pb, Zn and Na were associated with the industrial areas in northern Mexico City (Miranda et al., 1994; Flores et al., 1999; Chow et al., 2002; Johnson et al., 2006). In addition to nitrate (46NO−2 and62NO−3), chloride (35Cl−/37Cl−) was one of the most abundant ion in the neg-ative spectra. In general, zinc and lead chlorides have rel-atively low boiling points (732◦C and 950◦C, respectively), and are emitted in the gas phase of high temperature combus-tion sources such as waste incinerators (Olmez et al., 1988; Ondov et al., 1998; Hu et al., 2003). Upon cooling, these compounds will condense into the solid phase, forming sub-micron Cl-containing particles. It should be noted that a sig-nificant number of metal rich particles also contributed to the submicron fraction, suggesting many were formed by com-bustion processes.
Other metal types
Minor particle types that account for less than 1.3% of the total particles analyzed during the study contained Cu, Fe, and miscellaneous metal-containing particles (MiscMetals). The Cu particle type typically was mixed with EC, Pb, Cl, Na and K. The MiscMetals class contained a combination of different particle types containing various elements including Mg, Mn, Ti, Cr, and Ag.
3.2 Chemically resolved particle size distributions Figure 3 presents number fractions of the size resolved chem-ical mixing state for the major particle types between 0.2 and 3µm detected with the ATOFMS during MCMA-2006. With the exception of the high mass OC type, which peaked around 1µm, carbonaceous particle types were in the submi-cron size mode, whereas the supermisubmi-cron particles consisted of inorganic dust and salt particles, a size-composition re-lationship seen in previous ATOFMS studies (Noble et al., 1996).
The ATOFMS can measure the relative degree of aging of biomass/biofuel particles using the intensity of nitrate (m/z−62) and its associated cluster ions (e.g. H(NO3)2 at
.25 .5. .75 1.0
NH4 NO2 NO3 SO3 HSO4 COOHCOO C2H3O
ECOC EC OC High Mass OC Vanadium Biomass NOC NaK Misc. Metals NaClZnPb Cu AlSi Dust Ca Dust Fe Dust
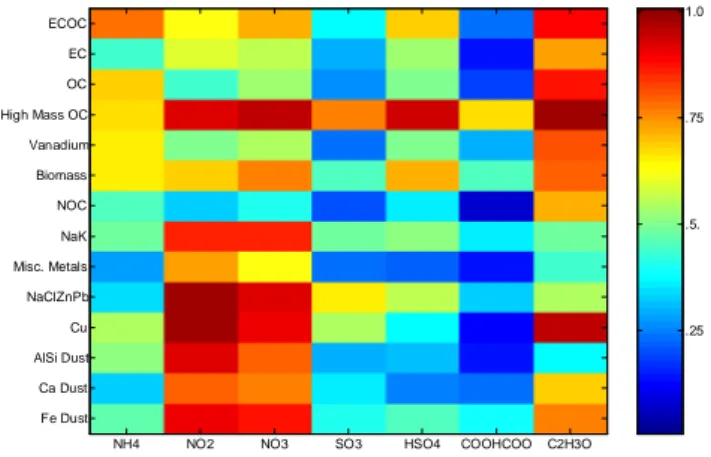
Fig. 4. Mixing state of secondary species on the various single
parti-cle types. The secondary species were identified by the peak search-ing criteria described in Table 1. The peak searches were applied to the entire dataset and then intersected with the particle classes. The color scale represents the fraction of particles within a single parti-cle type (y-axis) that contain the secondary species (x-axis).
the unscaled ATOFMS size distributions are equivalent to volume/mass distributions (Allen et al., 2000). The unscaled ATOFMS size distributions of the fresh biomass/biofuel par-ticles showed the mode peaking at∼300 nm, a value con-sistent with the volume median diameter of 250–300 nm re-ported from a number of previous studies of relatively fresh biomass emissions (Reid et al., 2005). The peak of the size distribution for the aged biomass/biofuel particles was 350 nm. This 50 nm size shift agrees with literature reports of the volume distribution of biomass/biofuel particles that have aged between 1–3 days (Reid et al., 2005). Assuming this size change was due to coating of spherical particles, the shift corresponds to a change in volume of 60% for the aged biomass particles due to the addition of ammonium, nitrate, primary and secondary organic species, as well as water. However, it should be noted that shape and density effects may also play a role in the apparent size change de-tected here. It is important to note that as the size of the biomass particles increase, a smaller mass fraction is due to the original biomass core. The more aged biomass par-ticle types showing more secondary components tended to peak in the later morning hours, tracking the more aged OC types. The fresh biomass particle signatures were detected when high wind speeds led to rapid transport from the fires, as shown in MODIS satellite images, to the site during the af-ternoon periods (see CFA back trajectory analysis discussion in Sect. 3.5).
3.3 Analysis of mixing state using the peak search method In addition to the cluster analysis presented above, a separate peak searching method was employed to highlight trends in the aerosol mixing state of the various particle types. A series
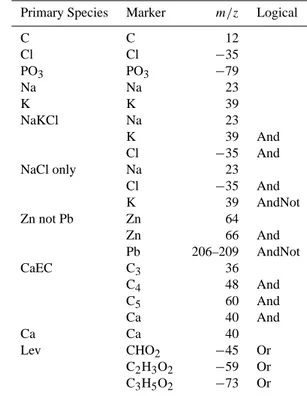
Table 1. Peak searching criteria for secondary species.
Secondary marker m/z
NH4 +18
NO2 −46
NO3 −62
SO3 −80
HSO4 −97
C2O3OH −89 C2H3O +43
of markers were selected to represent the different primary and secondary species. The mass/charge (m/z) values used for primary and secondary species are shown in Tables 1 and 2. All ion intensities were set to be greater than or equal to an absolute peak area (≥100 units) that is two times the detec-tion threshold (50 units). To determine which of the selected markers were associated with the various particle types, par-ticles with the species defined in Tables 1 and 2 were inter-sected with the major particle types derived from the ART-2a clustering analysis (Sect. 3.1). Figures 3 and 4 show the re-sults of these intersections, where the color scale represents the fraction of particles of each major type (y-axis) associ-ated with a particular marker (x-axis).
3.3.1 Mixing state of secondary species
The presence of secondary species on the various particle types (Fig. 4) provides an indication of the type of chemi-cal processes the particles have undergone in the atmosphere. The key question is: are there differences in the associations of the major secondary species (e.g. sulfate, nitrate, and am-monium) with each of the major particle types? For instance, the EC and NOC types contain the fewest particles with am-monium, nitrate, and sulfate, indicating that many of these particles were freshly emitted from locations close to T0. As these particles age through condensation and coagulation, they can accumulate other markers to become other particle types such as OC and ECOC. Ammonium is seen to be con-fined mainly to the submicron ECOC and OC types, whereas coarse mode particle types that contain NH+4 are mainly lim-ited to the AlSi and Cu types. For the AlSi type, the NH+
4
does not necessarily come from the atmosphere because it is common to find NH+4 in soils (Schlesinger et al., 1992), and therefore may not necessarily be indicative of aging in this particle type.
.25 .5. .75 1.0
C3 Cl Phos Na K NaKCl NaCl ZnCl CaEC Ca Lev ECOC
EC OC High Mass OC Vanadium Biomass Amine NaK Misc. Metals NaClZnPb Cu AlSi Dust Ca Dust Fe Dust
NOC
.25 .5. .75 1.0
C3 Cl Phos Na K NaKCl NaCl ZnCl CaEC Ca Lev ECOC
EC OC High Mass OC Vanadium Biomass Amine NaK Misc. Metals NaClZnPb Cu AlSi Dust Ca Dust Fe Dust
NOC
Fig. 5. Mixing state of primary species on the various single
parti-cle types. The primary species were identified by the peak search-ing criteria described in Table 2. The peak searches were applied to the entire dataset and then intersected with the particle classes. The color scale represents the fraction of particles within a single particle type (y-axis) that contain the primary species (x-axis).
nitrate particles, with nitrate peaking on the particles when the maximum nitrate mass concentrations were observed in the late morning. This heterogeneous displacement process is analogous to the atmospheric processing of sea salt par-ticles observed previously by ATOFMS in marine environ-ments (Gard et al., 1998).
The NaClZnPb particle types were strongly associated with nitrate (NO−
2/NO
−
3) and occurred in both the sub- and
supermicron size modes. Given that these industrial metal types were probably freshly emitted, this association sug-gests that many of these metal-chloride (i.e. PbCl, ZnCl2)
particles underwent heterogeneous displacement reactions with HNO3. The nitrate displaced the Cl originally released
in these industrial particles. This cluster groups these two particle types (i.e. fresh and aged) together. A clear time lag occurred as the amount of Cl initially present when the particles were initially detected decreased and the amount of nitrate increased in these particles later in the morning (Moffet et al., 2008). The organic carbon markers used to highlight mixing with other particle types were chosen to be 43C2H3O+ and C2O3OH− (oxalate at m/z −89). It
is apparent that43C2H3O is mainly associated with the fine
mode particles but occurs in over 40% of the supermicron particles (with the exception of the NaClZnPb type). This organic carbon likely comes from secondary oxidation reac-tions and gas-to-particle conversion of organic species. The oxalate marker is an indicator of the presence of oxalic acid. Oxalic acid may be emitted as a part of vehicle exhaust and biomass burning (Kawamura et al., 1987; Chebbi et al., 1996; Falkovich et al., 2005) but most commonly through secondary processes including photochemistry followed by
Table 2. Peak searching criteria for primary species.
Primary Species Marker m/z Logical
C C 12
Cl Cl −35
PO3 PO3 −79
Na Na 23
K K 39
NaKCl Na 23
K 39 And
Cl −35 And
NaCl only Na 23
Cl −35 And
K 39 AndNot
Zn not Pb Zn 64
Zn 66 And
Pb 206–209 AndNot
CaEC C3 36
C4 48 And
C5 60 And
Ca 40 And
Ca Ca 40
Lev CHO2 −45 Or
C2H3O2 −59 Or C3H5O2 −73 Or
condensation, fog processing or aerosol surface reactions (Kawamura et al., 1993; Faust, 1994; Blando et al., 2000; Yao et al., 2002). Oxalate is associated with biomass and vanadium types, as shown in Fig. 4, where 37% and 45% of the particles in these classes contain the oxalate marker, respectively.
3.3.2 Mixing state of primary species
Fig. 6a. Temporal variation of the submicron particle types during
MCMA-2006.
Chlorine (m/z−35 and−37) is mainly associated with in-organic particle types. This is supported by Fig. 5 which shows a strong degree of internal mixing between metals, K, Na, and Cl. Cl is also associated with the AlSi type and mod-erately associated with the NaK and Ca dust particle types. For Ca dust, there is much less Na and K associated with Cl compared to the other inorganic particle classes. A secondary source of Cl is HCl formed by heterogeneous displacement from primary particles composed of NaCl, KCl, PbCl2, or
ZnCl2 which react with acidic (i.e. HNO3or H2SO4gases.
Anthropogenic sources of HCl include coal combustion and incineration of municipal and industrial waste (Graedel et al., 1995). The source of the HCl in incineration is the com-bustible plastics, in particular polyvinyl chloride (PVC’s). The resulting gas phase HCl can then partition to other parti-cles. We have recently shown that mixing between Cl and Ca can occur through secondary uptake of HCl (Sullivan et al., 2007). This suggests that for the metals and AlSi dust, the Cl is primary but for the Ca dust, the Cl may be secondary.
Levoglucosan (m/z −45, −59, and −73) is a known marker for biomass burning aerosols. Levoglucosan is in-deed present in biomass burning particles but also in a num-ber of the other particle types. The correlation of Levoglu-cosan with AlSi Dust is most likely due to an interference of m/z=−73 with73SiO−3. This could be due coagulation be-tween biomass burning and other particle types, but it is also possible that some of the other particle types (i.e. NaK) were formed by combustion processes. At this stage, we hypothe-size that a number of the NaK and NaClZnPb types are due to refuse and paper burning which are known producers of lev-oglucosan. Finally, it is interesting to note that even though there is a general correlation in the time series of the biomass burning aerosols and levoglucosan markers, only about 50% of the biomass burning aerosols contain levoglucosan mark-ers. It has been reported recently that the amount of
levoglu-Fig. 6b. Temporal variation of the supermicron particle types during
MCMA-2006.
cosan produced depends strongly on the fuel type and burn conditions (Hedberg et al., 2006; Mazzoleni et al., 2007). Thus, the presence (or absence) of levoglucosan could be re-lated to the burn conditions (i.e. flaming vs. smoldering) or the type of fuel (i.e. grass and shrubs vs. pine trees). We plan to explore the different types of biomass/biofuel burning sin-gle particle signatures observed with the ATOFMS and de-termine whether additional insight can be gained as to other biomass/biofuel sources or conditions in a future paper.
As shown in Fig. 5, K and Na particles were present in both the coarse and fine mode particles. It is important to note that39K+ions interfere with organic ion markers (e.g.
39C
3H+3). This may explain why a large fraction of the
or-ganic carbon particles appear to contain K. However, visual inspection of these particles shows that many of the organic carbon particles also contain K, given the high relative inten-sity of the K+peak. Biomass particles are a prime example of a submicron particle type that contains K and organic car-bon as an internal mixture. These same mixtures were ob-served in TEM images acquired during aircraft flights on the Twin Otter above Mexico City (Yokelson et al., 2007)
3.4 Temporal characteristics of single particle types
The temporal characteristics of the single particle types can provide a great deal of insight into the origin of the parti-cles. In this section, the temporal profiles for sub- and super-micron particle types are described in detail. Three major events are labeled on the temporal profiles shown in Fig. 6. The first event (E1) was a large dust event where the PM10
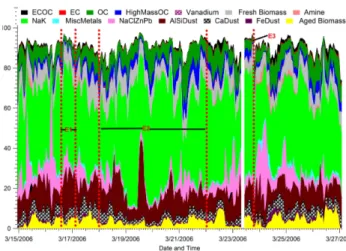
Fig. 7. Average diurnal trends of the ATOFMS number fractions.
Industrial emissions (NaClZnPb) were highest in the early morning. Contributions from OC and aged biomass particles peaked during the nighttime through the late morning hours after which the major fresh biomass fraction dominated in the afternoons when the wind speed increased, transporting particles from the location of the fires (south) directly to the sampling site at T0.
3.4.1 Time series analysis of the full study
Examining the study as a whole, major features in the overall submicron temporal trends (Fig. 6a) appear as sharp spikes of metal and nitrogen organic carbon (NOC) particles. Fre-quently the metal and NOC classes peaked in the morning, usually with relatively short spikes compared with the trends of the other particle classes (OC, biomass, etc.). When the number fractions of these particles peaked, the metal and NOC types represented up to 35 and 47% of the total num-ber of submicron particle types. These sharp time features suggest that the sources of these particles are close to the T0 site. The total PM2.5mass concentrations during these
early morning periods were typically around 50µg/m3at the La Villa RAMA site which was the closest site to T0 mak-ing PM2.5mass concentration measurements. The weekend
event (E2) showed almost non-existent contributions from the metal and NOC types, indicating these particles were produced by industrial sources. After the rain event (E3), the fractional contribution from the biomass/biofuel burn-ing decreased while the number fractions of the OC, NOC, and metal particles increased. This is not surprising as the fires in the area were greatly reduced during this rainy pe-riod (24–26 March). As expected, local sources (i.e. NOC and metal particles) dominated after the scavenging of the regional aerosols by the storms. Interestingly, the contribu-tions from fresh biomass particles became almost negligible, while some aged biomass particles were still detected, sug-gesting these were regional biomass fires being transported to the sampling site. Overall, for the period of 24–26 March, the submicron aged OC and fresh and aged biomass
parti-cle classes exhibited a relatively strong diurnal pattern which will be examined further in Sect. 3.4.2.
Figure 6b shows the temporal profiles of the major super-micron particle types. There was one particularly large dust event caused by strong winds on 16 March 2006 beginning at 16:00 CST (E1) during which the measured PM10 exceeded
1 mg/m3at the San Agustin and Xalostoc RAMA sites (near the dry lake bed Texcoco, SAG and XAL in Fig. 1) and al-most 700µg/m3 at the La Villa RAMA site closest to T0. The wind blew from these sites towards the west in the di-rection of T0. Our results show that the Na/K and Al/Si particle types dominated the chemical composition for this time period, thus indicating that the dry lake bed and fugitive dust sources nearby were major contributors to these particle types. This is consistent with the observations of Chow et al. (2002a, b), who found concentrations of Al, Si, K, and Na to be highest around the SAG and XAL sites compared to other sites around the city.
3.4.2 Average diurnal trends
The average diurnal profile for four major submicron parti-cle types (i.e. biomass, fresh biomass, NaClZnPb (industry), and OC) are shown in Fig. 7. This figure shows how the relative abundances of the different particle types observed during MILAGRO were strongly correlated with meteoro-logical patterns. In the early morning, starting at 3:30 a.m., when the wind speeds were low and coming mostly from the north, the fractional contribution of the NaClZnPb par-ticle type peaked. Between 7–11 a.m., aged OC and biomass particles were the most abundant particle types. At about 11 a.m., the wind speed increased when the wind direction shifted and started coming from the south. When this shift occurred, contributions to the submicron fraction from the particle types derived from the North (NaClZnPb) as well as the aged biomass and OC particle types decreased. Corre-lated with the shift in wind direction was an increase in the most abundant fresh biomass particle particles which were rapidly transported to the site from the south. These biomass particles most likely originated from agricultural fires in the foothills south of T0, as well as fires in the pine forests to the southeast occurred many afternoons as indicated by MODIS hot spots (Yokelson et al., 2007). It is important to note that smaller fires that were shorter in duration such as the local brush fires were often missed by MODIS satellite passes and thus hot spot data can often under-count the contributions from biomass/biofuel burning (Fast et al., 2007; Yokelson et al., 2007).
burning particles peaked in the early to mid-mornings and had extensive amounts of organic and inorganic secondary species associated with them. CFA back trajectory analysis shows that the fresh biomass particles peaked after the flow switched in the late morning 10:30–11:00 and began to come directly from the south. Relatively rapid transport brought fresh biomass particles in about 2–3 h from the locations of the fires directly to the site. This aspect will be discussed fur-ther in the following section using back trajectory and CFA analysis.
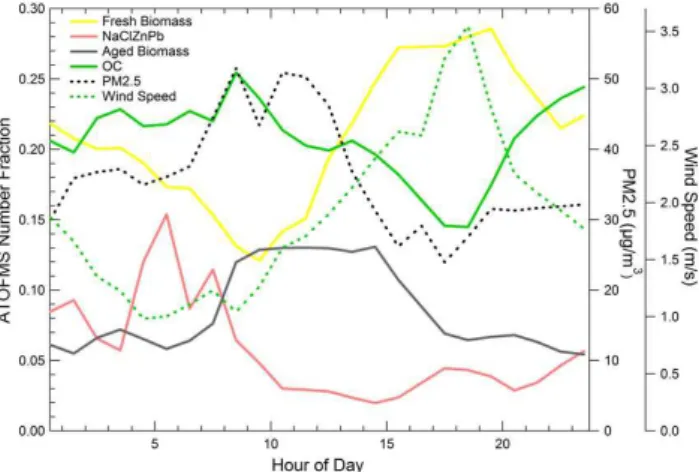
EC particles showed a bimodal diurnal temporal profile with the largest peak occurring at 7:30 a.m. and a second one occurring at 11:30 a.m. As shown in Fig. 8, the EC particles sampled during the early morning peak had smaller aerody-namic diameters (peaked at the smallest sizes detected by ATOFMS) than those sampled during the later peak (num-ber distribution mode=0.38µm). Figure 8 shows that the EC particles later in the day had larger contributions from NO−3, NH+
4, C3H3O
+, and K+. With the exception of K+, these markers are indicative of secondary photochemical process-ing. Early morning EC particles had more intensity from
12nC−
n clusters and sulfate in the negative ions as well as more
intense Na+and Ca+ion peaks in the positive ion mass spec-trum. These primary peaks suggest the EC in the mornings was coming from industry (Na+) and traffic (Ca+). Based on these observations, it can be concluded that the early morning peak of EC is comprised of more freshly emitted vehicle par-ticles. Later in the morning, the EC particles became more aged with the availability of more atmospheric oxidants. Fi-nally, the EC particles sampled later in the day had more K+ signal indicating that biomass/biofuel burning was the main source producing these late afternoon EC (soot) particles.
3.5 Back trajectory analysis
A Concentration Field Analysis (Seibert, 1994) was car-ried out using back-trajectories from the FLEXPART model (Stohl et al., 2005; Fast et al., 2006). To accomplish this, 100 stochastic particles are released from T0 every 2 h and tracked for 3 days. All the positions of the particles every hour are summed into a gridded field indicating the source region of the air mass at each release time. These gridded fields, called Residence Time Analyses, are then multiplied by the ATOFMS normalized particle counts at the release site and summed over the entire campaign. Potential source regions are highlighted by normalizing with the sum of the unscaled residence time analysis. The method was used to analyze data from the MCMA-2003 field campaign (de Foy et al., 2007). Analysis of CO data showed that the method was able to correctly identify urban emissions and analysis of SO2data identified possible impacts of the Tula industrial
complex. This analysis was performed for each of the fif-teen particle types seen during MCMA-2006; the results of this analysis are shown in Figs. 9–11. For particle types with
Fig. 8. A subtraction spectrum for EC particles peaking late in the
morning/early afternoon (9 a.m.–3 p.m.) minus particles peaking early in the morning (5–9 a.m.). This shows that early morning EC particles have less contribution from markers of secondary photo-chemistry and more markers from freshly emitted EC (sulfate, Na+,
and Ca+). Furthermore, the increase in K+later in the day suggests
a contribution from biomass burning as the major EC source.
only a few sharp peaks, a single back trajectory correspond-ing the time of highest concentration is shown.
The wind fields for the trajectories were simulated using the Weather Research and Forecast model (WRF [Skamarock et al., 2005]). Three domains were used with 50×40, 64×55 and 61×61 cells at a horizontal resolution of 36, 12 and 3 km respectively. 27 levels were used in the vertical. High reso-lution remote sensing data from the MODIS satellite sensors were used to improve the definition of the land surface in the model (de Foy et al., 2006).
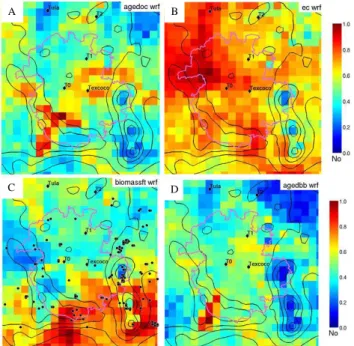
3.5.1 Spatial distribution of industrial emissions
Fig. 9. Spatial distributions of industrial emissions in Mexico City. (a) Particle back-trajectories for a release on 15 March, 08:00–
09:00 CST, for a representative nitrogen organic carbon (NOC) peak in the time series. Particle positions are plotted every hour and color indicates age. (b) Concentration field analysis for PbZn particles. High non-dimensional number (red) indicates possible source re-gion, low numbers (blue) indicate areas with low or zero emissions.
As shown in Fig. 6, the NaClPbZn class was detected from midnight to about 10:00 (CST). The concentration field analysis in Fig. 9 indicates possible source regions north of T0 for the NaClZnPb particle type. Concentrations of Pb and Zn in northern Mexico City have been historically high com-pared to other regions of Mexico City (Chow et al., 2002). There is evidence for transport of Na and Zn particles from the northern parts of the city, as Johnson et al. (2006) have shown. At the same site, Salcedo et al. (2006) noticed sharp mass concentration spikes of particulate Cl in the early morn-ing hours. In this study, we observe early mornmorn-ing spikes of chloride as well, and show that it is internally mixed with Pb, Zn, Na. Johnson et al. (2006) attributed the Na and Zn to an industrial source in their factor analysis, and Salcedo et al. hypothesized that most of the Cl was present as NH4Cl. The
results obtained herein show that the Na, Cl, and Zn are in the same particles and likely produced by local industry in the north (Fig. 5). The Cl is most likely in the form of NaCl, KCl, ZnCl2, and/or PbCl2based on the measured single
par-ticle chemistry, instead of NH4Cl as suggested previously.
For all of the metal chloride species, displacement of Cl by nitrate explains the strong association of the metal particle classes with nitrate in the late morning periods.
3.5.2 Spatial trends of carbonaceous particle types Both primary and secondary components of carbonaceous particles in Mexico City are produced by a variety of ur-ban and regional sources. Figure 10 shows the concentration field analysis for the main carbonaceous particle types. As shown in Fig. 10a, OC particles types were distributed across the basin and formed under more stagnant conditions. More stagnant conditions are conducive to the formation of more oxidized/aged species within the basin, such as those
asso-A
D C
B
Fig. 10. Spatial distributions of major submicron carbonaceous
types in Mexico City. (a) CFA of aged organic carbon particles, showing they were spatially distributed across the basin. (b) Con-centration field analysis for EC particles, showing they came mainly from the northwest and south. (c) CFA for fresh biomass particles showing these came mainly from the south when winds picked up in the afternoons. Transport in the afternoons took approximately 2 h to get from the regions of the fires to the T0 sampling site. Black dots show locations of MODIS hot spots during this week of the study. (d) Aged BB, showing a similar pattern to aged OC types, occur when winds were more stagnant and originated in the southwest. Typically, when winds came from this direction it took longer times (1–3 days) for the particles to reach T0. High non-dimensional number (red) indicates possible source regions, low numbers (blue) indicate areas with low or zero emissions.
from industrial operations. EC particles came from many directions, indicating they were produced by several sources including heavy duty vehicles, industry, and biomass burning emissions.
As shown in Fig. 10c, fresh biomass particles show a strong correlation with flow through the gap from the moun-tains to the south and southeast of the city – a region where large fires and smaller brush fires occurred (Fast et al., 2007). This type of flow usually began in the late morning (11 a.m., see Fig. 7) when the fresh biomass particles began to in-crease; this time period is also associated with vertical ad-vection and basin venting (de Foy et al., 2005, 2006; Fast et al., 2007). When the winds shifted so that they were coming from the south, lower contributions came from other types including more aged particle types as well as those from the northern city region (i.e. OC, industrial sources) which resulted in overall lower PM2.5 mass concentrations. The
majority of the PM during the afternoons came from rela-tively fresh biomass burning particles transported from the south during most periods of the study with the exception of the last three days (24–27 March) when a period of rain reduced the number of fires. The increased source strength for the biomass particles near the hillsides of the basin was associated with numerous small fires on these hills used to clear fields for the upcoming crop season. MODIS hotspots produced by the University of Maryland (UMD) Web Fire Mapper (http://maps.geog.umd.edu) are shown in Fig. 10c as black dots (Justice et al., 2002). It is important to note that the smaller brush fires were often not captured in MODIS satellite images (Fast et al., 2007). Aged biomass types originated in the southwest and appeared during the night and early morning hours when the flow was more stagnant. Based on the back trajectory analysis, particles from the southwest region were transported more slowly (1–3 days) to T0 and thus had more time to undergo aging. This was evident in the single particle mass spectra which showed more nitrate, ammonium, and oxidized organic species on the biomass types that came from this region of the city. In contrast, the fresher biomass types shown in Fig. 10b were transported by higher winds quickly to the site (2–3 h) from the south and southeast showed far less aging.
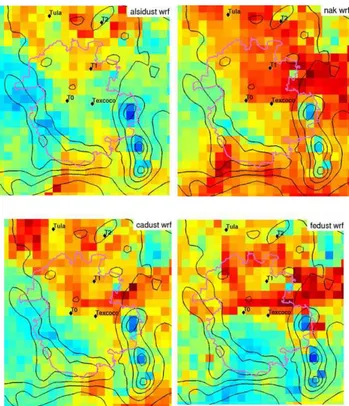
3.5.3 Spatial trends in coarse mode particle types
The concentration field analysis for the coarse (super-micron) mode particle types is shown in Fig. 11. AlSi, Ca and Fe dust all had similar spatial footprints where the high-est concentration events correlated well with flow from the northwest near the Tula region. For the Ca type, this would be consistent with the fact that the cement plants in that re-gion emit dust with high concentrations of Ca (Vega et al., 2001). The Fe particle type had slightly more influence from the northwest than did the AlSi or Ca types. The NaK particle type was significantly different from any other coarse mode particle type, showing more contributions from the east to
Fig. 11. Concentration field analysis for select coarse mode
parti-cle types. High non-dimensional number (red) indicates possible source regions, low numbers (blue) indicate areas with low or zero emissions. Texcoco is a dry lake bed expected to be a major source of coarse mode dust.
northeast. The dry lake bed Texcoco is located in the east, and has been historically correlated with large quantities of Na and K compared to the rest of Mexico City. The broad spatial pattern is consistent with the fact that the NaK type was produced by multiple sources. Based on the single par-ticle signatures, some of the NaK type parpar-ticles were mixed with soot and formed in the early morning hours. These par-ticles were formed by combustion sources in the upper north-west region of the city.
3.6 Comparison with other measurements and previous studies
MILAGRO in 2006. Stone et al. (2007) reported that biomass burning accounted for 5–30% (12 h averages) of the PM2.5
mass concentrations. A recent paper by DeCarlo et al. (2007) describes airborne measurements of the non-refractory com-ponents in PM1above Mexico City in which secondary
or-ganic aerosols and biomass burning aerosols dominate the organic aerosol (DeCarlo et al. 2007). The 2006 MILAGRO study contrasts an earlier study, MCMA-2003, where for the majority of the study, vehicles and secondary species were reported to be the most abundant sources of PM2.5(Salcedo
et al., 2006; Volkamer et al., 2006). Johnson et al. (2006) used PIXE analysis of single particles in 2003 and also noted that biomass burning made significant contributions to the re-fractory components of the aerosol during the later part of the study (Johnson et al., 2006). There are a number of possible reasons for the smaller observed influence of fires in 2003 including differences in transport conditions, meteorology, and/or the numbers of fires in the local region. MODIS hot spot data were used to estimate that major fires in the region did not impact the region until the later part of the study in 2003. However, as mentioned, MODIS hot spot do not detect shorter duration smaller fires and thus tend to serve as a lower limit for the impact of biomass/biofuel burning in a particular region. The exact contributions from biomass/biofuel burn-ing in 2003 to the non-refractory organic aerosol are still be-ing investigated usbe-ing factor analysis which subdivides the organic aerosol fraction detected with the AMS into several different factors, including a recently reported wood smoke organic factor (Alfarra et al., 2007; Lanz et al., 2007; Molina et al., 2007).
It is important to recognize that many sources of biomass/biofuel particles exist in the Mexico City region: 1) wood smoke from regional fires, 2) cooking, 3) inciner-ation, 4) agricultural fires, and 5) refuse burning. Thus, it is not surprising that biomass/biofuel particles represent such a sizeable fraction of the aerosol. In the current analysis of ATOFMS data, many of these sources are combined into the general fresh and aged biomass types, as well as the Na-ClZnPb particle types. In a future paper, the different mass spectral fingerprints will be examined in the different size ranges and compared with other measurements, models, and back trajectory analysis to gain further insights into the major biomass/biofuel sources contributing to the particulate mat-ter in Mexico City.
In addition to finding significant contributions from biomass/biofuel burning, the single particle mass spectrom-etry ATOFMS results from this study provide new insights into sources for a number of previously observed particle components including Zn and chloride (Johnson et al., 2006). In this study, high morning chloride concentrations were shown to be emitted in the form of mixed Zn, Pb, and Cl particles produced by industrial sources, possibly incinera-tion processes, in the northern region of the city. Previous speculation based on bulk chloride mass concentrations hy-pothesized the chloride was due to NH4Cl (Salcedo et al.,
2006). Salcedo et al. (2006) attributed submicron inorganic components including Al, Si, Ca, Fe, Ti, K, and Mg to soil in 2003, however this study shows significant inorganic salts, transition metals, and dust particles were also produced in the submicron size range by industrial processes. Single particle mass spectral data also provide insights into how heteroge-neous processes on inorganic salt particle types, both from the dry lake bed as well as industrial sources, convert high chloride concentrations in the early morning hours to nitrate later in the morning, showing how dust particles affect NOy
budget in Mexico City.
4 Conclusions
ATOFMS observations during MCMA-2006 provide chem-ical mixing state measurements with high temporal and size resolution. Industrial operations produced a nitrogen-containing organic (NOC) particle type as well as Pb par-ticles internally mixed with Zn and Cl. These industrial particle types peaked in the morning hours and were likely produced in the northern region of the city. Given the spa-tial and temporal characteristics of particles with the PbZnCl mixing state, these particles are the dominant source of early morning particulate phase chloride. Furthermore, these same metal particles are likely associated with the source of high Pb and Zn concentrations in the north described in previous investigations. These particles and their chemistry are the subject of another paper (Moffet et al., 2008).
The most abundant submicron particle types detected in the MCMA included biomass/biofuel, industrial, and OC particle types, whereas inorganic salt and dust particle types dominated the coarse (super-micron) mode. When the wind speeds increased and came from the south during the after-noons, the biomass/biofuel particles represented up to 76% of the number fraction of submicron particles. Knowing which particle types represent the largest number fractions of the ”seed” aerosol is extremely important to understand-ing the major primary sources impactunderstand-ing the partitionunderstand-ing of secondary species (i.e. SOA) in Mexico City.
The mixing of the different major particle types with sec-ondary species was analyzed using a peak searching method. Organic carbon was found to be on almost 50% of the coarse mode dust particles, while 45% of the biomass and 37% of the vanadium particles were associated with the oxalate ion. It was determined that 58% of the EC particles and 73% of the ECOC particles contained sulfate. This demonstrates that these freshly emitted carbonaceous particle types contained both primary and secondary inorganic components.
particles began to increase, becoming the most abundant sub-micron particle class by number fraction in the late after-noons. After 18:00 CST, OC particles started to increase in concentration while the fresh biomass particles decreased. The observed diurnal variations show the importance of me-teorology in controlling the major sources making contribu-tions to ambient PM in Mexico City. These time series for the different particle types serve as a “clock” of the sources, aging, and transport characteristics of the aerosol in the heart of the MCMA, thus providing a timescale on which measure-ments can be compared with models. To this end, these tem-poral profiles provided by the ATOFMS were used, together with meteorological modeling, to provide source regions for the major particle types.
CFA analysis combined with the ATOFMS data from this study show how submicron inorganic salt, soot, and metal types from northern industrial sources can make substantial contributions to the submicron number fraction during the early morning hours. The aged version of most particles types occurs from 10 a.m. to 12 p.m. when photochemical activity was highest. A strong contrast in sources and over-all PM concentrations is observed when the wind direction shifts and increases in speed from northerly to southerly in the late mornings. Interestingly, when the winds were weak and particles were coming from the north and/or across the basin, they tended to be more aged and the PM mass con-centrations were at their highest. When the wind speeds in-creased and the air parcels came from the south, biomass particles appeared with less signs of aging and overall lower PM2.5mass concentrations were generally observed. Given
the wind speeds and distance from T0 to the locations of the fires, it is calculated that the biomass burning particles were transported to the site in 2–3 h during the afternoons. Given the high density urban area south of T0, it is somewhat sur-prising how strongly biomass burning dominated the overall aerosol (up to 76%) when the winds became southerly. In future analyses, direct comparisons will be made between the ATOFMS and other measurements (i.e. AMS, optical measurements, emissions inventories, radiative transfer and chemical transport models) to obtain a better understanding of how the sources and aging processes impacted the overall properties of aerosols. It is especially essential to fold these observations into particle-resolved models in order to gain a better understanding of important sources and processes af-fecting the physical and chemical properties of the Mexico City aerosol (Fast et al., 2006).
Acknowledgements. This field campaign was the collaborative
effort of a large number of participants with the support of multi-national agencies. The authors would like to thank Gus-tavo Sosa, Philip Sheehy, Rainer Volkamer, Jose Luis Jimenez, and Ken Docherty for their assistance and guidance during the MCMA-2006 field study. Rene Sanchez overcame the location problems of our digitizers. Robert Osborne and Don Collins helped organize and consolidate the shipment of equipment into Mexico. Tania Perez and Ricardo Cepeda provided much needed and timely
logistical support. Rafael Ramos graciously provided gas phase and PM data from the RAMA monitoring network. We thank NSF for funding under ATM-0511803 and ATM-0528227. We thank Bob Yokelson for many useful discussions and his edits of the manuscript.
Edited by: S. Madronich
References
Aiken, A. C., DeCarlo, P. F., and Jimenez, J. L.: Elemental analysis of organic species with electron ionization high-resolution mass spectrometry, Anal. Chem., 79, 8350–8358, 2007.
Aldape, F., Flores, J., Diaz, R. V., and Crumpton, D.: Upgrading of the PIXE system at ININ (Mexico) and report on elemental composition of atmospheric aerosols from 1990 in the ZMCM, NIM-B, 109, 459–464, 1996.
Aldape, F., Flores, J., Garcia, R., and Nelson, J. W.: PIXE analysis of atmospheric aerosols from a simultaneous three site sampling during the autumn of 1993 in Mexico city, Nuclear Instruments and Methods in Physics Research Section B – Beam Interactions with Materials and Atoms, 109, 502–505, 1996.
Alfarra, M. R. Prevot,, A. S. H., Szidat, S.,Sandradewi, J., Weimer, S., Lanz, V. A., Schreiber, D., Mohr, M., and Baltensperger, U.: Identification of the mass spectral signature of organic aerosols from wood burning emissions, Environ. Sci. Technol., 41, 5770– 5777, 2007.
Allen, J. O., Fergenson, D. P., Gard, E. E., Hughes, L. S., Morrical, B. D., Kleeman, M. J., Gross, D. S., Gaelli, M. E., Prather, K. A., and Cass, G. R.: Particle detection efficiencies of aerosol time of flight mass spectrometers under ambient sampling conditions, Environ. Sci. Technol., 34, 211–217, 2000.
Angelino, S., Suess, D. T., and Prather, K. A.: Formation of aerosol particles from reactions of secondary and tertiary alkylamines: Characterization by aerosol time-of-flight mass spectrometry, Environ. Sci. Technol., 35, 3130–3138, 2001.
Arimoto, R., Kim, Y. J., Kim, Y. P., Quinn, P. K., Bates, T. S., An-derson, T. L., Gong, S., Uno, I., Chin, M., Huebert, B. J., Clarke, A. D., Shinozuka, Y., Weber, R. J., Anderson, J. R., Guazzotti, S. A., Sullivan, R. C., Sodeman, D. A., Prather, K. A., and Sokolik, I. N.: Characterization of Asian Dust during ACE-Asia, Global Planet. Change, 52(1–4), 23–56, 2006.
Baumgardner, D., Raga, G. B., and Muhlia, A.: Evidence for the formation of CCN by photochemical processes in Mexico city, Atmos. Environ., 38, 357–367, 2004.
Beddows, D. C. S., Donovan, R. J., Harrison, R. M., Heal, M. R., Kinnersley, R. P., King, M. D., Nicholson, D. H., and Thompson, K. C.: Correlations in the chemical composition of rural back-ground atmospheric aerosol in the uk determined in real time using time-of-flight mass spectrometry, J. Environ. Monitor., 6, 124–133, 2004.
Blando, J. D. and Turpin, B. J.: Secondary organic aerosol forma-tion in cloud and fog droplets: A literature evaluaforma-tion of plausi-bility, Atmos. Environ., 34, 1623–1632, 2000.
Cahill, T. A., Morales, R., and Miranda, J.: Comparative aerosol studies of Pacific rim cities – santiago, chile (1987); Mexico city, Mexico (1987–1990); and Los Angeles, USA (1973 and 1987), Atmos. Environ., 30, 747–749, 1996.
4233–4249, 1996.
Chow, J. C., Watson, J. G., Edgerton, S. A., and Vega, E.: Chemical composition of PM2.5 and PM10 in Mexico city during winter 1997, Sci. Total Environ., 287, 177–201, 2002.
Chow, J. C., Watson, J. G., Edgerton, S. A., Vega, E., and Ortiz, E.: Spatial differences in outdoor PM10 mass and aerosol composi-tion in Mexico city, J. Air Waste Manage., 52, 423–434, 2002. de Foy, B., Caetano, E., Magana, V., Zitacuaro, A., Cardenas, B.,
Retama, A., Ramos, R., Molina, L. T., and Molina, M. J.: Mexico city basin wind circulation during the MCMA-2003 field cam-paign, Atmos. Chem. Phys., 5, 2267–2288, 2005,
http://www.atmos-chem-phys.net/5/2267/2005/.
de Foy, B., Caetano, E., Maga˜na, V., Zit´acuaro, A., C´ardenas, B., Retama, A., Ramos, R., Molina, L. T., and Molina, M. J.: Mexico City basin wind circulation during the MCMA-2003 field cam-paign, Atmos. Chem. Phys., 5, 2267–2288, 2005,
http://www.atmos-chem-phys.net/5/2267/2005/.
de Foy, B., Molina, L. T., and Molina, M. J.: Satellite-derived land surface parameters for mesoscale modeling of the Mexico City basin, Atmos. Chem. Phys., 6, 1315–1330, 2006,
http://www.atmos-chem-phys.net/6/1315/2006/.
de Foy, B., Varela, J. R., Molina, L. T., and Molina, M. J.: Rapid ventilation of the Mexico City basin and regional fate of the ur-ban plume, Atmos. Chem. Phys., 6, 2321–2335, 2006,
http://www.atmos-chem-phys.net/6/2321/2006/.
de Foy, B., Lei, W., Zavala, M., Volkamer, R., Samuelsson, J., Mel-lqvist, J., Galle, B., Martnez, A.-P., Grutter, M., Retama, A., and Molina, L. T.: Modelling constraints on the emission inventory and on vertical dispersion for CO and SO2 in the Mexico City Metropolitan Area using Solar FTIR and zenith sky UV spec-troscopy, Atmos. Chem. Phys., 7, 781–801, 2007,
http://www.atmos-chem-phys.net/7/781/2007/.
DeCarlo, P. F., Dunlea, E. J., Kimmel, J. R., Aiken, A. C., Sueper, D., Crounse, J., Wennberg, P. O., Emmons, L., Shinozuka, Y., Clarke, A., Zhou, J., Tomlinson, J. D., Collins, R., Knapp, D., Weinheimer, A. J., Montzka, D. D., Campos, T., and Jimenez, J. L.: Fast airborne aerosol size and chemistry measurements with the high resolution aerosol mass spectrometer during the MILAGRO campaign, Atmos. Chem. Phys. Discuss., 7, 18 269– 18 317, 2007.
Dunn, M. J., Jim´enez, J. L., Baumgardner, D., Castro, T., Mc-Murry, P. H., and Smith, J. N. : Measurements of Mexico city nanoparticle size distributions: Observations of new par-ticle formation and growth, Geophys. Res. Let., 31, L10102, doi:10.1029/2004GL019483, 2004.
Ervens, B., Feingold, G., Frost, G. J., and Kreidenweis, S. M.: A modeling study of aqueous production of dicarboxylic acids: 1. Chemical pathways and speciated organic mass production, J. Geophys. Res., 109, D15205, doi:10.1029/2003JD004387, 2004. Falkovich, A. H., Graber, E. R., Schkolnik, G., Rudich, Y., Maen-haut, W., and Artaxo, P.: Low molecular weight organic acids in aerosol particles from Rondnia, Brazil, during the biomass-burning, transition and wet periods, Atmos. Chem. Phys., 5, 781– 797, 2005,
http://www.atmos-chem-phys.net/5/781/2005/.
Fast, J. D. and Easter, R.: A lagrangian particle dispersion model compatible with WRF, in: 7th WRF User’s Workshop, Boulder, CO, 2006.
Fast, J. D., Gustafson, W. I., Easter, R. C., Zaveri, R. A.,
Barnard,J. C., Chapman, E. G., Grell, G. A., and Peckham, S. E.: Evolution of ozone, particulates, and aerosol direct radia-tive forcing in the vicinity of Houston using a fully coupled meteorology-chemistry-aerosol model, J. Geophys. Res., 111, D21305, doi:10.1029/2005JD006721, 2006.
Fast, J. D., de Foy, B., Acevedo Rosas, F., Caetano, E., Carmichael, G., Emmons, L., McKenna, D., Mena, M., Skamarock, W., Tie, X., Coulter, R. L., Barnard, J. C., Wiedinmyer, C., and Madronich, S.: A meteorological overview of the MILAGRO field campaigns, Atmos. Chem. Phys., 7, 2233–2257, 2007, http://www.atmos-chem-phys.net/7/2233/2007/.
Faust, B. C.: Photochemistry of clouds, fogs, and aerosols, Environ. Sci. Technol., 28, A217–a222, 1994.
Flores, J., Aldape, F., Diaz, R. V., Hernandez-Mendez, B., and Garcia, R.: PIXE analysis of airborne particulate matter from Xalostoc, Mexico: Winter to summer comparison, Nuclear In-struments and Methods in Physics Research Section B – Beam Interactions with Materials and Atoms, 150, 445–449, 1999. Gard, E., Mayer, J. E., Morrical, B. D., Dienes, T., Fergenson, D.
P., and Prather, K. A.: Real-time analysis of individual atmo-spheric aerosol particles: Design and performance of a portable ATOFMS, Anal. Chem., 69, 4083–4091, 1997.
Gard, E. E., Kleeman, M. J., Gross, D. S., Hughes, L. S., Allen, J. O., Morrical, B. D., Fergenson, D. P., Dienes, T., Galli, M. E., Johnson, R. J., Cass, G. R., and Prather, K. A.: Direct observa-tion of heterogeneous chemistry in the atmosphere, Science, 279, 1184–1187, 1998.
Graedel, T. E. and Keene, W. C.: Tropospheric budget of reactive chlorine, Global Biogeochem. Cys., 9, 47–77, 1995.
Guazzotti, S. A., Suess, D. T., Coffee, K. R., Quinn, P. K., Bates, T. S., Wisthaler, A., Hansel, A., Ball, W. P., Dickerson, R. R., Neususs, C., Crutzen, P. J., and Prather, K. A.: Characteriza-tion of carbonaceous aerosols outflow from India and Arabia: Biomass/biofuel burning and fossil fuel combustion, J. Geophys. Res., 108(D15), 4485, doi:10.1029/2002JD003277, 2003. Hedberg, E. and Johansson, C.: Is levoglucosan a suitable
quantita-tive tracer for wood burning? Comparison with receptor model-ing on trace elements in lycksele, sweden, J. Air Waste Manage., 56, 1669–1678, 2006.
Hu, C. W., Chao, M. R., Wu, K. Y., Chang-Chien, G. P., Lee, W. J., Chang, L. W., and Lee, W. S.: Characterization of multiple airborne particulate metals in the surroundings of a municipal waste incinerator in taiwan, Atmos. Environ., 37, 2845–2852, 2003.
Jiang, M., Marr, L. C., Dunlea, E. J., Herndon, S. C., Jayne, J. T., Kolb, C. E., Knighton, W. B., Rogers, T. M., Zavala, M., Molina, L. T., and Molina, M. J.: Vehicle fleet emissions of black carbon, polycyclic aromatic hydrocarbons, and other pollutants measured by a mobile laboratory in Mexico City, Atmos. Chem. Phys., 5, 3377–3387, 2005,
http://www.atmos-chem-phys.net/5/3377/2005/.
Jimenez, J. C., Raga, G. B., Baumgardner, D., Castro, T., Rosas, I., Baez, A., and Morton, O.: On the composition of airborne particles influenced by emissions of the volcano popocatepetl in Mexico, Natural Hazards, 31, 21–37, 2004.