ISSN 0104-6632 Printed in Brazil
www.abeq.org.br/bjche
Vol. 22, No. 02, pp. 293 - 302, April - June, 2005
Brazilian Journal
of Chemical
Engineering
MODELING AND SIMULATION OF MILK
EMULSION DRYING IN SPRAY DRYERS
V. S. Birchal
1and M. L. Passos
1,2*1
Programa de Pós-Graduação em Engenharia Mecânica, Universidade Federal de Minas Gerais, Av. Antônio Carlos 6627, 31270-901, Belo Horizonte - MG, Brazil
E-mail: [email protected]
2
Centro de Secagem, Departamento de Engenharia Química, Universidade Federal de São Carlos, P.O. Box 676, 13565-905, São Carlos - SP, Brazil
E-mail: [email protected]
(Received; October 20, 2004 ; Accepted: March 3, 2005)
Abstract - This work aims at modeling and simulating the drying of whole milk emulsion in spray dryers. Drops and particles make up the discrete phase and are distributed into temporal compartments following their residence time in the dryer. Air is the continuous and well-mixed phase. Mass and energy balances are developed for each phase, taking into account their interactions. Constitutive equations for describing the drop swelling and drying mechanisms as well as the heat and mass transfer between particles and hot air are proposed and analyzed. A set of algebraic-differential equations is obtained and solved by specific numerical codes. Results from experiments carried out in a pilot spray dryer are used to validate the model developed and the numerical algorithm. Comparing the simulated and experimental data, it is shown that the model predicts well the individual drop-particle history inside the dryer as well as the overall outlet air-particle temperature and humidity.
Keywords: Spray dryer operation; Particle distribution; Drying model; Numerical simulation.
INTRODUCTION
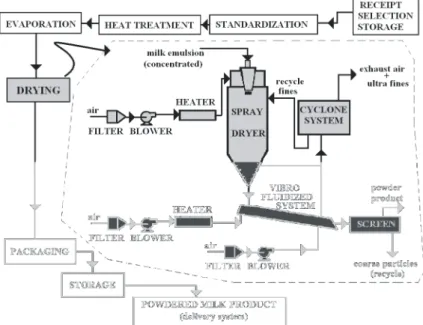
The industrial process for producing powdered milk comprises the basic steps shown in Figure 1. Receipt of raw milk from farms or cooperatives involves its inspection based on legal regulation of chemical, sensorial and bacteriological compositions. After approval in this initial control, milk emulsion is clarified in centrifugal separators or filters, cooled in heat exchangers and stored in tanks at 4°C. In the standardization step, the ratio of milk fat to total solids is adjusted, as required for the final product. Heat treatment, which includes pasteurization, sterilization and ultrahigh temperature heating, destroys pathogenic microorganisms and produces physicochemical changes in raw milk to improve its shelf life. The evaporation step, usually carried out
continuously at 40 to 70°C in a multi-effect evaporator system, increases the milk solids content from 12 % to about 50 %. The following step comprises a single-, two- or multi-stage drying, in which the concentrated milk emulsion is dried and powdered until reaching the residual moisture content required for storage and/or further application.
fraction of moisture from powdered milk occurs slowly and is costly, and the final product is fine nonagglomerated particles (30-50 µm) that do not readily disperse in water. A spray dryer attached to a vibrating fluid bed system, as shown in Figure 1, comprises the two-stage drying. In this method, agglomerates are preserved at the exit of the spray chamber and, thus, feed into the vibro-fluidized bed system where they are gently dried and cooled. Nonagglomerated particles can be recycled into the spray chamber, enhancing the quality of powdered milk by control of the particle size distribution. Three-stage drying, in which a stationary fluid bed of powdered milk is added at the conical base of the spray chamber to better control particle agglomeration and drying, is an improvement of this method. After drying and cooling, the final powdered milk product must be packaged in suitable containers and stored, when necessary, under conditions specific to its safe preservation.
Of all these steps, drying is the one in which powdered milk properties are defined. As is well-known in the literature, powdered milk and its
by-products have characteristics crucial to its acceptance and commercialization. The quality of powdered milk is greatly affected by the operational conditions of this process. Therefore, the knowledge of the spray-drying technology is essential for controlling these operational variables in order to obtain a high-quality product (King et al., 1984; Nath and Satpathy, 1998).
Based on the previous mathematical model presented by Clement et al. (1991), which focuses on Euler and Lagrange approaches for developing mass and energy balances, this work aims at modeling and simulating the drying of whole milk emulsion in spray dryers.
As shown by the results, a more detailed study of the mass transfer model and the particle residence time distribution has improved the original Clement et al. model. A new and more efficient method for the numerical model solution was implemented. Simulations allowed evaluation of model applicability, study of operational parameter sensitivity and prediction of the dryer outlet conditions at several levels of operational parameters.
Figure 1: Flow chart of powdered milk production.
MATHEMATICAL MODEL FOR DRYING MILK EMULSION IN SPRAY DRYERS
Initial Assumptions
The mathematical formulation is based on the following assumptions (Clement et al., 1991):
§ hot gas and milk suspension are continuously injected into the top of the dryer chamber at uniform rates;
§ the gas phase, formed of air and vapor, behaves as an ideal mixture and flows inside the dryer as a perfect mixture;
spherical, homogeneous and uniform drops, which are well mixed inside the chamber without interacting with one another;
§ heat flows from hot air to drops or particles and temperature gradients inside the particles are negligible;
§ the individual drying rate is described by water evaporation transfer from a single particle to the gas phase;
§ the overall drying rate is a weight sum of individual rates of all particles that remain in the dryer;
§ the drying kinetics is represented by two distinct periods: the first one, in which free water is evaporated from drops until a thin semipermeable crust is formed on the particle surface, and the second one, characterized by the thickening of this crust as predicted by the shrinking core model.
Model Development
The model comprises a set of constitutive algebraic equations that describes mass and heat transfer between gas and single particles, the drying kinetics of a single particle surrounded by gas and functions of the particle residence time distribution inside the chamber; a group of differential equations that expresses the mass and energy balances for a single particle and a continuous gas phase and a set of algebraic equations that express the overall distributed balances of particles inside the chamber.
In this work, only the main model equations are presented; complete information about the entire model is given by Birchal (2003). Constitutive algebraic equations concerned with a single particle can be summarized as
Heat and mass transfer rates per unit of the particle surface area – q and m& &v
(
g p)
q& =h T −T (1)
( )
w iff
v
g p iff
p
p
wg *
w p
P M 2D
m
T T 2D
R d f
2 kd
P P ln
P P T
= + + − − & (2) with G p k h Nu d = ; v p D k Sh d = ;
f = 0 ⇔ Wp > Wc and
f =
(
)
(
)
1 / 3
p wg p
c wg p
W W * P , T
1 W W * P , T
−
−
−
−
⇔ Wp ≤ Wc
Mean particle diameter – dp
(
)
1 / 3s 0 p
3
p p0
water
6 m W W
d d
−
= −
π ρ
⇔ Wp > Wc (3a)
(
)
1 / 3s 0 c
3
p p0
water
6 m W W
d =d − −
π ρ
⇔ Wp ≤ Wc (3b)
Mass of dry solids inside the drop – ms
(
)
3 susp p0 s 0 d m1 W 6
ρ π =
+ (4)
Equilibrium moisture content – W*
(
4)
0.621p
W* (0.109 T )= − −2.02 10 ln UR× −
(5)
where particle temperature, Tp, is expressed in K. Equations (1) and (2) respectively describe the
heat and the mass transfer between a particle and gas. For estimation of the convective heat and mass transfer coefficients, h and k, Nusselt (Nu) and Sherwood (Sh) numbers are supposed to be equal to 2, since the relative velocity between particle and gas is nearly zero. The f factor in Equation (2) represents the resistance of the crust to water vapor diffusion through it, and this value arises only in the second drying period (Wp < Wc). Right at the beginning of the first drying period, even when the particle temperature, Tp, becomes greater than the wet-bulb temperature, the drying rate is adjusted by an additional term to make the vapor pressure in the bulk air, Pwg, equal to the saturated vapor pressure at wet-bulb temperature, Pw*(TBU). This additional drying rate per particle area, m& vap, is thus included in the modified model, as shown in Equation (11).
dp0, a function of atomizer design parameters and the suspension flow rate, is estimated by the specific correlation for the rotary disc atomizer (Masters, 1985).
According to the model assumptions, in the second drying period this diameter becomes constant. The mass of dry solids inside a particle, ms, constant throughout the process, can be obtained from Equation (4). Equation (5) describes the particle equilibrium moisture content, W*, as a function of particle temperature, Tp, and relative humidity of the air, UR. This sorption curve, specific for the whole powdered milk used in this work, was obtained from experiments carried out under dynamic conditions (Birchal, 2003). This curve is also used to specify the critical particle moisture content, Wc, by making UR close to 1. Note that Wc depends on Tp because of the crust formation on the particle surface.
To determine the mass and energy balances of the particle population in the dryer (discrete phase), it is necessary to specify the effective contribution of each particle or particle group to the overall drying and heat exchange rates. This contribution is directly related to the residence time of the particle in the dryer. Hence, a detailed and clear description of the residence time distribution function is extremely important.
The residence time distribution function of particles in the dryer is expressed as a function of the cumulative fraction of particles which leaves the dryer at time t, Fc(t), or even as a function of the age distribution of these particles, E(τ/τrp), in relation to the mean particle residence time, τrp. In this work, the particle residence time distribution is based on the perfect mixture model; however, different
models for the particle residence time distribution can be easily incorporated into the model program.
Based on this assumption, particles fed into the chamber at the initial time (t = 0) are distributed along different routes in the dryer and are removed at different times, as predicted by
(
r)
rE τ τ =/ exp(−τ τ/ ) or
(6)
( )
t(
)
(
)
c rp rp
rp 0
F t = exp −τ τ d τ = −1 exp − τt τ
∫
Since particles take different routes inside the drying chamber, it is necessary to distinguish, at any operating time t, that particle fraction of ages less than or equal to t, which is removed from the dryer and that particle fraction of ages greater than to t, which is kept inside the chamber. It is also necessary to differentiate, in these fractions, the correct particle age in order to determine the water evaporation rate and the rate of heat exchanged with the gas phase. This requires combining same-age particles into n
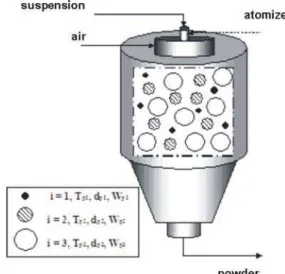
temporal compartments, which can simplify identification during the operating time, the remaining and removed fractions of particles according to age. This approach of temporal compartmentalization is justified, since in the drying model, particles of the same age have the same diameter, moisture content and temperature. Note that, in the model assumptions, drop coalescence and drop breakage are both neglected. Therefore, particles of the same age, belonging to the same temporal compartment, can be found in different spatial positions in the drying, as represented in Figure 2.
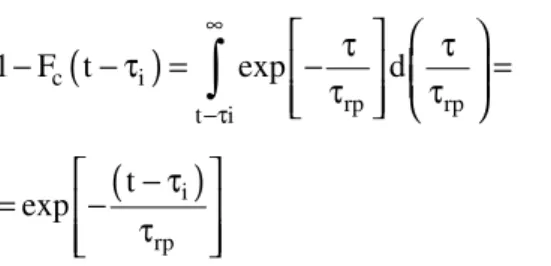
Using this approach, the disperse phase is thus supposed to be comprised of particles that are distributed into n temporal compartments by age. Under inlet condition τ = τi > 0 (i = 2 to n), the particle fraction that remains in the chamber at a time t > τi is expressed by
(
)
(
)
c i
rp rp
t i
i rp
1 F t exp d
t exp
∞
−τ
τ τ − − τ = −τ τ =
− τ
= − τ
∫
(7)
Equation (7) allows calculation of the fraction of particles of an age between τi and (τi + dτ), which remain in the dryer at operating time t. Figure 3 illustrates the model compartments corresponding to the particle age at any time t = i∆t (0 ≤ i≤n). Note that at t = (n-1)∆τ, the n compartments are all filled with particles of ages varying from 0 to τn. Moreover, at this operating time, the remaining
fraction of particles fed in at t = 0 leaves the dryer. If there is no perturbation in this dryer system, the permanent regime is established at t = n∆τ. The Np,1,j (= ∆τF/ms) compartment is composed of particles of age τ1 = 0 at t = (j -1)∆τ for 1 = j = n; Np,2,j (= r1 Np,1,j-1) by particles of age τ2 = ∆τ at t = (j -1)∆τ for 2 = j <
n; Np,3,j (= r2 Np,2,j-1) by those of age τ3 = 2∆τ at t = (j
-1)∆τ for 3 = j = n and so on consecutively until Np,n,j (= rn-1 Np,n-1,j-1) is reached at t = (n-1)∆τ. For any i
value, ri = exp (-∆τ/τrp) is constant. From this matrix scheme in Figure 3, compartments composed of particles fed into the dryer at t = 0 are on the principal diagonal (i,j = i) corresponding to Np,i,j=i. Compartments with particles fed into the dryer at t =
∆τ are located on the diagonal (i, j = i + 1), corresponding to Np,i,j=i+1 and so on successively. In each compartment, there are two outlet currents of particles: one formed by the particle fraction Np,s = (1-ri)Np,i,j that leaves the dryer at (j -1)∆τ = t = j ∆τ
and the other by the particle fraction Np,r = riNp,i,j that remains in the dryer and feeds the next time compartment, Np, i+1,j+1.
Figure 3: Compartment model representation according to particle number and age.
Moreover, this scheme, different from the one suggested by Clement et al. (1991), allows easy identification of the particle fraction that leaves the dryer at t > ∆τ. Based on this, water evaporation and the heat transfer rates can be determined during the entire operating time, since the individual mass and heat transfer rates estimated in each i of the Npi,j compartments in the j column of a given operating time, can be summed up as follows:
Overall water evaporation rate
( )
2
p v
s rp
0 t
n
2 2
p,i,j p v p v
i 1
F t
exp d m d
m
N d t m d m
∞
−τ
=
− τ
− π τ ≅
τ
≅ π = π
∫
∑
∑
&
& & (8)
( )
2 p s rp 0 t n 2 2p,i, j p p
i 1
F t
exp d q d
m
N d t q d q
∞
−τ
=
− τ
− π τ ≅
τ
≅ π = π
∫
∑
∑
&
& &
(9)
Np,i,j is the particle fraction in the i,j compartment (1 = i = n) with j = constant corresponding to a given operating time and expressed as
( )
p,i,j p,i i
i p,i 1,, j 1
s t i rp
N N t r
t F N exp m − − −τ = =
− τ = ∆τ −
τ
(10)
with τ = − ∆τi
( )
i 1 .Based on Equations (8) and (9), mass and energy balances for both solid and gas phases were developed as follows:
Mass balance for a single particle (applied to n compartments)
( )
(
)
2 p s pv v ap dW
m d t
dt
m m
− = π
+
& &
(11)
Energy balance for a single particle (applied to n compartments)
( )
(
)
(
( )
)
( )
(
)
( )
(
)
2
p s ps p pw p ref
2
pv p ref p v vap
d
d t q m C W C T t T
dt
C T t T d t m m
π = + − +
+ λ+ − π +
&
& &
(12)
Mass balance for the gas phase
(
0)
2 p v r
G Y Y d m
dY
dt G
− + π =
τ
∑
&
(13)
Energy balance for the gas phase
(
)
(
)
(
)(
)
(
)
r vg vv pwall g ref
pg 0 pv go g evap pv g p wall d
G C YC VC T T
dt
G C Y C T T
M C T T Q Q
τ + + ρ − =
= + − −
−& − −& −&
(14)
This set of balances, from Eq. (11) to (14), comprises (2n+2) differential equations.
Overall rates of mass and heat transfer between phases, the mean particle moisture content,Wp, and temperature,Tp, can thus be calculated at a given operating time, t, as
Overall heat rate supplied by gas
( )
n 2j p,i,j p,i,j
i 1
Q Q t Q N d q
=
= = =
∑
π & & & & (15)
Overall heat rate used for water evaporation
(
)(
)
n
evap evap,j pv pw p,i,j ref i 1
2 p,i,j p,i,j v
Q Q C C T T
N d m
=
= = λ+ − −
π
∑
& &
&
(16)
Overall mass transfer rate for the solid phase
( )
(
)
evap evap evap, j n
2
p,i,j p,i, j v v ap i 1
M M t M
N d m m
=
= = =
=
∑
π +& & &
& &
(17)
Mean particle moisture content in the dryer
( )
(
)
(
)
n
p,i, j i p,i,j i 1
p p , j n
i p,i, j i 1
n
p,i, j i p,i, j i 1
n
i p,i,j i 1
W 1 r N
W t W
1 r N
W r N
r N = = = = − = = = −
∑
∑
∑
∑
(18)Mean particle temperature in the dryer
( )
(
)(
)
( )
(
)
( )
p p,j
n
ps p,i,j pw p,i,j ref i p,i,j i 1
ref n
ps p,i,j pw i p,i,j i 1
T t T
C W C T T 1 r N
T
C W C 1 r N
This modified model has two adjustable parameters, which are Diff, the effective coefficient of water-vapor diffusion through the particle crust, and hwall, the overall coefficient of heat transfer between dryer walls and the ambient air. These coefficients are estimated from experimental data, as discussed later.
NUMERICAL METHOD FOR SOLVING MODEL EQUATIONS
Due to the complexity of the differential-algebraic equation system (DAE), its solution requires the use of numerical methods. Transforming this system into one of ordinary differential equations (ODE) would involve a series of algebraic operations, such as the one used by Clement et al. (1991). Besides, these authors reported serious convergence problems while simulating the beginning of the drying process. These arguments are sufficient to support the proposal of a new method to solve directly this DAE system, in which the DASSL code (Petzold, 1989) is applied. By using the backward-differential formula in each integration step, the DASSL code transforms DAE system into a set of algebraic equations, whose solution is obtained by Newton methods. The code, developed in the FORTRAN language, has been incorporated into a computational FORTRAN program, containing the initial conditions; the sequential order of equations to be solved with the corresponding code callings and the solution feedback to the program. In addition, there are specific subroutines for calculating the air,
vapor, water and drop properties as well as the equilibrium data on both phases linked to the main program.
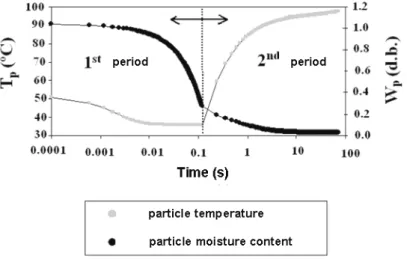
In this model solution, the convergence problem was solved by using different discretization times during the simulation. Since, in the first temporal compartment (1,1), values and tendencies of temperature and gas humidity are unknown, problems with the DASSL initialization can emerge. Besides, at the beginning of the drying process, there are fast and abrupt changes in the particle temperature and moisture content profiles. Therefore, it is necessary to implement a large number of compartments (n > 1000) in the first drying period. However, once convergence is achieved, this large number becomes unnecessary. To optimize the model solution algorithm, a time refining in the first temporal compartment is proposed, subdividing it into nr temporal subcompartments with a time interval of
∆τ/nr. Simulations have shown that setting the number of compartments at n = 500 and nr = 50 is the
minimum required to guarantee convergence. In this work, n = 600 and nr = 200 were adopted. The results,
as shown in Figure 4, are a good description of particle history inside the dryer.
To estimate the two adjustable model parameters, Diff and hwall, the weighty least square method was used to represent the residue or error function. An optimization subroutine, based on the PSO (particle swarm optimization) heuristic method (Kennedy and Eberhart, 1995) was implemented, resulting in a rapid convergence to the overall minimum of this error function. As a result, Diff was estimated as 4.1x10⁻⁹ m2/s and hwall as 7.3 W/m2K.
RESULTS AND DISCUSSION
To analyze and validate results from the model developed, experimental tests were conducted at IEN/CNEN in an APV-ANHIDRO model PSD 52 pilot spray dryer made of stainless steel with a 1 m of diameter and a 0.6 m of height (cylindrical part) and a 7.5 kg/h of evaporation capacity. Drying air at a rate of 0.041 kg/s and a humidity of 0.010 to 0.020 and whole milk emulsion with a 49% solids concentration at 51ºC are fed in concurrently, reproducing the industrial conditions of dryer operation. The atomizer is of the rotary disc type. Nine inlet conditions were tested by
combining low (-1), medium (0) and high (+1) levels of three operational variables: F, vatom and Tg0, as shown in Table 1. More details of these experiments can found in the work of Birchal (2003).
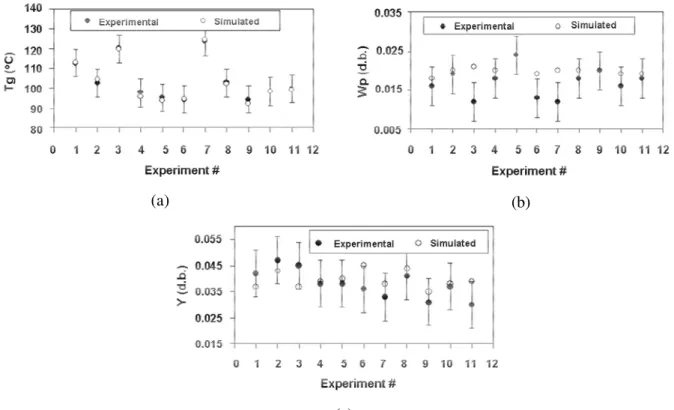
Results obtained with the model by using the computer program developed are presented in Table 2 together with experimental data, deviation and fitted error (model fit to experimental data). In figures 5-a, 5-b and 5-c, the agreement between experimental and simulated data can easily be observed. In these figures, vertical bars on the experimental data points represent the experimental error given in Table 2.
Table 1: Matrix of experiments.
Test
# Order
F (kg/h)
Tg0
(°C)
vatom
(rpm)
Level (F, Tg0, vatom)
1 10 1.4 160 42000 (-1.-1.-1)
2 5 2.4 160 42000 (+1.-1.-1)
3 11 1.4 190 42000 (-1.+1.-1)
4 7 2.4 190 42000 (+1.+1.-1)
5 8 1.4 160 50000 (-1.-1.+1)
6 3 2.4 160 50000 (+1.-1.+1)
7 1 1.4 190 50000 (-1.+1.+1)
8 9 2.4 190 50000 (+1.+1.+1)
9 6 1.9 175 46000 (0.0.0)
10 4 1.9 175 46000 (0.0.0)
11 2 1.9 175 46000 (0.0.0)
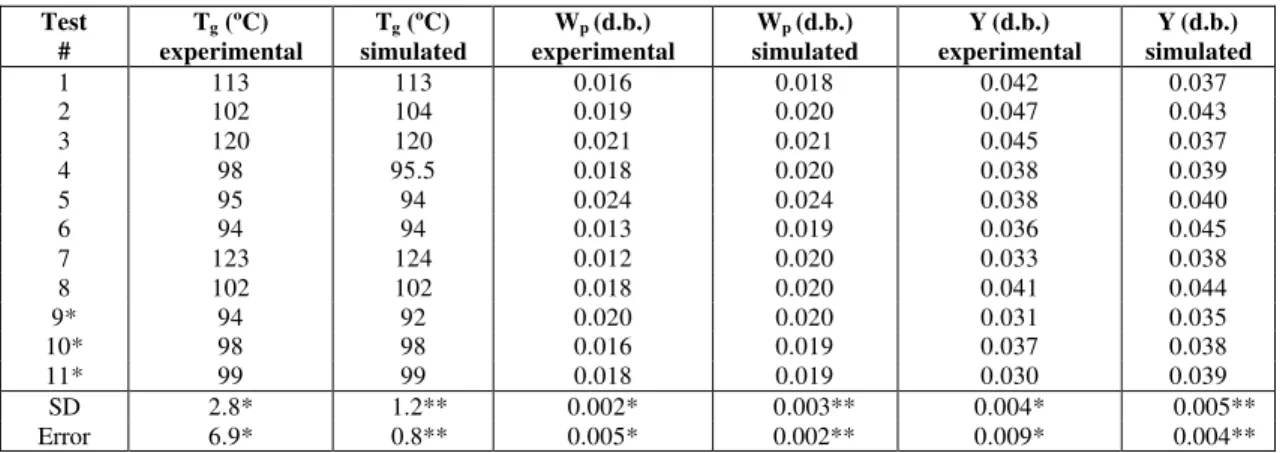
Table 2: Experimental and simulated results of the drying experiments.
Test #
Tg (ºC)
experimental
Tg (ºC)
simulated
Wp (d.b.)
experimental
Wp (d.b.)
simulated
Y(d.b.) experimental
Y(d.b.) simulated
1 113 113 0.016 0.018 0.042 0.037
2 102 104 0.019 0.020 0.047 0.043
3 120 120 0.021 0.021 0.045 0.037
4 98 95.5 0.018 0.020 0.038 0.039
5 95 94 0.024 0.024 0.038 0.040
6 94 94 0.013 0.019 0.036 0.045
7 123 124 0.012 0.020 0.033 0.038
8 102 102 0.018 0.020 0.041 0.044
9* 94 92 0.020 0.020 0.031 0.035
10* 98 98 0.016 0.019 0.037 0.038
11* 99 99 0.018 0.019 0.030 0.039
SD 2.8* 1.2** 0.002* 0.003** 0.004* 0.005**
Error 6.9* 0.8** 0.005* 0.002** 0.009* 0.004**
(*) replications at the central point, generating experimental error and standard deviation; (**) standard deviation (SD) and error for the model fitted to experimental data.
As shown in Figure 5-a, all values of Tg are predicted well by the model within the experimental uncertainty range. This variable is one of the most important in the spray drying operation, since it is an indirect measurement of solids properties, such as the outlet powder moisture content and temperature in the industrial production of powdered milk. From this, it is also possible to calculate thermal dryer efficiency and to analyze particle temperature history and possible alterations in properties of the powdered milk.
Figure 5-b indicates a larger deviation between
experimental and simulated data, which is explained by the considerable measurement errors obtained with instruments. The model predicts satisfactorily nine out of eleven data. Larger and no predictive Wp deviations obtained in experiments 3 and 7 may be related to the severe inlet conditions imposed on the milk drying (higher temperature and lower emulsion feed rate), which resulted in a burned product with a possible loss of some volatile components.
(a) (b)
(c)
Figure 5: Comparison between experimental and simulated data for a) Tg, b) Wp and c) Y.
CONCLUSIONS
Based on the results obtained in this study, the following conclusions are drawn:
§ the modified model satisfactorily describes its response variables, Tg, Wp and Y, under continuous operation;
§ although the particle residence time distribution can be improved by testing other functions, the perfect mixture approach seems to describe reasonably well particle motion inside the pilot spray dryer used in the experiments;
§ Tg, one of the most important process variables, has the lowest model predicted error;
§ Y is also predicted well; nevertheless, the associated experimental uncertainty is high due to the time required for getting trusty on-line results;
§ Wp is satisfactorily predicted by the model in the usual range of inlet air temperatures (≤ 180 ºC); however the model cannot predict the thermal degradation of powdered milk, as observed in the experiments, at a high level of inlet air temperature.
Studies are in progress to improve this modified model by designing control strategies for safely drying milk emulsion in spray dryers.
NOMENCLATURE
Cp, Cv
specific heat at constant pressure and at constant volume
J/(kg K)
dp particle diameter m or µm dp0 initial or inlet drop diameter m or µm Diff coefficient of vapor
diffusion through the particle crust
m2/s
Dv coefficient of vapor diffusion through an stagnant air layer
m2/s
E(τ/τ rp)
particle age distribution fraction
(-)
F milk emulsion dry solids flow rate
kg/s
Fc(t) cumulative fraction of particles, which leave the dryer at t
(-)
f function defined in Equation (2)
(-)
G dry air flow rate kg/s h convective heat transfer
coefficient
hwall overall coefficient of heat transfer between wall dryer and ambient air
W/(m2K)
k convective coefficient of mass transfer
m/s
kG thermal conductivity of air W/(m K) Mw molar mass of water kg/kmol ms mass of dry solids in the
drop (= constant)
kg
v
m& individual water evaporation
rate per unit of particle area
kg/(s m2)
vvap
m& additional water evaporation
rate per unit of particle area
kg/(s m2)
evap
M
&
overall water evaporation ratekg/s
Np-I,j fraction of particles in the (I,j) temporal compartment
(-)
n number of temporal compartments
(-)
P pressure Pa
Pw vapor pressure Pa
Pwg vapor pressure in the bulk air Pa Pw* equilibrium vapor pressure Pa
q& gas-particle heat transfer
between per particle area
J/(s m2)
Q
&
overall heat transfer rate J/sevap
Q& overall heat evaporation rate J/s
R ideal gas constant (= 8314) J/(kmol K)
t operating time s
T temperature °C or K
Tamb room temperature °C or K Tg air temperature °C or K Tp particle temperature °C or K Tref reference temperature ( = 273.15) K UR relative humidity of bulk air (-)
V volume m3
vatom atomization speed rotation rpm Y air humidity (dry basis) (-) Wc critical particle moisture
content (dry basis)
(-)
Wp particle moisture content (dry basis)
(-)
W0 inlet particle moisture content (dry basis)
(-)
W* equilibrium particle moisture content (dry basis)
(-)
Greek Letters
λ heat of water vaporization at Tref
J/kg
τ particle age inside the chamber
s
τrp mean particle residence time in the dryer
s
ρ density kg/m3
ρsusp milk emulsion density at inlet
kg/m3
ρwater water density kg/m
3 Dimensionless Numbers
Nu = h dp/kG (Nusselt number) (-) Sh = k dp/Dv (Sherwood number) (-)
REFERENCES
Birchal, V.S., Modelagem e simulação da secagem de leite em secadores spray. Ph.D. diss., Universidade Federal de Minas Gerais, Belo Horizonte (2003).
Clement, K.H., Hallström, A., Dich, H.C., Le, C.M., Mortensen, J. and Thomsen, H.A., On the Dynamic Behavior of Spray Dryers. Transactions Inst. of Chemical Engineers, 69, 245 (1991). Kennedy, J. and Eberhart, R.C., Particle Swarm
Optimization, International Conference on Neural Networks. Perth, Australia (1995).
King, C.J., Kieckbusch, T.G. and Greenwald, C.G., Food-Quality Factors in Spray Drying, Advances in Drying, 3, 71 (1984).
Masters, K., Spray Drying Handbook. Longman Scientific and Technical, New York (1985). Nath, S. and Satpathy, R., A Systematic Approach
for Investigation of Spray Drying Process, Drying Technology, 16, No. 6 1173 (1998).