ACPD
7, 3763–3804, 2007Lead in atmospheric particles
D. M. Murphy et al.
Title Page
Abstract Introduction
Conclusions References
Tables Figures
◭ ◮
◭ ◮
Back Close
Full Screen / Esc
Printer-friendly Version
Interactive Discussion
EGU
Atmos. Chem. Phys. Discuss., 7, 3763–3804, 2007 www.atmos-chem-phys-discuss.net/7/3763/2007/ © Author(s) 2007. This work is licensed
under a Creative Commons License.
Atmospheric Chemistry and Physics Discussions
Distribution of lead in single atmospheric
particles
D. M. Murphy1, P. K. Hudson1,2,*, D. J. Cziczo3, S. Gallavardin2, K. D. Froyd1,2,
M. V. Johnston4, A. M. Middlebrook1, M. S. Reinard4, D. S. Thomson1,2,
T. Thornberry1,2, and A. S. Wexler5
1
Earth System Research Laboratory, NOAA, Boulder, Colorado 80305, USA 2
Cooperative Institute for Research in the Environmental Sciences, Boulder, Colorado 80309, USA
3
Institute for Atmosphere and Climate Science, ETH, Zurich 8092, Switzerland 4
Department of Chemistry, University of Delaware, Newark, Delaware 19716, USA 5
Departments of Mechanical and Aeronautical Engineering, Civil and Environmental
Engineering, and Land, Air and Water Resources, University of California, Davis, CA 95616, USA
*
ACPD
7, 3763–3804, 2007Lead in atmospheric particles
D. M. Murphy et al.
Title Page
Abstract Introduction
Conclusions References
Tables Figures
◭ ◮
◭ ◮
Back Close
Full Screen / Esc
Printer-friendly Version
Interactive Discussion
EGU
Abstract
Three independent single particle mass spectrometers measured Pb in individual aerosol particles. These data provide unprecedented sensitivity and statistical signifi-cance for the measurement of Pb in single particles. This paper explores the reasons for the frequency of Pb in fine particles now that most gasoline is unleaded. Trace
5
amounts of Pb were found in 5 to 25% of 250 to 3000 nm diameter particles sampled by both aircraft and surface instruments in the eastern and western United States. Over 5% of particles at a mountain site in Switzerland contained Pb. Particles smaller than 100 nm with high Pb content were also observed by an instrument that was only operated in urban areas. Lead was found on all types of particles, including Pb present
10
on biomass burning particles from remote fires. Less common particles with high Pb contents contributed a majority of the total amount of Pb. Single particles with high Pb content often also contained alkali metals, Zn, Cu, Sn, As, and Sb. The association of Pb with Zn and other metals is also found in IMPROVE network filter data from surface sites. Sources of airborne Pb in the United States are reviewed for consistency with
15
these data. The frequent appearance of trace Pb is consistent with widespread emis-sions of fine Pb particles from combustion sources followed by coagulation with larger particles during long-range transport. Industrial sources that directly emit Pb-rich par-ticles also contribute to the observations. Clean regions of the western United States show some transport of Pb from Asia but most Pb over the United States comes from
20
North American sources. Resuspension of Pb from soil contaminated by the years of leaded gasoline was not directly apparent.
1 Introduction
Lead (Pb) is a highly toxic metal with wide industrial uses. There was widespread lead pollution during the last century and even extending back to ancient civilizations.
25
un-ACPD
7, 3763–3804, 2007Lead in atmospheric particles
D. M. Murphy et al.
Title Page
Abstract Introduction
Conclusions References
Tables Figures
◭ ◮
◭ ◮
Back Close
Full Screen / Esc
Printer-friendly Version
Interactive Discussion
EGU
contaminated with Pb (Shotyk and Le Roux, 2005). There is extensive literature on lead pollution and on airborne lead in particular. The nearly worldwide elimination of leaded gasoline has drastically changed the sources and fluxes of Pb. For example, airborne lead in the United States has decreased by a factor of 20 or more since 1980 (EPA, 2003). Airborne Pb in Shanghai dropped from about 500 to 200 ng m−3 after
5
the phaseout of leaded gasoline there (Tan et al., 2006). The progression from the years of leaded gasoline can also be measured using isotopic signatures (e.g. Widory et al., 2004). Therefore, much of the older literature on airborne Pb is (fortunately) not very relevant to today’s atmosphere. Despite the large decreases in emissions, there are still substantial sources of Pb pollution. For example, the flux of Pb to the arctic
10
is still dominated by anthropogenic inputs (Shotyk et al., 2005). Airborne Pb concen-trations can still exceed 1µg m−3 near point sources such as the Doe Run smelter in Herculaneum, Missouri.
Lead and its common sulfur and oxygen compounds are solids at room temperature. Therefore, airborne Pb is predominately particulate, with at most a few percent present
15
as gas phase alkyl compounds (Wang et al., 1997; Shotyk and Le Roux, 2005). In most places most of the Pb is on particles smaller than 1µm diameter. This was the case in Ghent, Belgium (Maenhaut et al., 2002), Budapest, Hungary (Salma et al., 2002), Gosan, Korea (Han et al., 2005), and Seville, Spain (Alvarez et al., 2004), with somewhat larger sizes recorded in Mumbai (Gokhale and Patil, 2004). A
multi-20
stage impactor in Atlanta recorded the highest Pb concentrations on stage 8, which samples below 100 nm (Solomon et al., 2003). An exception appears to be Zurich, where the majority of Pb was in particles larger than 2.5µm (Bukowiecki et al., 2005). An interesting progression was observed in the Los Angeles area. Lead was mostly in particles smaller than 350 nm in an industrial area in western Los Angeles but had
25
ACPD
7, 3763–3804, 2007Lead in atmospheric particles
D. M. Murphy et al.
Title Page
Abstract Introduction
Conclusions References
Tables Figures
◭ ◮
◭ ◮
Back Close
Full Screen / Esc
Printer-friendly Version
Interactive Discussion
EGU
The above size distributions were generally obtained with multi-stage impactors that respond to the aerodynamic diameter of the particles. For particles much larger than the mean free path in air, the aerodynamic diameter is proportional to the square root of the density. For particles much smaller than the mean free path in air, the vacuum aerodynamic diameter is proportional to density. As will be shown below, Pb in
sub-5
micrometer particles is present both as small amounts on a large number of particles and a few particles rich in Pb. Because of the high density of Pb and its compounds (usually >6 g cm−3) as well as other metals usually associated with Pb, those parti-cles rich in Pb will usually have geometric diameters considerably smaller than their aerodynamic diameters.
10
Figure 1 shows some broad categories combined from more specific point sources in a preliminary 2002 United States Environmental Protection Agency (EPA) National Emissions Inventory. Area and aviation (non-road) emissions were taken from the 1999 county summary inventory because they were not yet available in the preliminary 2002 inventory. About the top 50 point sources were manually checked against the EPA Toxic
15
Release Inventory. In many cases the Toxic Release Inventory was more plausible. For example, the largest source in the preliminary 2002 point source inventory is a small foundry (90 employees) with listed air emissions of 115000 kg per year in the point source inventory and 5 kg per year in the Toxic Release Inventory. The largest point source in the United States, the Doe Run lead smelter, was listed as about 24 kg per
20
year of airborne emissions in the point source inventory and over 45 000 kg per year in the Toxic Release Inventory. Making corrections such as this resulted in a net reduction of about one third in total emissions. Many errors probably remain. In particular, large emissions near Cleveland come from area sources that are difficult to explain. It is also not clear why the major cities in California have much larger area emissions than other
25
ACPD
7, 3763–3804, 2007Lead in atmospheric particles
D. M. Murphy et al.
Title Page
Abstract Introduction
Conclusions References
Tables Figures
◭ ◮
◭ ◮
Back Close
Full Screen / Esc
Printer-friendly Version
Interactive Discussion
EGU
from fuels, make significant contributions to airborne Pb. Smelters, foundries, and coal combustion all also emit significant amounts of Pb and other trace metals. Combustion often generates small particles with relatively volatile metals partitioning to the small particles whereas refractory elements such as silicon partition to larger particles (Fla-gan and Taylor, 1981).
5
About 1×10¹²kg of coal were burned in the U.S. in 2004 (F. Freme, U.S. Energy Information Administration, U.S. Coal Supply and Demand: 2004 Review;http://tonto.
eia.doe.gov/FTPROOT/features/feature04.pdf). Coal often contains 5 to 35 parts per million (ppm) of Pb (Raask, 1985; Linak and Wendt, 1993). Using 20 ppm, there is about 20 000 tons per year of Pb in the coal burned in the United States. The
10
EPA emissions inventory estimates that about 1% of this is emitted to the air. The volatility of Pb and its compounds such as PbO lead to its concentration in the sub-micrometer fraction of particles emitted from coal combustion and incineration (Davison et al., 1974; Linak and Wendt, 1993). Sub-micrometer particles are less efficiently removed by particulate emission control devices than larger particles. Hence a larger
15
fraction could actually be emitted. Given the large amount of Pb in coal (Table 1), the airborne fraction of Pb from coal is crucial to the budget of atmospheric Pb.
Lead is also emitted by combustion of liquid fuels containing trace amounts of Pb. Such sources would be widely dispersed and produce fine particles. Table 1 shows an analysis of the Pb mass budget of several fuels in the United States. The Pb content
20
of fuels varies widely and for some fuels there are only one or two samples in the open literature. Trace metals are mostly in the asphaltenic fraction of crude oil (Dreyfus et al., 2005). The refining process concentrates metals into the heavy fractions such as heavy oil, asphalt, and coke, whereas gasoline and light fuels contain less Pb than crude oil. On a mass basis, therefore, the combustion of residual oils may be a significant source
25
ACPD
7, 3763–3804, 2007Lead in atmospheric particles
D. M. Murphy et al.
Title Page
Abstract Introduction
Conclusions References
Tables Figures
◭ ◮
◭ ◮
Back Close
Full Screen / Esc
Printer-friendly Version
Interactive Discussion
EGU
The importance of industrial and coal combustion sources to present-day emissions of Pb has been shown by the correlation with other elements. Several other metals, including Zn, are also present in trace amounts in coal and other fuels and have similar volatility and condensation processes in hot exhaust gases. Lead was correlated with Zn in the northern Pacific (Narita et al., 1999). In Detroit, Pb was correlated with As
5
and Se, suggesting a fossil fuel combustion source (Utsunomiya et al., 2004).
Figure 3 shows selected data from the Interagency Monitoring of Protected Visual Environments (IMPROVE) network of sampling sites (Malm et al., 1994). Data through 2004 are available at http://vista.cira.colostate.edu/improve/Data/data.htm. Absolute amounts of Pb are much higher in the eastern United States than the western United
10
States. The geographic distribution, with elevated concentrations at sites in Illinois, Ohio, and Pennsylvania, is reasonably consistent with the emissions pattern (Fig. 2). As discussed later, IMPROVE sites in the western US have a springtime maximum that is probably due to transport from Asia (see also Dr. Kenneth Rahn’s web site
http://karws.gso.uri.edu/IMPROVE/Pbpage.html). The eastern sites either have little
15
seasonal pattern or a winter maximum. The origin of this winter maximum is not clear, especially since there is less general aviation in winter than in summer.
The lower panel of Fig. 3 shows the ratio of Pb to Zn at the same sites. The ratios for the central and eastern United States are quite consistently between 0.3 and 0.4. For comparison, the Pb/Zn ratio in aviation gasoline is very large, emissions from major
20
smelters range between about 0.01 and 5, in bulk coal the ratio is 0.1 to 0.75 (Raask, 1985; Linak and Wendt, 1993), and in used motor oil it is about 0.04 (Boughton and Horvath, 2004). The sites in the western United States show a range between the eastern U.S. and values near 0.7. These higher ratios are discussed later in the context of transport from Asia.
ACPD
7, 3763–3804, 2007Lead in atmospheric particles
D. M. Murphy et al.
Title Page
Abstract Introduction
Conclusions References
Tables Figures
◭ ◮
◭ ◮
Back Close
Full Screen / Esc
Printer-friendly Version
Interactive Discussion
EGU
2 Methods
This paper examines the distribution of Pb in single particles. The use of on-line laser ionization mass spectrometers provides high sensitivity along with data on hundreds of thousands of particles.
Most of the data shown here are from the Particle Analysis by Laser Mass
Spectrom-5
etry (PALMS) instrument (Thomson et al., 2000). Air containing particles is brought through a vacuum interface. Particles that cross a continuous laser beam scatter light to trigger a pulsed 193 nm laser. The light pulse hits a particle and a complete mass spectrum is recorded using a time-of-flight mass spectrometer. Only particles larger than about 200 nm are detected. The most important consequence here is that fresh
10
combustion particles are often not measured. Only positive ion spectra are considered in this paper since Pb produces only positive ions.
Data are shown from the PALMS instrument during four field campaigns. In 1999, the instrument was at the EPA Supersite in Atlanta. In 2002 and 2004, the instrument was flown on the NOAA P-3 aircraft. In spring 2002 the aircraft was based in Monterey,
15
California and the data include flights both over the ocean and over land. One flight was dedicated to sampling the greater Los Angeles urban area. In summer 2004 the aircraft was based in Portsmouth, New Hampshire and flights were made over the eastern United States and Canada and nearby ocean. These flights included passes through the plumes from urban areas and major power plants. Some data are also
20
included from descents into Houston made when the instrument was on the WB57F aircraft in 2006. An overview of the overall particle chemistry observed during these missions is given in Murphy et al. (2006).
Between 1999 and 2004, a number of pertinent changes were made to the PALMS instrument. The instrument in Atlanta was a separate instrument from the aircraft
ver-25
ACPD
7, 3763–3804, 2007Lead in atmospheric particles
D. M. Murphy et al.
Title Page
Abstract Introduction
Conclusions References
Tables Figures
◭ ◮
◭ ◮
Back Close
Full Screen / Esc
Printer-friendly Version
Interactive Discussion
EGU
aircraft instrument to about a factor of two worse than the ground instrument. Further-more, the instrument in the 2002 flights was tuned for minimum background instead of maximum sensitivity, with an additional ion loss of perhaps a factor of five. The 2004 and later data include the aerodynamic diameter of most of the particles. These aero-dynamic diameters are measured at a pressure where the mean free path is larger
5
than the particles, leading to a linear rather than square root dependence on particle density.
The Aerosol Time of Flight Mass Spectrometer (ATOFMS) is a commercially avail-able instrument (Model 3800, TSI, Shoreview, MN) described by Gard et al. (1997). The operating principles of this instrument are much the same as for PALMS. Particles
10
and gas enter the instrument through an aerodynamic lens optimized for diameters between 300 and 1000 nm. Gas-phase molecules are then removed via differential pumping stages. Particle transmission falls offto either side of these limits such that no particles were observed smaller than 250 nm or larger than 2500 nm during these studies. Particles are detected and optically sized using dual continuous lasers. Unlike
15
the PALMS instrument, aerosol ablation and ionization is accomplished with a pulsed 266 nm laser. Dual time-of-flight tubes allow for both positive and negative mass spec-tra being recorded for each particle. While Pb is only observed as a positive ion, associations with negative ions can thus be made.
An ATOFMS was deployed to the Jungfraujoch Research Station for the first two
20
weeks of March 2006 as part of the Fifth Cloud and Aerosol Characterization Experi-ment in the Free Troposphere (CLACE 5). Located in the Swiss Alps at 3580 meters above sea level, the Jungfraujoch allows access to mid-tropospheric air with minimal local aerosol sources (Baltensperger et al., 1997). As such, the data presented here are probably most comparable to the PALMS aircraft data. The focus of the deployment
25
sub-ACPD
7, 3763–3804, 2007Lead in atmospheric particles
D. M. Murphy et al.
Title Page
Abstract Introduction
Conclusions References
Tables Figures
◭ ◮
◭ ◮
Back Close
Full Screen / Esc
Printer-friendly Version
Interactive Discussion
EGU
set that nucleated ice. An ‘interstitial inlet’ with a 2.5 micrometer cutpoint was used for sampling. When clouds were not present the background aerosol was sampled in the same manner and through the same inlet. The data described here are restricted to unactivated particles during cloud free periods.
The Rapid Single particle Mass Spectrometer (RSMS) performs size-selective
sin-5
gle particle analysis between about 30 and 1200 nm diameter. Particles are drawn into the instrument through a size selective inlet (Mallina et al., 2000). The vacuum aero-dynamic diameter of particles transmitted to the mass spectrometer source region is determined by the pressure at a critical orifice. The pressure is set by a flow-limiting ori-fice located upstream of the critical oriori-fice. A valve switches between a bank of oriori-fices
10
to allow rapid changing of the selected particle size. Single particle measurements at the selected size are performed by free-firing a pulsed 193 nm laser beam through the source region.
Since the particle size is actively selected and the laser is free-fired, single particle mass spectra can be obtained for particle sizes below the minimum size that can be
15
detected by light scattering. The disadvantage, though, is that the analysis rate for par-ticles large enough to be detected by light scattering is lower for RSMS than PALMS or the ATOFMS. To help compensate for the low analysis rate, the mass analyzer in the RSMS instrument contains an elongated source region, linear flight tube and collinear geometry between the particle and laser beams to maximize the interaction region
be-20
tween the laser and particle beams. The linear flight tube yields lower mass resolution than a reflectron design. Further discussion of particle analysis by RSMS is given by Lake et al. (2003).
Data from five RSMS measurement campaigns are discussed including August 1999 in Atlanta, Georgia (Rhoads et al., 2003), August–September 2000 in Houston, Texas
25
(Phares et al., 2003), September 2002–August 2003 in Pittsburgh, Pennsylvania (Bein et al., 2005), March-December 2003 in Baltimore, Maryland (Tolocka et al., 2005), and May 2005–February 2006 in Wilmington, Delaware (Reinard et al., 20071). Single
1
ACPD
7, 3763–3804, 2007Lead in atmospheric particles
D. M. Murphy et al.
Title Page
Abstract Introduction
Conclusions References
Tables Figures
◭ ◮
◭ ◮
Back Close
Full Screen / Esc
Printer-friendly Version
Interactive Discussion
EGU
particle measurements were supplemented at each of the measurement sites with concurrent meteorology data and various gas phase and particulate concentrations.
Although isotopic information on Pb would be useful in constraining sources, the time-of-flight mass spectrometers used in all three instruments are not designed for isotopic analysis. Space charge effects and the high energy imparted by laser
ioniza-5
tion mean that the Pb peaks are often not sufficiently well resolved for the very accurate peak integrations required for isotopic analysis.
3 Results
3.1 PALMS
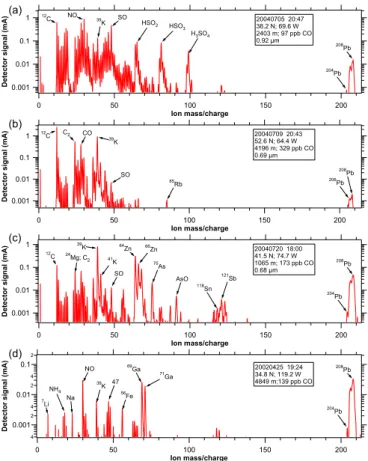
Lead was present both as a small signal in the mass spectra of many particles and as
10
a large signal in a few mass spectra. Figure 4 shows some mass spectra of particles with Pb. Besides the Mg, K, Zn, As, Sn, and Sb shown (Fig. 4c), Cu and Fe were also common in Pb-rich particles, with occasional Li, Mn, and Ba. The gallium shown in Fig. 4d was found in 7 spectra, of which 6 were west of or near the California coast.
Figure 5 presents histograms of the frequency of different size peaks at a mass to
15
charge ratio of 208, which is almost always208Pb. There are few other ions with the same masses as Pb. Because the Pb peaks at mass to charge ratios of 206 and 207 were not always well resolved, only mass 208 is used in Fig. 5 as a measure of Pb. Except for very small Pb signals for which the frequency depends on the varying detection limit, the histograms for Atlanta and aircraft flights over the eastern U.S. are
20
very similar. This is consistent with a regional source in Atlanta without any obvious dependence on wind direction (Lee et al., 2002). The data for the western U.S. show relatively higher concentrations for particles with moderate amounts of Pb.
The data sorted by portion of the western U.S. (Fig. 5b) provide some insight into the relatively higher concentrations. The Los Angeles area had slightly less frequent Pb
25
ACPD
7, 3763–3804, 2007Lead in atmospheric particles
D. M. Murphy et al.
Title Page
Abstract Introduction
Conclusions References
Tables Figures
◭ ◮
◭ ◮
Back Close
Full Screen / Esc
Printer-friendly Version
Interactive Discussion
EGU
concentration in Los Angeles is much larger than offshore, so there was more Pb on an absolute basis. The relative concentrations were lower because of dilution by ammonium nitrate and other abundant species. Figure 5b also shows data from 2004 sorted by vacuum aerodynamic diameter. The larger particles were more likely to have large Pb signals. Note that a particle large enough to be detected optically (larger
5
than 200 or 300 nm) with a high lead content is likely to have a vacuum aerodynamic diameter greater than 1µm. There was almost no size dependence to the frequency of particles with smaller Pb content.
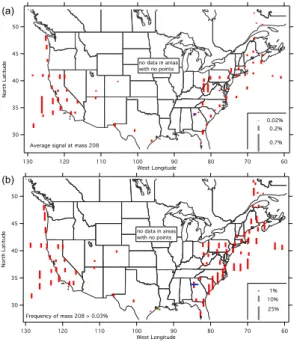
Figure 6 shows the geographic distribution of the average208Pb signal and the fre-quency with which208Pb was more than 0.03% (the limit of consistent detection) of the
10
ion current in each mass spectrum. The average signal is affected by those particles with high Pb content, such as 4c and 4d. In interpreting the average 208Pb signal it must be remembered that this is a relative measure. Considering the total amount of aerosol present, the absolute concentrations of Pb are higher in the northeastern United States than offthe California coast.
15
The maximum off California is discussed below under Asian transport. The other maximum in the average Pb signal was in the Ohio River valley. The airplane spent some time there intentionally flying through power plant plumes. However, on a fine scale the average Pb in the mass spectra were only weakly positively correlated with gas phase measurements of SO2and the frequency of Pb was uncorrelated with SO2,
20
so it is unclear if this maximum is due to power plant plumes or other emissions in this industrialized region. Many of the Pb-rich particles also contained Zn, as in Fig. 4c.
The frequency of particles with measurable Pb was more uniform than the average signal. About 10% of all particles sampled above North America contained measurable Pb. Since many mass spectra had Pb signals near the detection limit (Fig. 4a), it is likely
25
cal-ACPD
7, 3763–3804, 2007Lead in atmospheric particles
D. M. Murphy et al.
Title Page
Abstract Introduction
Conclusions References
Tables Figures
◭ ◮
◭ ◮
Back Close
Full Screen / Esc
Printer-friendly Version
Interactive Discussion
EGU
culated by the FLEXPART back trajectory model (Stohl et al., 2005) shows a significant contribution from large source regions in Arizona, Arkansas and southern Illinois and Missouri (Figs. 2 and supplemental materialhttp://www.atmos-chem-phys-discuss.net/
7/3763/2007/acpd-7-3763-2007-supplement.pdf).
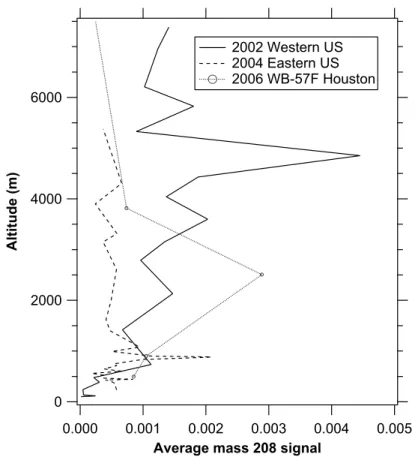
The vertical profiles of the average 208Pb signal had little structure (Fig. 7). The
5
decrease in the 2002 data near the surface is caused almost entirely by flight legs in the marine boundary layer west of California. Sea salt particles in the marine boundary layer contained almost no Pb, reducing its relative concentration. The peak in the 2002 data at just under 5 km is due to the influence of the flight leg that produced the large point on Fig. 6 offthe coast of California near 36◦N. Vertical profiles of the frequency
10
of particles containing Pb also had little structure.
3.2 Results: ATOFMS
During the CLACE 5 campaign conducted at the Jungfraujoch Research Station, about 5% of the analyzed aerosol particles were identified as containing lead. Lead was iden-tified if the signal at the dominant isotope,208Pb, was larger than an arbitrary threshold
15
set at twice the level of the spectra noise. This threshold value represented about 0.05% of the total signal in an average spectrum. At this level only the208Pb isotope was identifiable. Other isotopes (206Pb and 207Pb at 24.1% and 22.1% respectively) became apparent when the relative208Pb signal was greater than about 0.25%. In no case was the204Pb isotope (1.4%) clearly identified. As is the case for the PALMS
20
measurements, the 5% of spectra with Pb likely represents a lower limit of the fraction of particles that contained lead since detection appears limited by signal.
Of the particles that had detectable lead, 25% had a relative signal greater than 5% of the total spectrum. A typical example of such a “high lead” particle is shown in Fig. 8a. Whereas spectra for typical ambient aerosols predominantly contained sulfate
25
potas-ACPD
7, 3763–3804, 2007Lead in atmospheric particles
D. M. Murphy et al.
Title Page
Abstract Introduction
Conclusions References
Tables Figures
◭ ◮
◭ ◮
Back Close
Full Screen / Esc
Printer-friendly Version
Interactive Discussion
EGU
sium which is commonly associated with biomass burning and was found in about 40% of the positive spectra (Hudson et al., 2004). Sulfate fragments were present in 99% of the negative spectra associated with high Pb particles and 50% also contained NO− 2
and NO−3. Approximately 80% contained positive and/or negative polarity organic frag-ments. The average aerodynamic diameter of the Pb-rich particles was larger than the
5
background aerosol, which had a peak at 350 nm. Instead, the size distribution for high lead particles peaked at 500 nm and none were observed with a diameter less than 300 nm. If the Pb-rich particles had high density then this means that most probable size was near or below the size limit of detection in ATOFMS.
The spectra of “low lead” particles, one of which is shown in Fig. 8b, were much more
10
varied. About 40% contained the aforementioned metals as well as Ga+, Ge+and Sn+. The remainder appeared in spectra that were otherwise indistinguishable from those typically observed (i.e., sulfate and organics fragments commonly with K+and nitrates). In addition, the aerodynamic diameters of the low lead particles were indistinguishable from that of the background aerosol. Lead was found down to the smallest detected
15
particles, about 250 nm. It is worth mentioning that Pb was not found on any of the elemental carbon particles, about 4% of the total number.
3.3 Results: RSMS
Single particle measurements made by the RSMS instrument in five eastern US cities show that Pb is ubiquitous in the urban environment and provide insight into possible
20
sources. These measurements were made across a size range of about 30 to 1200 nm in vacuum aerodynamic diameter. The size range differed slightly for the different mea-surement sites.
The fraction of particles analyzed by RSMS that contained measurable Pb ranged from about 0.5% in Atlanta (Rhoads et al., 2003) and Houston (Phares et al., 2003) to
25
ACPD
7, 3763–3804, 2007Lead in atmospheric particles
D. M. Murphy et al.
Title Page
Abstract Introduction
Conclusions References
Tables Figures
◭ ◮
◭ ◮
Back Close
Full Screen / Esc
Printer-friendly Version
Interactive Discussion
EGU
because the dynamic range of signal intensity measurement is lower for RSMS than PALMS. Therefore, it is probable that trace levels of Pb in many particles were not detected with RSMS. In the RSMS measurements, particles containing Pb were often detected in “bursts” that often correlated strongly with wind direction and the presence of other metals, consistent with point source plumes that passed over the measurement
5
site. Plots of dN/dlogdva vs. dva typically reached a maximum around 200 nm with a peak value of 10–100 cm−3Pb-containing particles averaged over an extended period of time (Tolocka et al., 2004).
An example of Pb in urban aerosol is shown in Fig. 9 for RSMS measurements in 2005 at Wilmington, Delaware (Reinard et al., 20071). Two main classes of particles
10
containing Pb were found in the dataset. The first, shown in Fig. 9a, shows K and Pb as dominant features in the mass spectrum. Other ions suggest the presence of Na, elemental carbon, organic carbon and possibly amines. This particle class encompassed about 1% of the particles analyzed. The number concentration reached a maximum around 200 nm although many particles were observed at the smallest
15
size analyzed in this experiment (50 nm). It should be noted that these are vacuum aerodynamic diameters and the physical diameters are likely to be a factor of 4 or more smaller depending on composition and density. This means that most of the Pb-rich particles measured by RSMS would be too small for detection by PALMS or ATOFMS. The wind rose plot for this particle class is diffuse, which suggests multiple sources. In
20
general, industrial sites (steel processing, manufacturing, power generation, refining) are located from the northeast to the southwest of the site, while residential and traffic (Interstate 95) sources are prevalent in the north and west.
A second, minor class is shown in Fig. 9b, which encompassed about 0.1% of the particles analyzed. Dominant features in the mass spectrum include Na, K, Zn, and
25
di-ACPD
7, 3763–3804, 2007Lead in atmospheric particles
D. M. Murphy et al.
Title Page
Abstract Introduction
Conclusions References
Tables Figures
◭ ◮
◭ ◮
Back Close
Full Screen / Esc
Printer-friendly Version
Interactive Discussion
EGU
rection of a steel manufacturing and processing facility located about 10 km from the measurement site. In a separate experiment, aerosol was sampled directly from the emission stack of this facility and analyzed by RSMS. About 4% of the particles in the stack sample gave the same mass spectrum as that in Fig. 9b. (The remaining parti-cle spectra, perhaps formed by hot vapor condensation during the sampling process,
5
were organic/elemental carbon in character and contained no significant metals.) The stack measurements confirm the interpretation of the ambient data in Fig. 9b that these particles were emitted from the steel facility.
The data in Fig. 9 are also characteristic of measurements in the other four cities. Particles containing Pb almost always contained K and often Zn as well. Many of these
10
particles were internally mixed, showing mass spectral signatures for organic carbon, nitrate, and/or sulfate. The size distribution usually peaked around 200 nm, although the number concentration remained large at smaller sizes (Tolocka et al., 2004). A significant wind directionality was also commonly observed for Pb particles containing a large combination of metals. In Pittsburgh, a particle class containing Na, K, Zn and Pb,
15
though in different proportions from those in Fig. 9b, was attributed to a zinc processing facility (Bein et al, 2005). A transient plume of particles containing Na, Si, K, Ca, Fe, Ga and Pb was attributed to coal combustion (Bein et al., 2006). Mass concentrations of Pb obtained from MOUDI samples at the Pittsburgh site showed a maximum around 200 nm along with evidence for the tail of a coarse mode near 1000 nm. The coarse
20
mode appeared to be dominated by multi-metal classes, while the fine mode contained mostly particles having K, Pb and secondary aerosol components as the dominant species. Reconciliation of RSMS data with mass concentrations from MOUDI samples suggest density and shape factors of 3.0 g cm−3and 1.4 for Na-K-Zn-Pb particles, and 3.9 g cm−3and 1.5 for Na-Si-K-Ca-Fe-Ga-Pb particles. During plume events, the 24 hr
25
ACPD
7, 3763–3804, 2007Lead in atmospheric particles
D. M. Murphy et al.
Title Page
Abstract Introduction
Conclusions References
Tables Figures
◭ ◮
◭ ◮
Back Close
Full Screen / Esc
Printer-friendly Version
Interactive Discussion
EGU
4 Discussion
4.1 Calibration
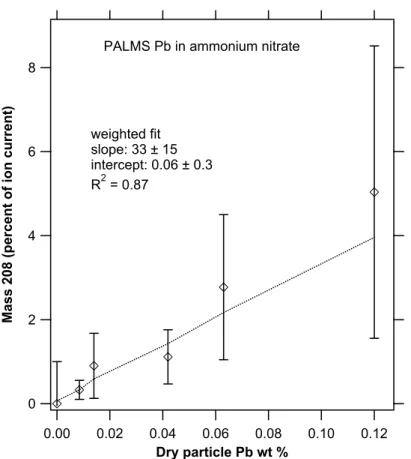
It is difficult to convert the ion fractions shown in the preceding figures into absolute concentrations of Pb. The conversion depends on both the ionization efficiency of Pb and the size range and sampling biases of the mass spectrometer. Figure 10 shows
5
a PALMS calibration for Pb in ammonium nitrate particles that also contained trace amounts of added Fe. The linearity is good for laser ionization. The slope of about 33 shows that PALMS is much more sensitive to Pb than ammonium nitrate. The high sensitivity to Pb is similar to results for other metals such as Fe in sulfuric acid (Cziczo et al., 2001). Mixed solutions with both Pb and Fe in ammonium nitrate showed similar
10
sensitivities for Pb and Fe.
Separate calibrations for Pb were performed for ATOFMS. The ATOFMS mass scale was calibrated on a daily basis during CLACE 5 using a standard solution of 900 mi-crograms per milliliter of six components (Li, Na, K, V, Ba, and Pb) in a 5% solution of HNO3 balanced by distilled, deionized water (i.e.,∼0.02 wt % lead with respect to
15
HNO3). Aerosols atomized from this solution were passed through a diffusion dryer at 30% relative humidity and size selected with a differential mobility analyzer at 0.5 mi-crometers. The dominant positive ions were K, V, and VO, each of which had relative peak areas of 10–20%. Li and Na ions had relative areas on the order of 5–10% fol-lowed by Ba and BaO with approximately 1%. Lead ions were observed in about half of
20
spectra with an average relative area of 0.5%, giving a relative sensitivity of Pb to nitric acid of about 12. This is a factor of 3 lower than found for lead in ammonium nitrate for PALMS, probably because the easily ionized alkali metals in the ATOFMS calibration mixture reduce the relative contribution from Pb as well as the different ionization laser wavelength.
25
ACPD
7, 3763–3804, 2007Lead in atmospheric particles
D. M. Murphy et al.
Title Page
Abstract Introduction
Conclusions References
Tables Figures
◭ ◮
◭ ◮
Back Close
Full Screen / Esc
Printer-friendly Version
Interactive Discussion
EGU
easily Pb is ionized but how difficult it is to ionize ammonium nitrate. A Pb calibration in a more easily ionized matrix such as sea salt would have a much smaller slope. Many particles with Pb also contained K, which could considerably change the relative sensitivity. A relative sensitivity for realistic atmospheric particles could be much lower, perhaps 5 to 10.
5
Second, a pure Pb particle cannot produce more than 100% Pb ions. A simple algebraic expression with the desired asymptotes of a relative sensitivity of S at low concentration and 100% ion yield for a pure substance is
C=x/(x+S(1−x))
wherex is an ion fraction, Cis the fractional concentration, andS is the relative
sen-10
sitivity. ForS greater than 1, this has the effect of stretching the x-axis on a histogram such as Fig. 5.
4.2 Contamination
Contamination is always a concern when measuring trace metals. For example, sam-ple contamination caused early work to overestimate Pb in water samsam-ples (Nriagu et
15
al., 1993). There are several reasons why the data here should be representative of the actual distribution of Pb on particles. Laser ionization done in vacuum inherently has essentially zero background for Pb. The only concern is if Pb particles are being generated in the inlet or if ambient particles are acquiring Pb by bouncing offan inlet wall. However, laboratory particles without added Pb do not give any Pb signal,
show-20
ing that the vacuum inlet is not contributing any Pb signal. The intercept on Fig. 11 also shows that fresh biomass burning particles are measured with essentially zero Pb. There are no Pb-containing materials such as solder in any of inlets for the data in this paper. There are four completely independent inlets: two for PALMS, since the inlet in Atlanta shared no common components with the aircraft inlet, the inlet for the
25
ACPD
7, 3763–3804, 2007Lead in atmospheric particles
D. M. Murphy et al.
Title Page
Abstract Introduction
Conclusions References
Tables Figures
◭ ◮
◭ ◮
Back Close
Full Screen / Esc
Printer-friendly Version
Interactive Discussion
EGU
Pb signal drops both in the marine boundary layer (Fig. 7) and the stratosphere (not shown) indicates that the Pb measured at intermediate altitudes is real.
4.3 Biomass burning plumes
Besides the wide geographic and altitude distribution of Pb, it was also present on many types of particles. One type of particular interest is biomass burning particles. On 9 July
5
and 27 July 2004, the P-3 aircraft sampled forest fire plumes from fires in northwestern Canada and eastern Alaska (de Gouw et al., 2006). The plumes, especially those encountered north of Maine, passed over lightly populated areas before they were sampled. None of the biomass particles observed in the plumes had a large Pb signal. Yet they contained small amounts of Pb nearly as often as particles from urban plumes.
10
Figure 11 shows the fraction of biomass-burning particles over eastern Canada that contained Pb as a function of the amount of sulfate on those particles. For this plume analysis, biomass burning particles were defined by cluster analysis of the mass spec-tra with the additional consspec-traints of gas phase acetonitrile greater than 250 ppbv and latitude north of 48 ˚ . Few particles contained much sulfate, but those that did often
15
contained Pb. In contrast, none of the particles sampled from a fresh biomass burn-ing plume over Utah in 2002 contained measurable Pb or sulfate (Hudson et al., 2004). The flight with a higher frequency of Pb (9 July) also encountered more gas phase SO2. The correlation between Pb and sulfate is a strong indication that the Pb was added to the particles during transport rather than coming from Pb in the burning vegetation
20
or soil. This correlation between sulfate and Pb in single biomass burning particles was not present for many other types of particles during these flights. The correlation is probably present in these biomass burning plumes because the major airborne Pb sources between Alaska and eastern Canada are smelters that are also major sources of SO2. In Atlanta, a similar correlation between Pb and sulfate was also found for
25
ACPD
7, 3763–3804, 2007Lead in atmospheric particles
D. M. Murphy et al.
Title Page
Abstract Introduction
Conclusions References
Tables Figures
◭ ◮
◭ ◮
Back Close
Full Screen / Esc
Printer-friendly Version
Interactive Discussion
EGU
4.4 Asian sources
Off the coast of California, the high average Pb signal near 36 N and 125 W (Fig. 6) included 59 particles with mass 208 greater than 10% of the total ion current in a rel-atively small region. All of these particles were encountered above 2 km, with the majority on a flight leg at 4.9 km. Compared to other Pb-rich particles during the
5
2002 flights, these had more K and much less As and Sn. According to a FLEX-PART simulation, the time period when they were sampled corresponded with trans-port from Asia (see Fig. S1 http://www.atmos-chem-phys-discuss.net/7/3763/2007/
acpd-7-3763-2007-supplement.pdf). Carbon monoxide was moderately elevated to about 120 ppbv. This flight period had total aerosol volumes of 1 to 3µm3cm−3below
10
1µm diameter and 1 to 10µm3 cm−3 in the coarse mode. These are unusually large for this altitude and probably mean that there was little scavenging of Asian emissions during this particular transport event.
The IMPROVE data shown in Fig. 3 also suggest transport of Pb to the western United States in springtime. The maxima at several western sites in April coincide
15
with the timing of transport from Asia. Particulate matter at three Asian sites and the North Pacific had Pb/Zn ratios of 0.6 to 0.8 (Cohen et al., 2004; Narita et al., 1999). Mauna Loa stays near the Asian Pb/Zn ratio throughout the year, even when absolute concentrations of both are very low. The Mount Zirkel site at 3243 m in Colorado is an especially clear example of a site reaching the Asian Pb/Zn ratio in the springtime and
20
going to the North American ratio of 0.3 to 0.4 the rest of the year.
Although the signature of transport from Asia is clear, it contributes less than 1 ng m−3 even in springtime in the western United States. Most of the airborne Pb over the United States cannot be from Asia.
4.5 Other metals in Pb-rich particles
25
ACPD
7, 3763–3804, 2007Lead in atmospheric particles
D. M. Murphy et al.
Title Page
Abstract Introduction
Conclusions References
Tables Figures
◭ ◮
◭ ◮
Back Close
Full Screen / Esc
Printer-friendly Version
Interactive Discussion
EGU
of the ion signal from Pb. Particles over the Pacific Ocean west of California and those over the eastern United States had fairly similar frequencies of other metals. The biggest difference is that particles over the ocean were more likely to contain Na. Fig-ure 13 shows the average mass spectra of all particles for which the208Pb signal was least 10% of the total ion signal. In these instruments metals are commonly found as
5
the elemental ion, so there is little information on the chemical form of the metal in the particles. The PbO+ion was occasionally observed.
4.6 Mechanisms for distributing Pb among particles
It seems unlikely that about 10% of the accumulation mode aerosol particles over the United States originated from sources that emit Pb. The special case of the biomass
10
burning plumes shows that particles can acquire Pb during atmospheric transport. In addition, particles over a wide range of sizes contained Pb. Two ways that so many par-ticles could contain Pb are condensation of gas phase Pb compounds and coagulation with small Pb-rich particles. Of these, it is likely that coagulation is much more impor-tant. Gas phase Pb compounds are present only at very low concentrations (Wang
15
et al., 1997; Shotyk and Le Roux, 2005). Another argument in favor of coagulation is that even in the areas with the most Pb many mass spectra with excellent signal to noise showed no Pb. This distribution is more easily explained by coagulation than by deposition from the gas phase, which should lead to some Pb on almost every parti-cle. Finally, Pb-rich particles smaller than 50 nm aerodynamic diameter were directly
20
observed in urban areas. The coagulation of such particles with larger organic-sulfate particles could explain why some but not all of those particles have Pb. Coagulation of Pb-rich particles onto other particles has been observed with detailed electron mi-croscopy (Utsunomiya et al., 2004; Cho ¨el et al., 2006).
Coagulation calculations show that reasonable times are required for 5 or 10% of
ac-25
ACPD
7, 3763–3804, 2007Lead in atmospheric particles
D. M. Murphy et al.
Title Page
Abstract Introduction
Conclusions References
Tables Figures
◭ ◮
◭ ◮
Back Close
Full Screen / Esc
Printer-friendly Version
Interactive Discussion
EGU
expressed as a fraction of particles, this time constant is independent of the concen-tration of accumulation mode particles. The times will be shorter or longer depending on the concentration of small particles. These calculations are from expressions in Table 10.1 of Seinfeld (1986) for 2 km altitude and small and larger particle densities of 2.5 and 1.5 g cm−3 respectively, although the calculation is not very sensitive to these
5
parameters. A factor of 1.25 was used as an estimate for the effect of van der Waals forces.
Figure 14 also indicates that coagulation with the assumed ultrafine particles is faster for larger particles. For the case discussed earlier of the biomass burning plume of Canada, particles with vacuum aerodynamic diameters larger than 700 nm were about
10
twice as likely to contain Pb than particles smaller than 400 nm. This is consistent with the coagulation calculation, although it is difficult to compare in detail because the size of the original Pb-containing particles is not known and the accumulation mode parti-cles change size during transport due to condensation of sulfates and other species.
5 Conclusions
15
Lead has been observed in particles over a wide size range from less than 50 nm to more than 2µm. Expressed as a fraction of the total aerosol, there was little gradient in Pb with altitude from the top of the boundary layer to the tropopause. Across a wide range of locations, altitudes, and particle chemistry, more than 5% of particles contain small amounts of Pb. There was a wide range of the amount of Pb in individual
20
particles. A significant fraction of the total Pb signal comes from a few particles that contain large amounts of Pb. These particles often contain other metals, especially Zn. Many of the Pb-containing particles by number have very small Pb signals and are otherwise similar to particles without Pb. In Atlanta, Wilmington, and other urban areas the Pb-rich particles had a strong dependence on wind direction but the particles with
25
small Pb signals were almost independent of wind direction.
ACPD
7, 3763–3804, 2007Lead in atmospheric particles
D. M. Murphy et al.
Title Page
Abstract Introduction
Conclusions References
Tables Figures
◭ ◮
◭ ◮
Back Close
Full Screen / Esc
Printer-friendly Version
Interactive Discussion
EGU
particles with accumulation mode aerosol. For the United States, the largest sources of airborne Pb are aviation gasoline, coal combustion, and smelters. All of these are combustion sources that can produce very small particle. The fraction of Pb in coal that becomes airborne and the Pb content of residual fuel oil are two parameters that could significantly affect the budget of airborne Pb. One special example of Pb interacting
5
with aerosols was that some particles in a biomass burning plume acquired both Pb and sulfate as the plume traversed Canada, probably from smelters along the way.
The percentage of particles containing Pb was as high or higher over the Pacific Ocean west of California than it was over the continental United States. Some of this Pb is clearly due to long-range transport from Asia. On an absolute basis, however,
10
North American sources were more important to Pb in the eastern United States. The overall fraction of particles with detectable Pb was also similar at a high altitude site in Switzerland to measurements in the United States. In both continents there was little size dependence and there was a wide range of Pb contents in individual particles. In both continents most of the particles with the highest Pb contents contained other
15
metals whereas particles with very small Pb contents were similar to those without any Pb.
The special capabilities of single particle mass spectrometry were essential to ob-taining these results. Only the measurement of large numbers of particles could obtain statistically significant samples of Pb-rich particles. High sensitivity was required to
20
measure the small amounts of Pb in many other particles. The results show a very geographically broad distribution of Pb in particles, consistent with multiple sources. These are some of the first data showing that Pb is present in particles in the free tro-posphere. The way Pb is distributed among different types of particles will affect how airborne Pb enters both the human lung and ecosystems.
25
ACPD
7, 3763–3804, 2007Lead in atmospheric particles
D. M. Murphy et al.
Title Page
Abstract Introduction
Conclusions References
Tables Figures
◭ ◮
◭ ◮
Back Close
Full Screen / Esc
Printer-friendly Version
Interactive Discussion
EGU We thank B. Linak and M. Murphy for pointing out some references on Pb in fuels.
References
Ali, M. F., Cukhari, A., and Saleem, M.: Trace metals in crude oils from Saudi Arabia, Ind. Eng. Chem. Prod. Res. Dev., 22, 691–694, 1983.
Alvarez, F. F., Rodr´ıguez, M. T., Espinosa, A. J. F., and Dab ´an, A. G.: Physical speciation of
5
arsenic, mercury, lead, cadmium and nickel in inhalable atmospheric particles, Anal. Chimica Acta, 524, 33–40, 2004.
Baltensperger, U., Gaggeler, H. W., Jost, D.T., Lugauer, M., Schwikowski, M., Weingartner, E., and Seibert, P.: Aerosol climatology at the high-alpine site Jungfraujoch, Switzerland, J. Geophys. Res., 102(D16), 19 707–19 715, 1997.
10
Bein, K. J., Zhao, Y., Wexler, A. S., and Johnston, M. V.: Speciation of size-resolved in-dividual ultrafine particles in Pittsburgh, Pennsylvania, J. Geophys. Res., 110, D07S05, doi:10.1029/2004JD004708, 2005.
Bein, K. J., Zhao, Y., Pekney, N. J., Davidson, C. I., Johnston, M. V., and Wexler, A. S.: Identifi-cation of sources of atmospheric PM at the Pittsburgh Supersite. Part II: Quantitative
compar-15
isons of single particle, particle number, and particle mass measurements, Atmos. Environ., 40, S424–S444, 2006.
Boughton, B. and Horvath, A.: Environmental assessment of used oil management methods, Environ. Sci. Technol., 38, 353–358, 2004.
Bratzel, M. P. Jr. and Chakrabarti, C. L., Determination of lead in petroleum and petroleum
20
products by atomic absorption spectrometry using a carbon rod analyzer, Anal. Chim. Acta, 61, 25–32, 1972.
Bukowiecki, N., Hill, M., Gehrig, R., Zwicky, C. N., Lienemann, P., Heged ¨us, F., Falkenberg, G., Wingartner, E., and Baltensperger, U.: Trace metals in ambient air: Hourly size-segregated mass concentrations determined by synchrotron-XRF, Environ. Sci. Technol., 39, 5754–
25
5762, 2005.
Cho ¨el, M., Deboudt, K., Flament, P., Lecornet, G., Perdrix, E., and Sobanska, S.: Fast evolution of tropospheric Pb- and Zn-rich particles in the vicinity of a lead smelter, Atmos. Environ., 40, 4439–4449, 2006.
Cohen, D. D., Garton, D., Stelcer, E., Hawa, O., Wang, T., Poon, S., Kim, J., Choi, B. C.,
ACPD
7, 3763–3804, 2007Lead in atmospheric particles
D. M. Murphy et al.
Title Page
Abstract Introduction
Conclusions References
Tables Figures
◭ ◮
◭ ◮
Back Close
Full Screen / Esc
Printer-friendly Version
Interactive Discussion
EGU Oh, S. N., Shin, H.-J., Ko, M. Y., and Uematsu, M.: Multielemental analysis and
charac-terization of fine aerosols at several key ACE-Asia sites, J. Geophys. Res., 109, D19S12, doi:10.1029/2003JD003569, 2004.
Cziczo, D. J., Thomson, D. S., and Murphy, D. M.: Ablation, flux, and atmospheric implications of meteors inferred from stratospheric aerosol, Science, 291, 1772–1775, 2001.
5
Davison, R. L., Natusch, D. F. S., Wallace, J. R., and Evans Jr., C. A.: Trace elements in fly ash: Dependence of concentration on particle size, Environ. Sci. Technol, 8, 1107–1113, 1974. De Gouw, J. A., Warneke, C., Stohl, A., Wollny, A. G., Brock, C. A., Cooper, O. R., Holloway,
J. S., Trainer, M., Fehsenfeld, F. C., Atlas, E. L., Donnelly, S. G., Stroud, V., and Lueb, A.: Volatile organic compounds composition of merged and aged forest fire plumes from Alaska
10
and western Canada, J. Geophys. Res., 111, D10303, doi:10.1029/2005JD0006175, 2006. Dreyfus, S., P ´echeyran, C., Magnier, C., Prinzhofer, A., Lienemann, C. P., and Donard, O. F.
X.: Direct trace and ultra-trace metals determination in crude oil and fractions by inductively coupled mass spectrometry, J. ASTM International, 2, 1–8, 2005.
Environmental Protection Agency, 2003, Latest findings on National Air Quality, 2002
Sta-15
tus and Trends, US Environmental Protection Agency. http://www.epa.gov/air/airtrends/
aqtrnd02/2002 airtrends final.pdf.
Flagan, R. C. and Taylor, D. D.: Laboratory studies of submicron particles from coal combustion, Eighteenth Symposium on Combustion, 1227–1237, The Combustion Institute, 1981. Gard, E., Mayer, J. E., Morrical, B. D., Dienes, T., Fergenson, D. P., and Prather, K. A.: Real-time
20
analysis of individual atmospheric aerosol particles: Design and performance of a portable ATOFMS, Anal. Chem. 69, 4083–4091, 1997.
Gokhale, S. B. and Patil, R. S.: Size distribution of aerosols (PM10) and lead (Pb) near traffic intersections in Mumbai (India), Environ. Mon. Assessment, 95, 311–324, 2004
Han, J. S., Moon, K. J., Ryu, S. Y., Kim, Y. J., and Perry, K. D.: Source estimation of
an-25
thropogenic aerosols collected by a DRUM sampler during spring of 2002 at Gosan, Korea, Atmos. Environ., 39, 3113–3125, 2005.
Heathcote, R., Simmons, D., and Bernholtz, S.: Analysis of motor-vehicle fuels for metals by inductively coupled plasma-mass spectrometry, Iowa Ground Water Quarterly, 39, 1–4, 2000.
30
ACPD
7, 3763–3804, 2007Lead in atmospheric particles
D. M. Murphy et al.
Title Page
Abstract Introduction
Conclusions References
Tables Figures
◭ ◮
◭ ◮
Back Close
Full Screen / Esc
Printer-friendly Version
Interactive Discussion
EGU doi:10.1029/2003JD004398, 2004.
Kaufmann, R. L.: Laser-microprobe mass spectroscopy (LAMMA) of particulate matter, Physi-cal and ChemiPhysi-cal Characterization of Individual Airborne Particles, edited by: Spurny, K. R., Ellis & Horwood Ltd., Chichester, 1986.
Lake, D. A., Tolocka, M. P., Johnston, M. V., and Wexler, A. S.: Mass spectrometry of
individ-5
ual particles between 50 and 750 nm in diameter at the Baltimore Supersite, Environ. Sci. Technol., 37, 3268–3274, 2003.
Lee, S.-H., Murphy, D. M., Thomson, D. S., and Middlebrook, A. M.: Chemical components of single particles measured with Particle Analysis by laser Mass Spectrometry (PALMS) during the Atlanta SuperSite Project: Focus on organic/sulfate, lead, soot, and mineral particles, J.
10
Geophys. Res., 107, AAC 1, doi:10.1029/2000JD000011, 2002.
Linak, W. P. and Wendt, J. O. L.: Toxic metal emissions from incineration: Mechanisms and control, Prog. Energy Comb. Sci, 19, 145–185, 1993.
Magaw, R. I., McMillen, S. J., Gala, W. R., Trefry, J. H., and Trocine, R. P.: Risk evaluation of metals in crude oils, Proc. 6th Int. Petrol. Environ. Conf. Nov. 16-18, Houston, TX, 460–473,
15
1999.
Malm, W. C., Sisler, J. F., Huffman, D., Eldred, R. A., and Cahill, T. A.: 1994: Spatial and Seasonal Trends in Particle Concentration and Optical Extinction in the United-States, J. Geophys. Res., 99, 1347–1370.
Maenhaut, W., Cafmeyer, J., Dubtsov, S., and Chi, X.: Detailed mass size distributions of
20
elements and species, and aerosol chemical mass closure during fall 1999 at Gent, Belgium, Nucl. Instrum. Methods in Phys. Res. B., 189, 238–242, 2002.
Mallina, R. V., Wexler, A. S., Rhoads, K. P., and Johnston, M. V.: High speed particle beam generation: A dynamic focusing mechanism for selecting ultrafine particles, Aerosol Sci. Technol., 33, 87–104, 2000.
25
Miller, C. A., Ryan, J. V., and Lombardo, T.: Characterization of air toxics from an oil-fired firetube boiler, J. Air Waste Manage. Assoc., 46, 742–748, 1996.
Murphy, D. M., Cziczo, D. J., Froyd, K. D., Hudson, P. K., Matthew, B. M., Middlebrook, A. M., Peltier, R. E., Sullivan, A., Thomson, D. S., and Weber, R. L.: Single-particle mass spectrometry of tropospheric aerosol particles, J. Geophys. Res., 111, D23S32,
30
doi:10.1029/2006JD007340, 2006.
ACPD
7, 3763–3804, 2007Lead in atmospheric particles
D. M. Murphy et al.
Title Page
Abstract Introduction
Conclusions References
Tables Figures
◭ ◮
◭ ◮
Back Close
Full Screen / Esc
Printer-friendly Version
Interactive Discussion
EGU inductively coupled plasma mass spectrometry equipped with laser ablation, J. Geophys.
Res., 104, 26 859–26 866, 1999.
Nriagu, J. O., Lawson, G., Wong, H. K., and Azcue, J. M.: A protocol for minimizing contamina-tion in the analysis of trace metals in Great Lakes waters, J. Great Lakes Res., 19, 175–182, 1993.
5
Phares, D. J., Rhoads, K. P., Johnston, M. V., and Wexler, A. S.: Size-resolved ultra-fine particle composition analysis, Part 2: Houston, J. Geophys. Res., 108(D7), 8420, doi:10.1029/2001JD001212, 2003.
Raask, E.: The mode of occurrence and concentration of trace elements in coal, Prog. Energy. Combust. Sci., 11, 97–118, 1985.
10
Rhoads, K. P., Phares, D. J., Wexler, A. S., and Johnston, M. V.: Size-resolved ultra-fine particle composition analysis, Part 1: Atlanta, J. Geophys. Res., 108(D7), 8418 doi:10.1029/2001JD001211, 2003.
Rising, B., Wu, J., and Sorurbakhsh, P., Survey of ultra-trace metals in gas turbine fuels, 11th Annual International Petroleum Environmental Conference, Oct 12–15, 2004.
15
Salma, I., Maenhaut, W., and Z ´aray, G.: Comparative study of elemental mass size distributions in urban atmospheric aerosol, J. Aerosol Sci., 22, 339–356, 2002.
Shotyk, W., and Le Roux, G.: Biogeochemistry and Cycling of Lead, in “Biogeochemical Cycles of the Elements”, Vol. 43 of Metal Ions in Biological Systems, edited by: Sigel, A., Sigel, H., and O. Sigel, R. K., and Dekker, M., New York, 240–275, 2005.
20
Shotyk, W., Zheng, J., Krachler, M., Zdanowicz, C., Koemer, R., and Fisher, D.: Predominance of industrial Pb in recent snow (1994–2004) and ice (1842–1996) from Devon Island, Arctic Canada, Geophys. Res. Lett., 32, L21814, doi:10.1029/2005GL023860, 2005.
Shumway, L. A.: Trace element and polycyclic aromatic hydrocarbon analyses of jet engine fuels: Jet A, JP5, and JP8, Technical Report 1845, SPAWAR Systems Center, San Diego,
25
2000.
Sienfeld, J. H.: Air Pollution, Wiley and Sons, New York, 738 pp., 1986.
Singh, M., Jaques, P. A., and Sioutas, C.: Size distribution and diurnal characteristics of particle-bound metals in source and receptor sites of the Los Angeles Basin, Atmos. En-viron., 36, 1675–1689, 2002.
30
ACPD
7, 3763–3804, 2007Lead in atmospheric particles
D. M. Murphy et al.
Title Page
Abstract Introduction
Conclusions References
Tables Figures
◭ ◮
◭ ◮
Back Close
Full Screen / Esc
Printer-friendly Version
Interactive Discussion
EGU J. Geophys. Res., 108(7), 8413, doi:10.1029/1002JD001458, 2003.
Stohl, A., Forster, C., Frank, A., Seibert, P., and Wotawa, G.: Technical note: The Lagrangian particle dispersion model FLEXPART version 6.2, Atmos. Chem. Phys., 5, 2461–2474, 2005 Tan, M. G., Zhang, G. L., Li, X. L., Zhang, Y. X., Yue, W. S., Chen, J. M., Wang, Y. S., Li, A. G.,
Li Y., Zhang, Y. M., and Shan, Z. C.: Comprehensive study of lead pollution in Shanghai by
5
multiple techniques, Anal. Chem., 78, 8044–8050, 2006.
Thomson, D. S., Schein, M. E., and Murphy D. M.: Particle analysis by laser mass spectrometry WB-57F instrument overview, Aerosol Sci. Technol., 33, 153–169, 2000.
Tolocka, M. P., Lake, D. A., Johnston, M. V., and Wexler, A. S.: Number concentrations of fine and ultrafine particles containing metals, Atmos. Environ., 38, 3263–3273, 2004.
10
Tolocka, M. P., Lake, D. A., Johnston, M. V., and Wexler, A. S.: Size-resolved fine and ultrafine particle composition in Baltimore, Maryland, J. Geophys. Res., 110, D07S04, doi:10.1029/2004JD004573, 2005
Utsunomiya, S., Jensen, K. A., Keeler, G. J., and Ewing, R. C.: Direct identification of trace metals in fine and ultrafine particles in the Detroit urban atmosphere, Environ. Sci. Technol.,
15
38, 2289–2297, 2004.
Vermont Department of Environmental Conservation, Vermont used oil analysis and waste oil furnace emissions study, Waterbury, Vermont, 1994.
Wang, Y., Turnbull, A. B., and Harrison, R. M.: Concentrations, phase partitioning, and depo-sition of specific alkyl-lead compounds in the atmosphere, Appl. Organometallic Chem., 11,
20
899–901, 1997.
ACPD
7, 3763–3804, 2007Lead in atmospheric particles
D. M. Murphy et al.
Title Page
Abstract Introduction
Conclusions References
Tables Figures
◭ ◮
◭ ◮
Back Close
Full Screen / Esc
Printer-friendly Version
Interactive Discussion
EGU
Table 1.Estimated United States mass budgets for Pb in selected fuels and crude oil.
Fuel 2005 U.S. consumption (Tg)
Pb content (ppm by mass)
Total Pb
(103kg yr−1) Airbornefraction AirbornePb
(103kg yr−1)
References and notes
Coal 1020 5–35 20 000 ∼0.01 ∼200 Raask (1985); Linak and Wendt (1993). Airborne frac-tion inferred from Table 1.1-18 in EPA document AP-42.
Aviation gasoline 0.8 ∼750 575 >0.75 490
Gasoline 390 0.005 2 0.75 1.5 Heathcote et al. (2000) A few samples in Iowa
Jet fuel 72 0.005–0.011 0.6 1 ? 0.6 Shumway (2000)
Distillate oil 201 0.015–0.040 4 Miller et al. (1996); Rising et al. (2004)
Residual oil 50 2–21 100–>500 Bratzel and Chakrabarti (1972); Miller et al. (1996). 21 ppm may not be rep-resentative if crude oil numbers are correct
Used oil 3 30–50 100 Boughton and Horvath
(2004); Vermont (1994).
Coke 20 ≥ residual
oil?
>80 Much coke combustion prob-ably has emission controls.
Crude oil 744 0.032–0.97 25–700 ——– ——– Bratzel and Chakrabarti (1972); Ali et al. (1983); Ma-gaw et al. (1999); Dreyfus et al. (2005). Limited number of samples.
ACPD
7, 3763–3804, 2007Lead in atmospheric particles
D. M. Murphy et al.
Title Page
Abstract Introduction
Conclusions References
Tables Figures
◭ ◮
◭ ◮
Back Close
Full Screen / Esc
Printer-friendly Version
Interactive Discussion
EGU
!" "" "
# " $% "
&'' ('' )'' *'' +'' '' '
US Pb air emissions (103kg yr-1)
ACPD
7, 3763–3804, 2007Lead in atmospheric particles
D. M. Murphy et al.
Title Page
Abstract Introduction
Conclusions References
Tables Figures
◭ ◮
◭ ◮
Back Close
Full Screen / Esc
Printer-friendly Version
Interactive Discussion
EGU
!" #
$ % !" ! & '& ( )%
$ *% $ + ) !"
& " ,
-Fig. 2. Lead emissions from the EPA 1999 and 2002 National Emissions inventories and the 2004 Environment Canada National Pollutant Release Inventory on-line search. See text for modifications and error corrections to the inventories. To compensate for the different sizes of counties in the United States, county level data have been combined on a 1.5 by 1.5 degree grid. Each point is plotted at the weighted average position of the sources within the grid box. This helps properly position large point sources. Points less than 100 kg yr−1
ACPD
7, 3763–3804, 2007Lead in atmospheric particles
D. M. Murphy et al.
Title Page Abstract Introduction Conclusions References Tables Figures ◭ ◮ ◭ ◮ Back Close
Full Screen / Esc
Printer-friendly Version Interactive Discussion EGU !
"# $% & '$ (
(% ) ( * +
,-" $
$% .
+$ /
0 $ " 1 * ) 2
' . ) % +$% 2/ 3 3 3 3 3 !
"# $% & '$ (
(% ) (
* +
,-" $ $% .
+$ / 0 $ "
1 * ) 2
'
. ) %
+$% 2/
ACPD
7, 3763–3804, 2007Lead in atmospheric particles
D. M. Murphy et al.
Title Page Abstract Introduction Conclusions References Tables Figures ◭ ◮ ◭ ◮ Back Close
Full Screen / Esc
Printer-friendly Version Interactive Discussion EGU !" # $ $ %& %& # ' # () ( ) (*) (+)
ACPD
7, 3763–3804, 2007Lead in atmospheric particles
D. M. Murphy et al.
Title Page Abstract Introduction Conclusions References Tables Figures ◭ ◮ ◭ ◮ Back Close
Full Screen / Esc
Printer-friendly Version Interactive Discussion EGU
Mass 208 (fraction of total ion current) Relative contribution to total signal at mass 208 !" # !" $$$ % & & & Fraction of mass spectra
Mass 208 (fraction of total ion current) $$$ '
( ) ) *''+, -./01
-1 -)1
ACPD
7, 3763–3804, 2007Lead in atmospheric particles
D. M. Murphy et al.
Title Page
Abstract Introduction
Conclusions References
Tables Figures
◭ ◮
◭ ◮
Back Close
Full Screen / Esc
Printer-friendly Version
Interactive Discussion
EGU 50
45
40
35
30
North Latitude
130 120 110 100 90 80 70 60
West Longitude
1% 10% 25% Frequency of mass 208 > 0.03%
no data in areas with no points 50
45
40
35
30
North Latitude
130 120 110 100 90 80 70 60
West Longitude
0.02% 0.2%
0.7% Average signal at mass 208
no data in areas with no points
(a)
(b)
Fig. 6. Geographical distribution of the average signal at mass 208, which is almost always 208
Pb, along with the frequency of that peak in single particles. The data were binned into 2 to 2.5 degree boxes with the points plotted where taken – if the aircraft only flew through a corner of a grid box the point is plotted at the corner. There are a few more points plotted in(b)
ACPD
7, 3763–3804, 2007Lead in atmospheric particles
D. M. Murphy et al.
Title Page
Abstract Introduction
Conclusions References
Tables Figures
◭ ◮
◭ ◮
Back Close
Full Screen / Esc
Printer-friendly Version
Interactive Discussion
EGU
ACPD
7, 3763–3804, 2007Lead in atmospheric particles
D. M. Murphy et al.
Title Page
Abstract Introduction
Conclusions References
Tables Figures
◭ ◮
◭ ◮
Back Close
Full Screen / Esc
Printer-friendly Version
Interactive Discussion
EGU
Fig. 8.Examples of ATOFMS mass spectra of single particles containing lead at the Jungfrau-joch Research Station. (a)A particle with>5% of the relative signal from lead and containing several commonly associated metals. The negative spectrum contains fragments from sulfates and nitrates as well as Cl−