ACPD
11, 27383–27420, 2011Identification and quantification of
organic aerosol
C. Mohr et al.
Title Page
Abstract Introduction
Conclusions References
Tables Figures
◭ ◮
◭ ◮
Back Close
Full Screen / Esc
Printer-friendly Version Interactive Discussion
Discussion
P
a
per
|
Dis
cussion
P
a
per
|
Discussion
P
a
per
|
Discussio
n
P
a
per
|
Atmos. Chem. Phys. Discuss., 11, 27383–27420, 2011 www.atmos-chem-phys-discuss.net/11/27383/2011/ doi:10.5194/acpd-11-27383-2011
© Author(s) 2011. CC Attribution 3.0 License.
Atmospheric Chemistry and Physics Discussions
This discussion paper is/has been under review for the journal Atmospheric Chemistry and Physics (ACP). Please refer to the corresponding final paper in ACP if available.
Identification and quantification of
organic aerosol from cooking and other
sources in Barcelona using aerosol mass
spectrometer data
C. Mohr1, P. F. DeCarlo1,*, M. F. Heringa1, R. Chirico1,**, J. G. Slowik1, R. Richter1, C. Reche2, A. Alastuey2, X. Querol2, R. Seco3, J. Pe ˜nuelas3, J. L. Jim ´enez4,5, M. Crippa1, R. Zimmermann6,7, U. Baltensperger1, and A. S. H. Pr ´ev ˆot1
1
Laboratory of Atmospheric Chemistry, Paul Scherrer Institut (PSI), Villigen, Switzerland
2
Institute for Environmental Assessment and Water Research (IDAEA-CSIC), Barcelona, Spain
3
Unitat d’Ecologia Global CREAF-CEAB-CSIC, Centre de Recerca Ecol `ogica i Aplicacions Forestals, Universitat Aut `onoma de Barcelona, Barcelona, Spain
4
Department of Chemistry and Biochemistry, University of Colorado, Boulder, USA
5
Cooperative Institute for Research in the Environmental Sciences (CIRES), University of Colorado, Boulder, USA
6
ACPD
11, 27383–27420, 2011Identification and quantification of
organic aerosol
C. Mohr et al.
Title Page
Abstract Introduction
Conclusions References
Tables Figures
◭ ◮
◭ ◮
Back Close
Full Screen / Esc
Printer-friendly Version Interactive Discussion
Discussion
P
a
per
|
Dis
cussion
P
a
per
|
Discussion
P
a
per
|
Discussio
n
P
a
per
7
University of Rostock, Rostock, Germany
∗
now at: Department of Civil, Architectural, and Environmental Engineering, Drexel University, Philadelphia, PA, USA
∗∗
now at: Italian National Agency for New Technologies, Energy and Sustainable Economic Development (ENEA), UTAPRAD-DIM, Frascati, Italy
Received: 18 September 2011 – Accepted: 24 September 2011 – Published: 6 October 2011
Correspondence to: A. S. H. Pr ´ev ˆot ([email protected])
ACPD
11, 27383–27420, 2011Identification and quantification of
organic aerosol
C. Mohr et al.
Title Page
Abstract Introduction
Conclusions References
Tables Figures
◭ ◮
◭ ◮
Back Close
Full Screen / Esc
Printer-friendly Version Interactive Discussion
Discussion
P
a
per
|
Dis
cussion
P
a
per
|
Discussion
P
a
per
|
Discussio
n
P
a
per
|
Abstract
PM1 (particulate matter with an aerodynamic diameter<1 µm) non-refractory compo-nents and black carbon were measured continuously together with additional parame-ters at an urban background site in Barcelona, Spain, during March 2009 (campaign DAURE, Determination of the sources of atmospheric Aerosols in Urban and Rural 5
Environments in the western Mediterranean). Positive matrix factorization (PMF) was conducted on the organic aerosol (OA) data matrix measured by an aerosol mass spectrometer, on both unit mass (UMR) and high resolution (HR) data. Five factors or sources could be identified: LV-OOA (low-volatility oxygenated OA), related to re-gional, aged secondary OA; SV-OOA (semi-volatile oxygenated OA), a fresher oxy-10
genated OA; HOA (hydrocarbon-like OA, related to traffic emissions); BBOA (biomass burning OA) from domestic heating or agricultural biomass burning activities; and COA (cooking OA). LV-OOA contributed 28 % to OA, SV-OOA 27 %, COA 17 %, HOA 16 %, and BBOA 11%. The COA HR spectrum contained substantial signal from oxygenated ions (O/C: 0.21) whereas the HR HOA spectrum had almost exclusively contributions 15
from chemically reduced ions (O/C: 0.03). If we assume that the carbon in HOA is fossil while that in COA and BBOA is modern, primary OA in Barcelona contains a surprisingly high fraction (59 %) of non-fossil carbon.
This paper presents a method for estimating cooking organic aerosol in ambient datasets based on the fractions of organic mass fragments at m/z55 and 57: their 20
data points fall into a V-shape in a scatter plot, with strongly influenced HOA data aligned to the right arm and strongly influenced COA data points aligned to the left arm. HR data show that this differentiation is mainly driven by the oxygen-containing ions C3H3O+ and C3H5O+, even though their contributions to m/z55 and 57 are low compared to the reduced ions C4H+7 and C4H+9. A simple estimation method based 25
ACPD
11, 27383–27420, 2011Identification and quantification of
organic aerosol
C. Mohr et al.
Title Page
Abstract Introduction
Conclusions References
Tables Figures
◭ ◮
◭ ◮
Back Close
Full Screen / Esc
Printer-friendly Version Interactive Discussion
Discussion
P
a
per
|
Dis
cussion
P
a
per
|
Discussion
P
a
per
|
Discussio
n
P
a
per
1 Introduction
Atmospheric aerosols, liquid or solid particles suspended in air, are of interest due to their impact on climate (IPCC, 2007), visibility (Watson, 2002), ecosystems (Grantz et al., 2003), and human health (Nel, 2005). Numerous natural and anthropogenic sources directly emit particles into the air, or release gas-phase precursors whose ox-5
idation products partition into the particle phase. Consequently, the chemical compo-sition of ambient particulate matter (PM) varies considerably and consists of many dif-ferent compounds (Tsigaridis et al., 2006). A major aerosol constituent is organic ma-terial (Murphy et al., 2006; Jim ´enez et al., 2009). However, knowledge about sources, fate and mutual interaction of gas-phase and aerosol organic compounds is still lim-10
ited (Goldstein and Galbally, 2007). Therefore, the atmospheric evolution of organic aerosol (OA) is the focus of vast research activities (Jim ´enez et al., 2009).
The complexity of the atmospheric aerosol system places great demands on mea-surement techniques and instrumentation (Hallquist et al., 2009). Aerosol mass spec-trometers (AMS) have become a widely applied tool (Baltensperger et al., 2010), be-15
cause they allow chemical speciation, sizing and mass detection of submicron non-refractory PM at very high time resolution (Canagaratna et al., 2007). Zhang et al. (2005a) deconvolved and quantified the mass concentrations of hydrocarbon-like OA (HOA, a surrogate for primary OA, POA) and oxygenated OA (OOA, a surrogate for secondary OA, SOA) using organic mass spectra obtained with an AMS. Recently, 20
AMS data have been combined with positive matrix factorization (PMF, Paatero and Tapper, 1994; Lanz et al., 2007; Ulbrich et al., 2009), a factor analytical model which outputs a number of constant source profiles (factors) and their varying contributions over time. This has led to new insights into sources contributing to OA and made the quantification of OA subtypes such as low-volatility and semi-volatile OOA (LV- and SV-25
ACPD
11, 27383–27420, 2011Identification and quantification of
organic aerosol
C. Mohr et al.
Title Page
Abstract Introduction
Conclusions References
Tables Figures
◭ ◮
◭ ◮
Back Close
Full Screen / Esc
Printer-friendly Version Interactive Discussion
Discussion
P
a
per
|
Dis
cussion
P
a
per
|
Discussion
P
a
per
|
Discussio
n
P
a
per
|
An OA factor recently reported in ambient air in several AMS studies is cooking or-ganic aerosol (COA, Allan et al., 2010; Huang et al., 2010; Sun et al., 2011). Emissions from cooking activities had been identified as a potentially important source of PM much earlier (Gray, 1986). To a great extent an indoor air pollution problem (Fortmann et al., 2001), cooking aerosol can also contribute substantially to ambient PM concen-5
trations: e.g. meat charbroiling and frying were estimated to account for about 16 % of fine organic carbon emissions or 6 % of total fine PM concentrations in the Los Ange-les area (Hildemann et al., 1991; Schauer et al., 1996). Most studies focused on meat cooking emissions when investigating cooking aerosol; numerous compounds were identified in meat cooking OA, among which palmitic acid, stearic acid, oleic acid, and 10
cholesterol are the most prominent (Cass, 1998; Schauer et al., 1999). Charbroiling OA was also identified in ambient air by AMS-PMF analyses (Lanz et al., 2007; Slowik et al., 2010). Schauer et al. (2001) extended the research on cooking PM to emissions from cooking vegetables with seed oils; studies on Chinese food cooking emissions further broadened the range of emissions investigated (He et al., 2004; Zhao et al., 15
2006; He et al., 2010). Fatty acids are the dominant group of compounds emitted by all cooking types; they differ in fractions of saturated, unsaturated, and polyunsaturated fats depending on the type of oil or meat fat (Zhao et al., 2006). Mohr et al. (2009) characterized primary OA from cooking various types of meat with an AMS and found that the unit mass resolution (UMR) spectral signature is very similar to HOA. The dif-20
ferences in the high resolution (HR) spectra are larger due to the oxygen present in the fatty acids; however, the similarity of UMR spectra from HOA and COA might be one of the reasons for the relatively small number of locations where COA was de-tected with an AMS, despite its potential importance as a contributor to urban aerosol concentrations.
25
ACPD
11, 27383–27420, 2011Identification and quantification of
organic aerosol
C. Mohr et al.
Title Page
Abstract Introduction
Conclusions References
Tables Figures
◭ ◮
◭ ◮
Back Close
Full Screen / Esc
Printer-friendly Version Interactive Discussion
Discussion
P
a
per
|
Dis
cussion
P
a
per
|
Discussion
P
a
per
|
Discussio
n
P
a
per
intense and varied sources of primary emissions in this region provide an ideal test case for the feasibility of identifying cooking emissions and determining their impor-tance relative to other OA sources.
2 Method
2.1 DAURE campaign, Barcelona (Spain)
5
Data for this study were acquired during the intensive field campaign DAURE in Barcelona, Spain, from 25 February to 26 March 2009. The DAURE campaign was set up to study the aerosol formation processes during the winter anticyclonic episodes, when the highest PM1levels are recorded both at urban and regional scale in the West-ern Mediterranean (Pey et al., 2010). Thus, the aerosol sampled during this period 10
is characterized by higher ambient concentrations, specially of nitrate and carbona-ceous components, when compared with the urban background mean annual average in Barcelona (P ´erez et al., 2008b). A detailed overview of the campaign, its objectives, the groups involved, the measurements performed, and a summary of the results are presented in Pandolfi et al. (2011).
15
The city of Barcelona is situated on the shore of the western Mediterranean basin, wedged in between the sea and the Catalan coastal ranges running parallel to the coastline NE-SW. The Besos and the Llobregat river valleys perpendicular to the coast limit the city area to the NE and SW. The warm and dry Mediterranean climate, in-tense solar radiation and low dispersive conditions favor high levels of regional aerosol 20
(P ´erez et al., 2008a); additionally, high anthropogenic emissions lead to intense pollu-tion episodes. Barcelona is one of the cities in Europe with the highest number of cars per km2 (Ajuntament de Barcelona, 2007). Emissions from the Barcelona harbor, an expanded industrial zone in the river valley and the densely populated pre-coastal de-pression behind the coastal range all add additional PM to the Barcelona area aerosol 25
ACPD
11, 27383–27420, 2011Identification and quantification of
organic aerosol
C. Mohr et al.
Title Page
Abstract Introduction
Conclusions References
Tables Figures
◭ ◮
◭ ◮
Back Close
Full Screen / Esc
Printer-friendly Version Interactive Discussion
Discussion
P
a
per
|
Dis
cussion
P
a
per
|
Discussion
P
a
per
|
Discussio
n
P
a
per
|
Barcelona air quality (P ´erez et al., 2006). The daily cycle of nocturnal offshore flows and diurnal sea breeze (Jorba et al., 2011) plays an important role for the pollution dispersion in Barcelona. The sea breeze advects (polluted) coastal air masses inland, while nocturnal land breeze and mountain down slope flows transport air masses from the surrounding valleys to the city of Barcelona.
5
The measurement site was situated at the northwestern corner of the city centre in a small park (elevation 80 m a.s.l.) surrounded by residential areas. At a distance of
∼300 m is Diagonal Avenue, one of the main traffic arteries crossing Barcelona with
100 000 vehicles per day (Ajuntament de Barcelona, 2007), while the Mediterranean sea is∼6 km away.
10
2.2 Instrumentation and sampling
A complete list of instruments deployed during DAURE is given in Pandolfi et al. (2011). A brief discussion of the instruments used for the present analysis is included here. Non-refractory PM1 chemical composition was measured with an Aerodyne high-resolution time-of-flight aerosol mass spectrometer (HR-ToF-AMS). This version of the 15
AMS allows the distinction of different ions at the same nominal mass-to-charge ratio (m/z). It can be run in two ion optical modes, a single reflection mode with higher sen-sitivity and lower resolving power referred to as V-mode, and a so-called W mode with a two-reflectron configuration that yields higher resolving power but lower sensitivity. A detailed description of the instrument can be found in DeCarlo et al. (2006). During 20
DAURE the HR-ToF-AMS (abbreviated as AMS hereafter) was operated alternately in V and W mode (150 s each). In W mode, 15 cycles of 5 s open and 5 s closed data in the mass spectrum (MS) mode were acquired before saving. In V mode, 5 cycles of 15 s in MS mode (50 % open) plus 30 s in particle time-of-flight (PToF) mode yielded the size distribution of PM1components.
25
ACPD
11, 27383–27420, 2011Identification and quantification of
organic aerosol
C. Mohr et al.
Title Page
Abstract Introduction
Conclusions References
Tables Figures
◭ ◮
◭ ◮
Back Close
Full Screen / Esc
Printer-friendly Version Interactive Discussion
Discussion
P
a
per
|
Dis
cussion
P
a
per
|
Discussion
P
a
per
|
Discussio
n
P
a
per
submicron particle number size distributions between 13 and 638 nm mobility diameter with a time resolution of 5 min.
Aerosol black carbon (BC) mass concentrations were derived from particle light at-tenuation (bATN) measurements (time resolution 5 min) at a wavelength of 880 nm by an aethalometer, Model AE31 (Magee Scientific).
5
A laser-spectrometer (Grimm Labortechnik GmbH & Co. KG; model 1107/1108) pro-vided continuous measurements of PM1(and PM2.5and PM10, not shown) with a time resolution of 1 h. The Grimm mass loadings were corrected using PM1 samples col-lected on filters as discussed by Reche et al. (2011b).
The above instruments were deployed on a common sample inlet with a PM2.5 cy-10
clone (SCC 1.829, BGI Incorporated), requiring a flow rate of 5 l min−1. The inlet was situated on the roof of the trailer containing the instruments, at a height of∼4 m above
ground. A 12inch outer diameter (o.d.) stainless steel tube led inside the trailer (length 2.3 m) to a manifold. From there the sample air flowed (flow rate 0.4 l min−1) through a Nafion dryer (Perma-Pure, length 100 cm) and 40 cm of 14inch o.d. stainless steel 15
tube to the inlet of the AMS. The SMPS inlet was connected to the Nafion drier with a 120 cm long copper tube, 6 mm o.d. Copper tubing with 105 cm of 6 mm o.d. and 1 cm of 10 mm o.d. led to the aethalometer. The total inlet residence time was 14 s for the AMS and 10 s for the SMPS under laminar flow, and 3.5 s for the aethalometer, whose last part of the inlet flow was slightly turbulent (Reynolds NumberRe=2160).
20
2.3 Data analysis
AMS data were analyzed using the standard AMS data analysis software SQUIR-REL v1.51B and PIKA v1.10B within Igor Pro 6.22A (Wavemetrics). A collection ef-ficiency (CE) dependent on the nitrate fractionfNO3 was applied to the entire dataset, with CE=0.5 for fNO3≤0.25, CE=1 for fNO
3≥0.78 and a linear increase of CE be-25
tween these values for 0.25≤fNO
3≤0.75. This relationship was empirically determined
ACPD
11, 27383–27420, 2011Identification and quantification of
organic aerosol
C. Mohr et al.
Title Page
Abstract Introduction
Conclusions References
Tables Figures
◭ ◮
◭ ◮
Back Close
Full Screen / Esc
Printer-friendly Version Interactive Discussion
Discussion
P
a
per
|
Dis
cussion
P
a
per
|
Discussion
P
a
per
|
Discussio
n
P
a
per
|
within theEuropean integrated project on aerosol cloud climate air quality interactions (EUCAARI) and theEuropean monitoring and evaluation programme(EMEP) all over Europe (Nemitz et al., 2011). DAURE data were included in that collection of data sets. A very similar dependence of CE onfNO3 was recently reported by Middlebrook et al. (2011) for studies in the US. The time series of the estimated CE can be found in 5
Fig. S1.
Positive matrix factorization (PMF, Paatero and Tapper, 1994; Lanz et al., 2007) was applied to both unit mass resolution (UMR) and high resolution (HR) organic spectra measured by AMS to investigate factors or sources contributing to the organic mass loadings. The UMR input matrices were prepared according to the protocol outlined 10
in Ulbrich et al. (2009) and comprisedm/z’s 12–300. The HR data and error matrices were generated as outlined in DeCarlo et al. (2010). Ions from m/z’s 12–115 were included in the data matrix; isotopes whose signal was constrained by the peak area of their parent ion were removed. Elemental analysis of the HR data and PMF factors was done using the software APES v1.05 within Igor Pro 6.22A. SMPS data were 15
analyzed and corrected for multiply charged particles using the PSI inversion routine (Wiedensohler et al., 2011).
bATN measured at 880 nm by the aethalometer was corrected for multiple scattering of the light beam within the unloaded filter matrix (C=2.81, Collaud Coen et al., 2010) and for the “shadowing” caused by the deposited particles (f =1.2) following the pro-20
cedure by Weingartner et al. (2003), yielding the aerosol absorption coefficientbabs.
babs and an absorption cross-sectionσabs=σATN/Cof 5.91 m2g−1 (σATN=16.6 m2g−1 delivered by the aethalometer data software) were then used to calculate the BC mass concentration at 880 nm. All data are reported at local pressure and temperature con-ditions in local standard time (UTC+1).
ACPD
11, 27383–27420, 2011Identification and quantification of
organic aerosol
C. Mohr et al.
Title Page
Abstract Introduction
Conclusions References
Tables Figures
◭ ◮
◭ ◮
Back Close
Full Screen / Esc
Printer-friendly Version Interactive Discussion
Discussion
P
a
per
|
Dis
cussion
P
a
per
|
Discussion
P
a
per
|
Discussio
n
P
a
per
3 Results
3.1 PM1time series and bulk chemical composition
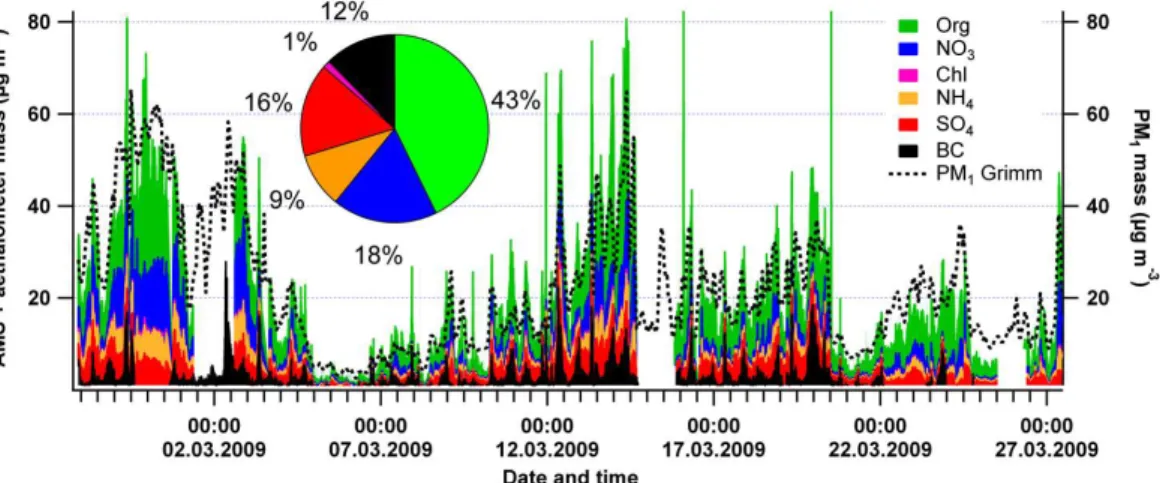
Figure 1 shows the time series of the cumulative mass of organics (Org), nitrate (NO3), chloride (Chl), ammonium (NH4), sulfate (SO4), and BC for the duration of the DAURE campaign. Charges are omitted for AMS nominally inorganic species, because non-5
ionic organosulfates and organonitrates also contribute to their concentrations (Farmer et al., 2010). The beginning of the campaign (25 February 2009–4 March 2009) and the second part (8–25 March 2009) were influenced by typical winter anti-cyclonic conditions in the Western Mediterranean Basin (WMB) which favor the accumulation of pollutants within the planetary boundary layer (PBL). Peak PM1 concentrations of 10
more than 60 µg m−3 were measured. The land/sea breeze cycle strongly influenced the daily evolution of pollutant concentrations during these episodes. The period from 4–8 March 2009 was characterized by Atlantic advection, with strong winds and pre-cipitation on 5 March 2009. Clean air masses coming from the Atlantic renewed the polluted PBL and lowered concentrations (5–15 µg m−3 of PM1). The meteorological 15
diurnal cycle was less distinct. Further details on meteorological and dispersion con-ditions during DAURE can be found in Jorba et al. (2011) and Pandolfi et al. (2011). Since the SMPS was used to estimate the AMS CE, Grimm PM1data were added for comparison purposes. The campaign average concentration value of 18.5 µg m−3 of PM1compares well to 20 µg m−3of PM1measured by combined AMS and aethalome-20
ter data. The coefficients of a least orthogonal distance fit shown in Fig. S2 (a=−3.60,
b=0.99) confirm the good agreement of AMS plus aethalometer vs. Grimm data. The campaign average chemical composition of PM1is shown in the pie chart inset in Fig. 1. The organic fraction makes up the largest part with 43 %, followed by nitrate (18 %), sulfate (16 %), BC (12 %), and ammonium (9 %). Molar ratios of the inorganic 25
ACPD
11, 27383–27420, 2011Identification and quantification of
organic aerosol
C. Mohr et al.
Title Page
Abstract Introduction
Conclusions References
Tables Figures
◭ ◮
◭ ◮
Back Close
Full Screen / Esc
Printer-friendly Version Interactive Discussion
Discussion
P
a
per
|
Dis
cussion
P
a
per
|
Discussion
P
a
per
|
Discussio
n
P
a
per
|
results at other locations (Docherty et al., 2011). Similar results were found by Pandolfi et al. (2011) using 12-h chemically speciated filter data (PM1): excluding the crustal, marine and unidentified fractions from the filter data, organic matter (OM) accounts for 40 %, NO−3 for 15 %, NH+4 and SO24− for 16 % each, and elemental carbon (EC) makes up 14 %. Comparisons of AMS nitrate to PM2.5 nitrate measured by an R&P ambient 5
particulate nitrate monitor (8400N, Rupprecht and Patashnick Co., Inc.) show good agreement (R2=0.92), with the PM2.5nitrate being 30 % higher (not shown).
3.2 PMF: identification of sources/components of organic aerosol (OA)
3.2.1 Factor profiles and time series
For both the UMR and HR organic data matrix, 5 factors could be identified using 10
PMF: low-volatility and semi-volatile oxygenated OA (LV-OOA and SV-OOA, the lat-ter is a recombination of two individual factors, see section below), hydrocarbon-like OA (HOA), biomass burning OA (BBOA), and cooking OA (COA). Since the HR data matrix provides an increased level of information (individual ion signal) compared to the UMR data, factor profiles, time series, and main conclusions are based on the HR 15
PMF solution. However, as there are versions of the AMS that only provide UMR data (aerosol chemical speciation monitor ACSM, Ng et al., 2011b; C-ToF-AMS, Drewnick et al., 2005; quadrupole-AMS, Canagaratna et al., 2007), the UMR PMF solution and a comparison of the UMR and HR PMF solution are presented in the SI, Sects. 3.1 and 3.2. For a discussion of the number of factors chosen and the criteria used to select 20
the best solution, we again refer the reader to the SI, Sects. 3.3–3.4.
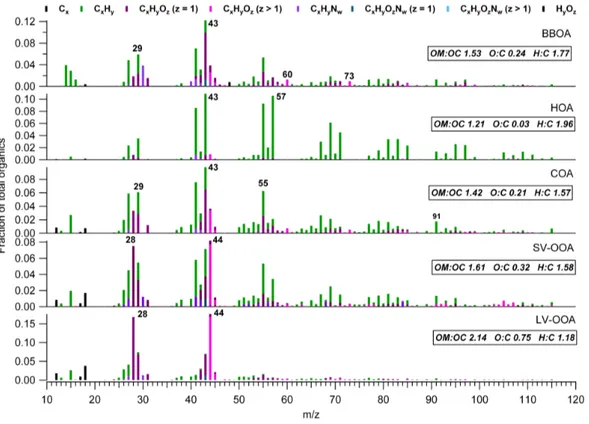
Figure 2 shows the HR mass spectra of the 5 factors. OOA is generally dominated by secondary organic aerosol formed in the atmosphere from gas-to-particle conversion processes of the oxidation products of volatile organic compounds (VOCs, Hallquist et al., 2009). Numerous sources emitting a large number of different organic species 25
ACPD
11, 27383–27420, 2011Identification and quantification of
organic aerosol
C. Mohr et al.
Title Page
Abstract Introduction
Conclusions References
Tables Figures
◭ ◮
◭ ◮
Back Close
Full Screen / Esc
Printer-friendly Version Interactive Discussion
Discussion
P
a
per
|
Dis
cussion
P
a
per
|
Discussion
P
a
per
|
Discussio
n
P
a
per
source fingerprint (Andreae, 2009; Capes et al., 2008). Simultaneously the fraction of m/z44 (CO+2), mostly from the decarboxylation of carboxylic acids, increases (Ng et al., 2010). LV-OOA and SV-OOA factors serve as a basis set for describing the range of physicochemical properties occurring in the dynamic evolution of OOA (Jim ´enez et al., 2009). The LV-OOA spectrum found here features dominant signals atm/z44 5
(with the signal at m/z28 assumed to be equal to m/z44, Aiken et al., 2008). The
R2of its correlation with the standard UMR LV-OOA spectrum from Ng et al. (2011) is 0.96. The dominant ion families are CxHyO and CxHyOz (z>1); the O:C atomic ratio of 0.75 confirms the high degree of oxygenation. This value lies in the middle of the LV-OOA O:C range spanned by the 2-D framework of OA aging (where the oxidation 10
state approximated by the O:C ratio is plotted against the saturation vapor pressure, Jim ´enez et al., 2009). It is in between the O:C ratios of 0.6 of the OOA spectrum found for Mexico City (where no separation of LV-OOA and SV-OOA was possible, Aiken et al., 2010) and 1.02 found for LV-OOA in aircraft measurements in the Mexico city region (DeCarlo et al., 2010). As also found by e.g. Lanz et al. (2007) and DeCarlo 15
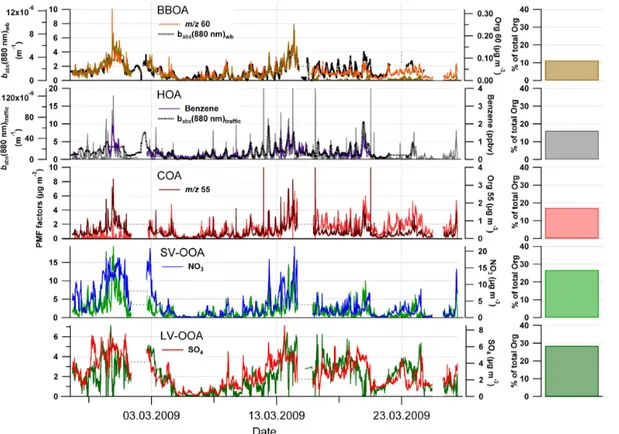
et al. (2010), the LV-OOA time series correlates with that of non-volatile, regionally-transported SO4(see Fig. 3,R2=0.43 for HR). Taken together with the high O:C ratio, this confirms LV-OOA as characteristic of aged, regional aerosol.
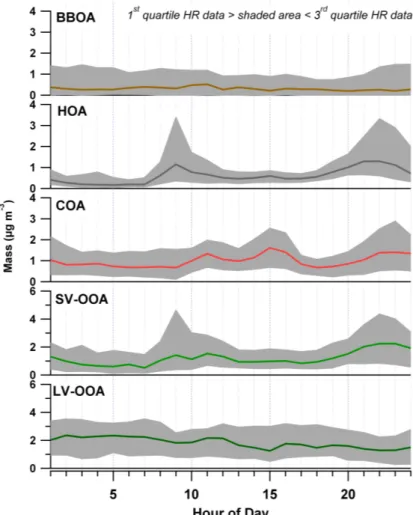
Investigation of the PMF factors’ diurnal patterns helps greatly in their identifica-tion. Apart from varying emission sources and strengths during the course of a day, 20
temperature-driven phenomena such as the sea breeze circulation and boundary layer heights play a very important role for the diurnal evolution of OA components. Figure 4 presents the median hourly concentration and the range spanned by the 1st and the 3rd quartile (shaded area). Consistent with its regional character, LV-OOA does not display a pronounced diurnal pattern.
25
ACPD
11, 27383–27420, 2011Identification and quantification of
organic aerosol
C. Mohr et al.
Title Page
Abstract Introduction
Conclusions References
Tables Figures
◭ ◮
◭ ◮
Back Close
Full Screen / Esc
Printer-friendly Version Interactive Discussion
Discussion
P
a
per
|
Dis
cussion
P
a
per
|
Discussion
P
a
per
|
Discussio
n
P
a
per
|
due to substantial contributions from the non-oxygen-containing ions at e.g.m/z29, 43, and 55. The substantial signal at the ion series CnH+2n+1(m/z29, 43, 57, 71,...) from saturated alkanes and CnH+2n−1 (m/z41, 55, 69,...) from alkenes and cycloalkanes and the diurnal cycle exhibiting the typical rush-hour peaks around 09:00 and 22:00 LT (further increased later due to the decrease in boundary layer height) indicate an influ-5
ence from vehicle emissions. The highest concentrations are measured around 11:00, linked to rapid SOA formation from primary emissions (Reche et al., 2011b). A small peak in the late afternoon, when the photochemical activity is very high, corresponds to the daily maximum of O3 concentrations (Pandolfi et al., 2011). The time series of SV-OOA shows a similar trend as the time series of the semi-volatile nitrate (see 10
Fig. 3,R2=0.22) also seen in other locations (Lanz et al., 2007; DeCarlo et al., 2010); the diurnal patterns of both SV-OOA and NO3 (not shown) indicate that the temporal evolution of both components is rather driven by similar processes such as primary emissions, rapid chemical formation, and the diurnal cycles of land/sea breeze and boundary layer height than gas-to-particle partitioning based on volatility character-15
istics. SV-OOA can thus be described as of more local origin, less processed than LV-OOA.
The HOA factor is related to fossil fuel combustion. Diesel exhaust is typically dominated by recondensed engine lubricating oil and consists mainly of n-alkanes, branched alkanes, cycloalkanes, and aromatics (Canagaratna et al., 2004; Chirico et 20
al., 2010), leading to high signal at the ion series CnH+2n+1 and CnH+2n−1. Especially m/z57 is a major mass fragment and often used as a tracer for HOA (Zhang et al., 2005a). Given the high number of diesel cars in Barcelona (>45 % of the vehicle fleet, Reche et al., 2011b) and proximity to the harbor, both vehicle and ship traffic could contribute to HOA (Murphy et al., 2009). However, the two distinct peaks in the morn-25
ACPD
11, 27383–27420, 2011Identification and quantification of
organic aerosol
C. Mohr et al.
Title Page
Abstract Introduction
Conclusions References
Tables Figures
◭ ◮
◭ ◮
Back Close
Full Screen / Esc
Printer-friendly Version Interactive Discussion
Discussion
P
a
per
|
Dis
cussion
P
a
per
|
Discussion
P
a
per
|
Discussio
n
P
a
per
Correlation of the HOA factor found here with the standard HOA mass spectral pro-file from Ng et al. (2011) yields an R2 value of 0.94. Consistent with the dominance of the reduced hydrocarbon ions (CxHy), the O:C ratio is very low (0.03), compara-ble to Mexico City (0.06, DeCarlo et al., 2010). The H:C elemental ratio (1.96) is the highest among the PMF factors. The HOA time series (Fig. 3) correlates with ben-5
zene (measured by a proton transfer reaction-mass spectrometer PTR-MS, Ionicon Analytik), a natural constituent of gasoline and also formed by combustion (R2=0.66), supporting the identification of traffic as a major HOA source. The fraction of black carbon from traffic emissions was approximated by calculating babs at 880 nm of PM from vehicle exhaust (babs(880 nm)traffic) using the model developed by Sandradewi et 10
al. (2008), with an ˚Angstrom exponentαtraffic=0.9 (Herich et al., 2011). The time series
babs(880 nm)trafficand the HOA time series show a similar trend. However, theR2value of 0.17 is too low to confirm correlation. There are spikes in the HOA time series not caught by the aethalometer model. This can be due to a lower time resolution of the aethalometer compared to the AMS or peaks in the organics time series assigned to 15
HOA without or with lower concurrent BC emissions (i.e. possible variations in HOA/BC emission ratios of various vehicles or other fossil sources in the area). Removing 18 data points from spikes in the HOA times series (see Fig. S24) increases theR2value to 0.52.
BBOA in the Barcelona region can be emitted by regional agricultural open fires or 20
due to long-range transported pollutants from forest or agricultural fires, and possibly also from wood-combustion heating systems in suburban and rural areas (Reche et al., 2011a). Characteristic mass fragments of BBOA spectra arem/z60 and 73, attributed to C2H4O+2 and C3H5O+2, respectively. The ions are fragments of anhydrosugars such as levoglucosan, which are produced during cellulose pyrolysis (Alfarra et al., 2007). 25
ACPD
11, 27383–27420, 2011Identification and quantification of
organic aerosol
C. Mohr et al.
Title Page
Abstract Introduction
Conclusions References
Tables Figures
◭ ◮
◭ ◮
Back Close
Full Screen / Esc
Printer-friendly Version Interactive Discussion
Discussion
P
a
per
|
Dis
cussion
P
a
per
|
Discussion
P
a
per
|
Discussio
n
P
a
per
|
factor found here with the standard BBOA spectrum from Ng et al. (2011) yields an
R2 value of 0.8. BBOA contains high contributions from the oxygen-containing ion families. The O:C ratio of 0.24 is also higher than for the other primary sources, in accordance with findings by e.g. Alfarra et al. (2007) and Aiken et al. (2010). The time series of BBOA shows a similar trend as the babs(880 nm) from wood burning 5
(babs(880 nm)wb), a surrogate for the BC fraction from biomass burning determined with the same method as babs(880 nm)traffic and using αwb=1.9 (Herich et al., 2011; Sandradewi et al., 2008). As the BBOA time series exhibits less spiky data than the HOA time series, the R2 value (0.31) is higher than for babs(880 nm)traffic and HOA without removing the spikes from the fit. The low contribution of wood burning to BC 10
measured in Barcelona (∼10 % according to the aethalometer model) and related to
this the uncertainties of (babs(880 nm)wb) as a function of αwb probably lead to the weak correlation. BBOA exhibits a much smoother diurnal cycle than the other pri-mary sources with no big peaks, which suggests that its sources are mainly outside of the city. As observed by Reche et al. (2011a), concentrations during the night are 15
slightly elevated due to smoke from open agricultural burning and heating systems in the surrounding valleys brought into the city by the land and downslope breezes.
COA has recently been identified as a major contributor to OA in several environ-ments (Allan et al., 2010; Huang et al., 2010; Crippa et al., 2011). The COA spectrum exhibits signal from the same hydrocarbon ion series as the HOA spectrum; however, 20
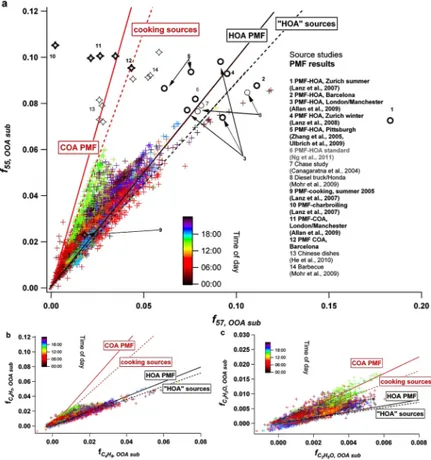
the oxygen-containing ions substantially contribute to e.g.m/z’s 43, 55, and 57, consis-tent with the high degree of oxygenation of fatty acids, which are a major constituent of COA (Mohr et al., 2009; He et al., 2010). Consequently the elemental O:C ratio is higher (0.21) and the H:C ratio lower (1.57) than for HOA. An important mass frag-ment of COA UMR spectra is m/z55 (Lanz et al., 2007; Mohr et al., 2009; Allan et 25
al., 2010). This is also shown by the similarity of the time series of COA andm/z55 (Fig. 3). However, while the regression analysis of the UMR COA andm/z55 yields an
ACPD
11, 27383–27420, 2011Identification and quantification of
organic aerosol
C. Mohr et al.
Title Page
Abstract Introduction
Conclusions References
Tables Figures
◭ ◮
◭ ◮
Back Close
Full Screen / Esc
Printer-friendly Version Interactive Discussion
Discussion
P
a
per
|
Dis
cussion
P
a
per
|
Discussion
P
a
per
|
Discussio
n
P
a
per
2 March 2009), HR COA is lower relative to Org 55, after 15 March 2009 it is higher. Comparison of the COA factor found here with the COA factor from Manchester (Al-lan et al., 2010) results in anR2 of 0.88. The diurnal cycle (Fig. 4) shows that COA concentrations already start to rise during the late morning hours and peak around 15:00 (shortly after Spanish lunch times), when the sea breeze is at a maximum and 5
transports the COA from downtown to the measurement site, and later in the evening around 22:00, shortly after Spanish dinner time, due to the lower nocturnal boundary layer height. The COA diurnal cycle is consistent with those reported in previous stud-ies (Allan et al., 2010; Huang et al., 2010; Sun et al., 2011), with peaks during midday (depending on lunch times of the different countries) and in the later evening.
10
The right panel in Fig. 3 shows the mass of OA explained by the PMF factors. LV-OOA makes up 28 % of OA. SV-LV-OOA contributes 27 % to OA. Together, the secondary fraction accounts for 55 % of OA. This dominance of OOA is consistent with previous findings for various locations in Northern hemisphere midlatitudes and in central Eu-rope (Jim ´enez et al., 2009; Lanz et al., 2010). From the primary components, COA 15
makes up 17 %, HOA 16 %, and BBOA 11 %.
The comparatively small fraction of HOA for Barcelona is surprising given its high traffic density. However, this finding is supported by Minguill ´on et al. (2011), who showed that for this specific winter period, 40 % of the organic carbon (OC) of PM1 was fossil and 60 % non-fossil. Considering the three primary-dominated components 20
and their OM:OC ratios displayed in Fig. 2, we can estimate that 59 % of the carbon in POA in Barcelona is non-fossil while 41 % is fossil. The dominance of non-fossil carbon in urban POA is important for the interpretation of modern carbon measure-ments. Interestingly, the OM:OC ratios of the PMF spectra presented here and the results from Minguill ´on et al. (2011) also suggest a modern carbon fraction of 60 % for 25
ACPD
11, 27383–27420, 2011Identification and quantification of
organic aerosol
C. Mohr et al.
Title Page
Abstract Introduction
Conclusions References
Tables Figures
◭ ◮
◭ ◮
Back Close
Full Screen / Esc
Printer-friendly Version Interactive Discussion
Discussion
P
a
per
|
Dis
cussion
P
a
per
|
Discussion
P
a
per
|
Discussio
n
P
a
per
|
fractions in two UK cities and Paris, respectively. The BBOA fraction found here (abso-lute mean value 0.8 µg m−3 for the whole campaign) is slightly lower than the biomass burning OM estimated from non-fossil EC and typical EC/OC ratios for biomass burning sources (Minguill ´on et al., 2011) or the Multilinear Engine (ME) receptor model applied on filter measurements (Reche et al., 2011a) and slightly above the BBOA concen-5
tration determined by levoglucosan measurements (Minguill ´on et al., 2011). However, compared to the Mexico City region during the dry season when frequent forest fires contribute significantly to PM1 (mean value 2.5 µg m−3 for March 2006, Aiken et al., 2009) or Swiss Zurich winters when wood is burned for domestic heating purposes (PM1BBOA 2.4 and 3.5 µg m−3, Mohr et al., 2011; Lanz et al., 2008), biomass burning 10
is a less important source of OA in Barcelona during winter time.
3.2.2 Size distributions
Figure 5 shows the mean mass size distributions of PM1 components for all periods when the percentage of total organics of either LV-OOA, SV-OOA, COA, HOA or BBOA was above its upper 95 %-percentile and, at the same time, all other PMF factors’ 15
fractions of total organics were below their upper 75 %-percentile. The number of points used in the average and the organic mass fractions of the corresponding factors during those periods are included in Fig. 5. Total AMS mass and SMPS data of the same time periods were added for comparison. The SMPS mass was calculated using an average particle density based on the chemical composition determined by the AMS. 20
The following densitiesρ(g cm−3) were used (Duplissy et al., 2011): for Org,ρ=1.27; for SO4,ρ=1.78; for NO3,ρ=1.72; for NH4,ρ=1.75; and for Chl,ρ=1.4. The SMPS mobility diameter was converted to the vacuum aerodynamic diameter (dva) (DeCarlo et al., 2004) using these densities and assuming spherical particles.
Periods with a larger impact of LV-OOA show a single-mode distribution peaking at 25
ACPD
11, 27383–27420, 2011Identification and quantification of
organic aerosol
C. Mohr et al.
Title Page
Abstract Introduction
Conclusions References
Tables Figures
◭ ◮
◭ ◮
Back Close
Full Screen / Esc
Printer-friendly Version Interactive Discussion
Discussion
P
a
per
|
Dis
cussion
P
a
per
|
Discussion
P
a
per
|
Discussio
n
P
a
per
During high SV-OOA episodes, the size distribution exhibits both a strong accumulation mode and a smaller mode withdva<100 nm. This is most likely due to condensation of fresh secondary OA (Zhang et al., 2005b). Compared to the AMS total mass, the SMPS mass distribution is much broader with a lower accumulation mode peak height, indicating the potential role of non-spherical particles at higher sizes. Potential evap-5
orative losses of semi-volatile species such as ammonium nitrate and SV-OOA in the DMA-CPC system (Gysel et al., 2007) could also lead to this underestimation (the am-monium nitrate fraction is larger during SV-OOA dominated periods than when LV-OOA concentrations are high). The AMS size distribution during high HOA episodes features a bimodal distribution with contributions from particles withdva<100 nm, comparable 10
to the HOA size distribution found by 3-D-factorization of mass spectra from Mexico City (Ulbrich et al., 2011) or based on tracerm/z (Nemitz et al., 2008). The discrep-ancy between AMS and SMPS size distributions at small particle sizes is characteristic of fractal particles (Slowik et al., 2004; DeCarlo et al., 2004), which are produced by combustion sources such as traffic emissions. Different sizing of fractal particles by 15
the SMPS leads to an overestimation of the mass of these particles (DeCarlo et al., 2004). The size distribution during high COA periods resembles more the size distribu-tion of particles during periods dominated by secondary OA, peaking at∼350 nmdva.
A similar single-mode distribution was previously observed by Hildemann et al. (1991) for meat cooking aerosol, with the peak center at around 200 nm mobility diameter. 20
Rogge et al. (1991) explained the formation of PM from (meat) cooking activities by nu-cleation and growth of evaporated grease, which most likely yields spherical particles. For periods when BBOA dominates the organic composition, also ammonium nitrate concentrations are rather high. As shown in Fig. 4, BBOA is slightly increased during nighttime, when lower temperatures favor partitioning of semi-volatile species such as 25
ACPD
11, 27383–27420, 2011Identification and quantification of
organic aerosol
C. Mohr et al.
Title Page
Abstract Introduction
Conclusions References
Tables Figures
◭ ◮
◭ ◮
Back Close
Full Screen / Esc
Printer-friendly Version Interactive Discussion
Discussion
P
a
per
|
Dis
cussion
P
a
per
|
Discussion
P
a
per
|
Discussio
n
P
a
per
|
3.3 Cooking organic aerosol
As described in Sect. 3.2.1, COA and the HOA show clear differences in the ratio of oxygen-containing ions to reduced ions and thus in their degree of oxygenation. However, if only AMS UMR data is available, the detection of COA in ambient air can be difficult due to the similarity of its UMR spectrum with HOA (Mohr et al., 2009). This 5
spectral similarity complicates efforts to resolve distinct HOA and COA factors by PMF and is a likely cause of the scarcity of COA factors resolved from urban AMS datasets (Lanz et al., 2007; Allan et al., 2010; Huang et al., 2010; Slowik et al., 2010; Crippa et al., 2011). However, the substantial contributions of COA to total organic PM1suggest the importance of this anthropogenic activity to urban air quality. Here the spectral 10
characteristics of HOA and COA discussed above are used to develop an approach for distinguishing and quantifying the contributions of HOA and COA to ambient aerosol.
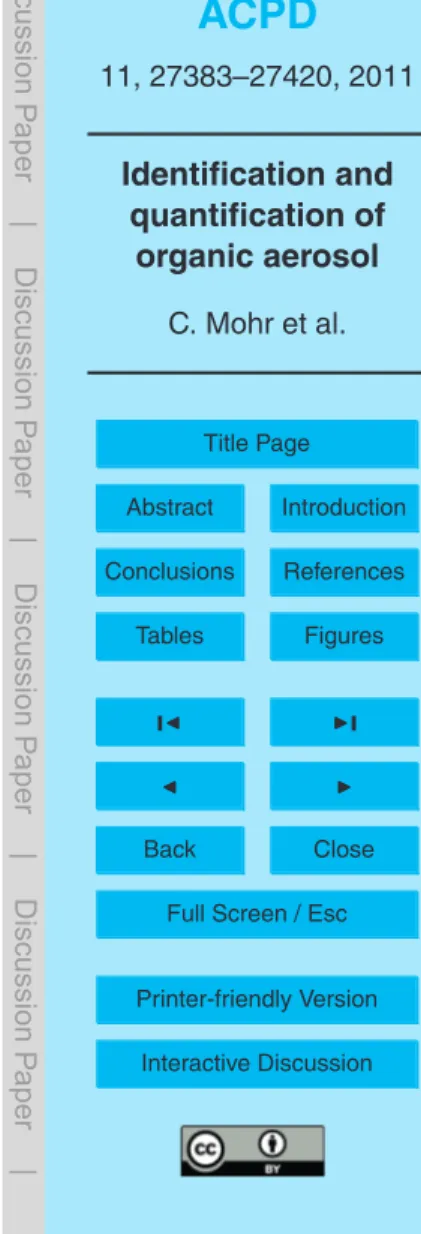
3.3.1 Organic mass fragments 55 and 57
As stated earlier, the organic mass fragments 55 (m/z55) and 57 (m/z57) are crucial for the identification of COA and HOA, respectively. However, these fragments cannot 15
directly serve as tracers because (1) each strongly appears in both factor mass spectra and (2) interferences from LV- and SV-OOA are present, which have to be subtracted (denoted by the subscript “OOAsub”). We therefore define the following quantities:
f55,OOAsub= m/z55−m/z55LV−OOA−m/z55SV−OOA
/Org (1)
f57,OOAsub= m/z57−m/z57LV−OOA−m/z57SV−OOA
/Org (2)
20
ACPD
11, 27383–27420, 2011Identification and quantification of
organic aerosol
C. Mohr et al.
Title Page
Abstract Introduction
Conclusions References
Tables Figures
◭ ◮
◭ ◮
Back Close
Full Screen / Esc
Printer-friendly Version Interactive Discussion
Discussion
P
a
per
|
Dis
cussion
P
a
per
|
Discussion
P
a
per
|
Discussio
n
P
a
per
result. Data points are colored by time of day. Thef55,OOAsub/f57,OOAsubslope is highest in the afternoon, corresponding to the peak in the COA diurnal pattern (see Fig. 4). In contrast, the shallowest slopes are found in the traffic-dominated morning and evening hours.
Figure 6a also includes F55 and F57 from PMF HOA and COA factors (the signal 5
at m/z 55 or m/z 57 in the respective PMF mass spectrum normalized to the sum of the spectrum, bold symbols), as well as from emission spectra of cooking and traf-fic sources (thin symbols). These factors/sources were grouped as “cooking-like” or “traffic-like”, and a linear fit was applied to each group. Point #1, Zurich Summer PMF-HOA (Lanz et al., 2007), was excluded as an outlier. Fits to the cooking-like (red solid 10
and dotted lines) and traffic-like (black solid and dotted lines) follow the higher and lower edges of the Barcelona data in Fig. 6a, which correspond to cooking- and traffi c-influenced data, respectively. This supports the use of thef55,OOAsub/f57,OOAsubratio as a metric for identifying COA.
Figure 2 shows that m/z55 for HOA is composed mostly of a different ion (C4H+7) 15
than COA (C4H+7 and C3H3O+). High resolution source spectra show consistent re-sults; see Fig. S26. Similarly, for HOAm/z57 is composed of C4H+9 while COAm/z57 includes both C4H+9 and C3H5O+. A simplified apportionment of these ions is as-sessed in Fig. 6b and c, where C3H3O+ and C3H5O+ are apportioned to COA, with C4H+7 and C4H+9 apportioned entirely to HOA. These Figures are similar to Fig. 6a, with 20
f55,OOAsub and f57,OOAsub replaced by fC4H+
7,OOAsub and fC4H+9,OOAsub in Fig. 6b, and by
fC3H3O+,OOAsubandfC3H5O+,OOAsubin Fig. 6c. Solid and dashed lines are the same as in
Fig. 6a. HOA and COA are much less distinguishable in Fig. 6b than for the UMR data (6a), with the data points mostly aligned to the HOA fit line. This results from the low ratio offC4H+
7,OOAsub tofC4H+9,OOAsub. In contrast, Fig. 6c shows thatfC3H3O+,OOAsub and 25
fC3H5O+,OOAsubare comparable to the UMR data in their ability to distinguish HOA and
ACPD
11, 27383–27420, 2011Identification and quantification of
organic aerosol
C. Mohr et al.
Title Page
Abstract Introduction
Conclusions References
Tables Figures
◭ ◮
◭ ◮
Back Close
Full Screen / Esc
Printer-friendly Version Interactive Discussion
Discussion
P
a
per
|
Dis
cussion
P
a
per
|
Discussion
P
a
per
|
Discussio
n
P
a
per
|
from LV-OOA and BBOA tom/z55. Although SV-OOA contributions are larger, SV-OOA is readily distinguished by highm/z44 allowing the SV-OOA contribution to m/z55 to be subtracted as done above. HOA has significant signal atm/z55, however, as dis-cussed above, HOA and COA can be distinguished by the oxygen-containing organic ions ofm/z55 and 57. This is shown in Fig. 7b and c: C3H3O+shows lower signal than 5
C4H+7, but that signal is dominated by COA emissions and is thus a more useful tracer.
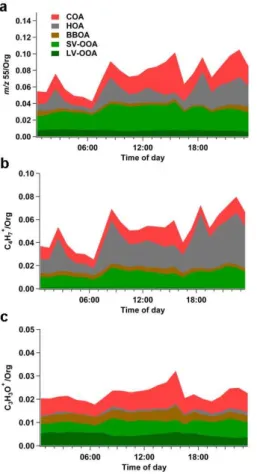
3.3.2 Estimation of COA from Org 55
In this section a simple approximation to estimate the COA concentration based on the time series of the organic mass fragments 55, 57, and 44 is provided. Similar meth-ods to estimate HOA, BBOA, and OOA concentrations have been given by Aiken et 10
al. (2009). As described in the previous section, m/z55 can be used as a tracer for COA, even though its signal also has contributions from the other factors, mostly HOA and OOA (Eq. 2). BBOA can contribute as well tom/z55; however, due to the high vari-ability wood burning spectra (Weimer et al., 2008) and the low BBOA concentrations in Barcelona it was not considered in the estimation.
15
m/z55=m/z55(COA)+m/z55(HOA)+m/z55(OOA) (3) Consequently, the contributions from the other factors have to be subtracted and the remainingm/z55(COA) has to be scaled up by a factorq to yield the estimated COA concentration COAest,
COAest=q·m/z55(COA) (4)
20
The contribution from OOA tom/z55 is linear withm/z44,
m/z55(OOA)=b·m/z44 (5)
where
b=F55,OOA
F44,OOA
ACPD
11, 27383–27420, 2011Identification and quantification of
organic aerosol
C. Mohr et al.
Title Page
Abstract Introduction
Conclusions References
Tables Figures
◭ ◮
◭ ◮
Back Close
Full Screen / Esc
Printer-friendly Version Interactive Discussion
Discussion
P
a
per
|
Dis
cussion
P
a
per
|
Discussion
P
a
per
|
Discussio
n
P
a
per
F55,OOAdenotes the signal atm/z55 in the OOA mass spectrum normalized to the sum of the spectrum.
The contribution from HOA tom/z55 is linear withm/z57,
m/z55(HOA)=a·m/z57(HOA) (7)
where 5
a=F55,HOA
F57,HOA
(8)
m/z57 can have contributions not only from HOA, but also from COA and OOA; thus:
m/z57(HOA)=m/z57−m/z57(COA)−m/z57(OOA) (9) The last term in Eq. (8) is again linear withm/z44, with the coefficient
c=F57,OOA
F44,OOA
(10) 10
With
m/z57(COA)= 1
d ·m/z55(COA) (11)
d=F55,COA
F57,COA. (12)
Equation (3) can be solved as
COAest=q· "1
am/z55−m/z57+ c− b a
m/z44 1
a−1d
#
(13) 15
with
q= 1
ACPD
11, 27383–27420, 2011Identification and quantification of
organic aerosol
C. Mohr et al.
Title Page
Abstract Introduction
Conclusions References
Tables Figures
◭ ◮
◭ ◮
Back Close
Full Screen / Esc
Printer-friendly Version Interactive Discussion
Discussion
P
a
per
|
Dis
cussion
P
a
per
|
Discussion
P
a
per
|
Discussio
n
P
a
per
|
The coefficientsa,b,c,d, and qwere estimated using the PMF factor mass spectra from this study and those published in Allan et al. (2010), and Crippa et al. (2011):
q=11±2; a=0.9±0.2; b=0.15±0.1; c=0.07±0.07; and d=3.0±0.7. The
ap-proach was tested with the present data set. Figure 8 shows a comparison of PMF COA (both UMR and HR) found here with COAest calculated using Eq. (12). Overall, 5
the agreement is good: The correlation of the UMR PMF COA time series and COAest yields anR2 of 0.7; theR2 of the correlation with the HR solution is lower (0.32) due to the period in the beginning, until 2 March 2009 (compare Sect. 3.2.1). Removing the Barcelona data (a=0.8, b=0.12, c=0.03, d=2.2, and q=10) from the average coefficients calculation did not change the values fora,b,c,d, andq; thus, the com-10
parison between COAest and PMF COA is not positively biased by the double use of the same data set. The application of this approach to other datasets will be of great interest to validate the coefficients found here.
4 Conclusions
Several studies confirm the possible importance of cooking activities as a major con-15
tributor to urban aerosol loadings; however, the number of urban environments where COA was detected and quantified is still very low. A reason for that might be the sim-ilarity of AMS UMR spectra of HOA and COA. This paper presents an approach to detect cooking organic aerosol (COA) in ambient datasets and a simple method based on organic mass fragments 55, 57, and 44 measured by AMS to estimate COA con-20
centrations.
AMS data were acquired at an urban background site in Barcelona, Spain, during March 2009, in order to investigate the specific high PM winter anticyclone episodes. PMF analysis revealed 5 factors or sources contributing to OA: LV-OOA, related to re-gional, aged secondary OA; SV-OOA, a first-generation secondary OA with substantial 25
ACPD
11, 27383–27420, 2011Identification and quantification of
organic aerosol
C. Mohr et al.
Title Page
Abstract Introduction
Conclusions References
Tables Figures
◭ ◮
◭ ◮
Back Close
Full Screen / Esc
Printer-friendly Version Interactive Discussion
Discussion
P
a
per
|
Dis
cussion
P
a
per
|
Discussion
P
a
per
|
Discussio
n
P
a
per
emissions); BBOA from domestic heating or agricultural wood burning activities; and COA (cooking organic aerosol). From these results we estimate that POA in Barcelona has a non-fossil carbon fraction of about 59 %, which helps explain the high non-fossil fraction of OC observed during DAURE.
The COA HR spectrum contains considerable signal from oxygenated ions whereas 5
the HR HOA spectrum has almost exclusively contributions from chemically reduced ions, however, on a UMR basis, the spectral patterns are very similar. Plotting m/z 55 normalized to total organics against m/z 57 normalized to total organics helps identify COA in ambient datasets: The data points fall into a V-shape, with HOA-influenced data aligned to the lower arm, a line defined by fittingF55 and F57 from various PMF HOA 10
and vehicle emissions spectra; COA influenced data points lie on the upper arm of the V-shape denoted by a fit ofF55 andF57 from PMF COA factors and cooking emissions spectra. HR data show that this differentiation is mainly driven by the oxygen-containing ions C3H3O+ and C3H5O. C3H3O+ shows lower signal than C4H+7, but that signal is to a larger extent from COA emissions than that from C4H+7 compared to the other factors, 15
and thus helps identifying the COA factor much better than C4H+7.
The agreement of COA estimated based on mass fragments 55, 57, and 44 and the PMF COA is satisfying for the present dataset. The application of this approach to other datasets will be of great interest to validate the coefficients determined in this study.
20
COA contributes 17 % to organic PM in Barcelona during the winter anticyclonic pollution episodes, consistent with the high non-fossil fraction of carbonaceous PM1 found by 14C analysis. This is a significant fraction with consequences for human health; even more so since cooking is usually an indoor activity and what is being measured at an urban background site is already significantly diluted compared to the 25
ACPD
11, 27383–27420, 2011Identification and quantification of
organic aerosol
C. Mohr et al.
Title Page
Abstract Introduction
Conclusions References
Tables Figures
◭ ◮
◭ ◮
Back Close
Full Screen / Esc
Printer-friendly Version Interactive Discussion
Discussion
P
a
per
|
Dis
cussion
P
a
per
|
Discussion
P
a
per
|
Discussio
n
P
a
per
|
Supplementary material related to this article is available online at: http://www.atmos-chem-phys-discuss.net/11/27383/2011/
acpd-11-27383-2011-supplement.pdf.
Acknowledgements. We thank the organizers of the DAURE project, including Mar Viana and everybody else at ICTJA for their work and help. We acknowledge the CCES project
IMBAL-5
ANCE and the EU-FP7 project EUCAARI for financial support and “Accion Complementaria DAURE” from the Spanish Ministry of Science and Innovation (CGL2007-30502-E/CLI) for in-frastructure support. P. F. DeCarlo is grateful for the postdoctoral support from the US-NSF (IRFP# 0701013). J. Pe ˜nuelas and R. Seco were supported by the Spanish Government projects CGL2010-17172 and Consolider Ingenio Montes (CSD2008-00040). J. L. Jim ´enez
10
was supported by NSF ATM-0919189 and DOE (BER, ASR program) DE-FG02-11ER65293.
References
Aiken, A. C., Salcedo, D., Cubison, M. J., Huffman, J. A., DeCarlo, P. F., Ulbrich, I. M., Docherty, K. S., Sueper, D., Kimmel, J. R., Worsnop, D. R., Trimborn, A., Northway, M., Stone, E. A., Schauer, J. J., Volkamer, R. M., Fortner, E., de Foy, B., Wang, J., Laskin, A., Shutthanandan,
15
V., Zheng, J., Zhang, R., Gaffney, J., Marley, N. A., Paredes-Miranda, G., Arnott, W. P., Molina, L. T., Sosa, G., and Jim’enez, J. L.: Mexico City aerosol analysis during MILAGRO using high resolution aerosol mass spectrometry at the urban supersite (T0) – Part 1: Fine particle composition and organic source apportionment, Atmos. Chem. Phys., 9, 6633–6653, doi:10.5194/acp-9-6633-2009, 2009.
20
Ajuntament de Barcelona: Dades b `asiques 2006, Direcci ´o de serveis de mobilitat, Barcelona, 2007.
Alfarra, M. R., Pr ´ev ˆot, A. S. H., Szidat, S., Sandradewi, J., Weimer, S., Lanz, V. A., Schreiber, D., Mohr, M., and Baltensperger, U.: Identification of the mass spectral signature of organic aerosols from wood burning emissions, Environ. Sci. Technol., 41, 5770–5777, 2007.
25
ACPD
11, 27383–27420, 2011Identification and quantification of
organic aerosol
C. Mohr et al.
Title Page
Abstract Introduction
Conclusions References
Tables Figures
◭ ◮
◭ ◮
Back Close
Full Screen / Esc
Printer-friendly Version Interactive Discussion
Discussion
P
a
per
|
Dis
cussion
P
a
per
|
Discussion
P
a
per
|
Discussio
n
P
a
per
Baltensperger, U., Chirico, R., DeCarlo, P. F., Dommen, J., Gaeggeler, K., Heringa, M. F., Li, M. L., Pr ´ev ˆot, A. S. H., Alfarra, M. R., Gross, D. S., and Kalberer, M.: Recent developments in the mass spectrometry of atmospheric aerosols, Eur. J. Mass Spectrom., 16, 389–395, 2010.
Crippa, M., DeCarlo, P. F., Mohr, C., Heringa, M. F., Chirico, R., Slowik, J. G., Poulain, L.,
5
Wiedensohler, A., Freutel, F., Drewnick, F., Schneider, J., Di Marco, C. F., Nemitz, E., Zim-mermann, R., Els ¨asser, M., Pr ´ev ˆot, A. S. H., and Baltensperger, U.: Wintertime aerosols chemical composition and source apportionment in the metropolitan area of Paris, in prepa-ration, 2011.
DeCarlo, P. F., Slowik, J. G., Worsnop, D. R., Davidovits, P., and Jim’enez, J. L.:
10
Particle morphology and density characterization by combined mobility and aerody-namic diameter measurements. Part 1: Theory, Aerosol. Sci. Technol., 38, 1185–1205, doi:10.1080/027868290903907, 2004.
DeCarlo, P. F., Kimmel, J. R., Trimborn, A., Northway, M. J., Jayne, J. T., Aiken, A. C., Go-nin, M., Fuhrer, K., Horvath, T., Docherty, K. S., Worsnop, D. R., and Jim ´enez, J. L.:
15
Field-deployable, high-resolution, time-of-flight aerosol mass spectrometer, Anal. Chem., 78, 8281–8289, 2006.
DeCarlo, P. F., Ulbrich, I. M., Crounse, J., de Foy, B., Dunlea, E. J., Aiken, A. C., Knapp, D., Weinheimer, A. J., Campos, T., Wennberg, P. O., and Jim ´enez, J. L.: Investigation of the sources and processing of organic aerosol over the Central Mexican Plateau from aircraft
20
measurements during MILAGRO, Atmos. Chem. Phys., 10, 5257–5280, doi:10.5194/acp-10-5257-2010, 2010.
Docherty, K. S., Aiken, A. C., Huffman, J. A., Ulbrich, I. M., DeCarlo, P. F., Sueper, D., Worsnop, D. R., Snyder, D. C., Grover, B. D., Eatough, D. J., Goldstein, A. H., Ziemann, P. J., and Jim ´enez, J. L.: The 2005 Study of Organic Aerosols at Riverside (SOAR-1): instrumental
25
intercomparisons and fine particle composition, Atmos. Chem. Phys. Discuss., 11, 6301– 6362, doi:10.5194/acpd-11-6301-2011, 2011.
Duplissy, J., DeCarlo, P. F., Dommen, J., Alfarra, M. R., Metzger, A., Barmpadimos, I., Pr ´ev ˆot, A. S. H., Weingartner, E., Tritscher, T., Gysel, M., Aiken, A. C., Jim ´enez, J. L., Canagaratna, M. R., Worsnop, D. R., Collins, D. R., Tomlinson, J., and Baltensperger, U.: Relating
hygro-30
scopicity and composition of organic aerosol particulate matter, Atmos. Chem. Phys., 11, 1155–1165, doi:10.5194/acp-11-1155-2011, 2011.
ACPD
11, 27383–27420, 2011Identification and quantification of
organic aerosol
C. Mohr et al.
Title Page
Abstract Introduction
Conclusions References
Tables Figures
◭ ◮
◭ ◮
Back Close
Full Screen / Esc
Printer-friendly Version Interactive Discussion
Discussion
P
a
per
|
Dis
cussion
P
a
per
|
Discussion
P
a
per
|
Discussio
n
P
a
per
|
J., and Jim ´enez, J. L.: Response of an aerosol mass spectrometer to organonitrates and organosulfates and implications for atmospheric chemistry, P. Natl. A. Sci., 107, 6670–6675, doi:10.1073/pnas.0912340107, 2010.
Fortmann, R., Kariher, P., and Clayton, R.: Indoor air quality: Residential cooking exposures. Final report., State of California Air Resources Board, Research Division, Sacramento, CA,
5
2001.
Goldstein, A. H. and Galbally, I. E.: Known and unexplored organic constituents in the earth’s atmosphere, Environ. Sci. Technol., 41, 1514–1521, 2007.
Gray, H. A.: Control of atmospheric fine primary carbon particle concentrations. Final report for California Air Resources Board., Environmental Quality Laboratory, California Institute of
10
Technology, Pasadena, 353 pp., 1986.
Gysel, M., Crosier, J., Topping, D. O., Whitehead, J. D., Bower, K. N., Cubison, M. J., Williams, P. I., Flynn, M. J., McFiggans, G. B., and Coe, H.: Closure study between chemical compo-sition and hygroscopic growth of aerosol particles during TORCH2, Atmos. Chem. Phys., 7, 6131–6144, doi:10.5194/acp-7-6131-2007, 2007.
15
Herich, H., Hueglin, C., and Buchmann, B.: A 2.5 year’s source apportionment study of black carbon from wood burning and fossil fuel combustion at urban and rural sites in Switzerland, Atmos. Meas. Tech., 4, 1409–1420, doi:10.5194/amt-4-1409-2011, 2011.
Hildemann, L. M., Markowski, G. R., Jones, M. C., and Cass, G. R.: Submicrometer aerosol mass distributions of emissions from boilers, fireplaces, automobiles, diesel trucks, and
20
meat-cooking operations, Aerosol. Sci. Tech., 14, 138–152, 1991.
IPCC: Fourth Assessment Report: The Physical Science Basis, working group I, Final report, Geneva, Switzerland, available at: http://www.ipcc.ch/ipccreports/ar4-wg1.htm, 2007. Jorba, O., Pandolfi, M., Spada, M., Baldasano, J. M., Pey, J., Alastuey, A., Arnold, D., Sicard,
M., Arti ˜nano, B., Revuelta, M. A., and Querol, X.: The DAURE field campaign: meteorological
25
overview, Atmos. Chem. Phys. Discuss., 11, 4953–5001, doi:10.5194/acpd-11-4953-2011, 2011.
Lanz, V. A., Alfarra, M. R., Baltensperger, U., Buchmann, B., Hueglin, C., and Pr ´ev ˆot, A. S. H.: Source apportionment of submicron organic aerosols at an urban site by factor analytical modelling of aerosol mass spectra, Atmos. Chem. Phys., 7, 1503–1522,
doi:10.5194/acp-7-30
1503-2007, 2007.