Institute of Oceanology Polish Academy of Sciences, Powstancow Warszawy 55, 81-712 Sopot, Poland Correspondence to:W. Walczowski ([email protected])
Received: 14 May 2013 – Published in Ocean Sci. Discuss.: 2 July 2013
Revised: 17 September 2013 – Accepted: 4 October 2013 – Published: 14 November 2013
Abstract.The structures of the hydrographic fronts separat-ing the Atlantic-origin waters from ambient waters in the northern Nordic Seas are discussed. Flows of the western and eastern branches of the West Spitsbergen Current cre-ate the Atlantic domain borders and maintain these fronts. This work is based on previous research and on investigations carried out in the project DAMOCLES (Developing Arctic Modelling and Observational Capabilities for Long-term En-vironmental Studies). Most of the observational data were collected during the R/VOceaniacruises. The main focus of the paper is the western border of the Atlantic domain – the Arctic Front, alongfrontal and transfrontal transports, and the front instability and variability. The alongfrontal baro-clinic jet streams were described as a significant source of the Atlantic Water and heat in the Nordic Seas. The baro-clinic instability and advection of barobaro-clinic eddies which occurs due to this instability were found to be the main transfrontal transport processes. Most of the Atlantic Wa-ter transported by the wesWa-tern branch recirculates west and southward. The eastern branch of the West Spitsbergen Cur-rent provides most of the Atlantic Water entering the Arctic Ocean. Both processes are very important for the Arctic and global thermohaline circulation.
1 Introduction
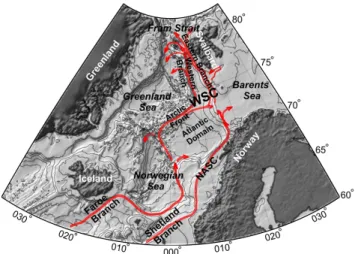
Most of the Atlantic Water (AW) that enters the Nordic Seas (the Norwegian, Greenland, and Iceland seas) flows over the Faroe–Iceland Ridge and between the Faroe and Shetland Islands (Hansen and Osterhus, 2000). There are two main branches of the AW inflow east of Iceland. The colder, less saline western branch (the Faroe branch) of the Norwegian Atlantic Current is topographically guided from the Iceland– Faroe Front towards the Fram Strait (Fig. 1). In the Nordic
Seas, it acts as the jet of the Polar Front (Orvik and Ni-iler, 2002). The warmer, more saline eastern branch of the AW (the Shetland branch) enters the Nordic Seas through the Faroe-Shetland Channel and continues north along the Nor-wegian shelf edge as the NorNor-wegian Atlantic Slope Current (NASC) (Orvik and Skagseth, 2003). After passing north-ern Norway, the NASC branches. One stream of the AW in the NASC enters the Barents Sea as the North Cape Current (the Barents Sea Branch) and flows into the Arctic Ocean (AO), mostly through the St. Anna Trough east of the Franz Josef Land (Schauer et al., 2002; Maslowski et al., 2004). The second branch, which continues north along the conti-nental slope, is called the West Spitsbergen Current (WSC) (Aagaard and Carmack, 1989). Nowadays this flow is often called the WSC eastern branch or the core of the WSC; corre-spondingly, the continuation of the Faroe branch linked with the oceanic frontal system is called the WSC western branch. For clarity and work consistency, the names WSC eastern branch (WSCeast) and WSC western branch (WSCwest) will be used herein. These two currents and hydrological fronts related to both branches of the WSC create dynamic borders of the region occupied by the AW – the Atlantic domain (AD) of the Nordic Seas (Fig. 1). There is a large-scale oceanic front in the west, and a shallow-water, local-scale front in the east. Both fronts separate the Atlantic-origin waters from the ambient, much colder and fresher water masses.
Fig. 1.Nordic Seas bottom topography and Norwegian Atlantic Current – West Spitsbergen Current system.
masses – is related to the importance of all of the Nordic Seas for the global climate.
Fronts create the barrier between waters of different prop-erties and origin. There are strong horizontal gradients of all properties across a front. Contact between water masses of various densities generates alongfrontal baroclinic jet streams, which keeps the front in the dynamic equilibrium state (Fedorov, 1986). This frontal barrier is not fixed – frontal zone changes its position, and water mixes and ex-changes across the front. In the case of the Atlantic domain in the Greenland Sea, processes of transfrontal exchange, espe-cially through the western border, are very important. They are the most vital part of the northern limb of the Atlantic Meridional Overturning Circulation (AMOC). Water masses formed in the Nordic Seas and the Arctic Ocean supply the Greenland–Scotland Ridge overflow and maintain the lower limb of the AMOC (Kuhlbrodt et al., 2007).
Existence of the intensive northward current over the Mohn and Knipovich Ridges has been postulated for a long time. Old maps of Alekseev and Isothin from 1955 showed 3 branches of the Norwegian Atlantic Current (NwAC); in Wegner’s map from 1973, the North Atlantic Current splits into 2 branches of the Norwegian Atlantic Current at the latitude of southern Norway (Dietrich et al., 1980). The branches join west of Svalbard (Fig. 2). In addition, re-search (Piechura and Walczowski, 1995; Walczowski, 1998) at the Institute of Oceanology, Polish Academy of Sciences (IOPAN) suggested the existence of the second WSC branch formed by the baroclinic alongfrontal jet streams.
For a long time the role of these flows was not appreci-ated. The common mistake made by all authors was to claim that both NwAC branches originated from only one AW in-flow through the Faroe-Shetland Channel. Monitoring the Faroe branch (Hansen et al., 1999) of Atlantic inflow over the Greenland–Scotland Ridge in late 1990s helped our
un-Fig. 2.Scheme of water transport (in 106m3s−1)in the layer 0– 1000 m in the northern North Atlantic Ocean. (Derived from Weg-ner, 1973). After Dietrich et al. (1980).
derstanding of the AW pathways in the Nordic Seas. Since then, the properties and variability of the AW inflow into the Nordic Seas have been studied by several authors (e.g. Hansen et al., 2003, Larsen et al., 2012). The structure of the AW pathways in the Nordic Seas were also explored, e.g. by Mork and Blindheim (2000), Orvik et al. (2001), Nilsen and Nilsen (2007), and Skagseth et al. (2008).
In this work, the frontal structures bordering the northern part of the AD, and several processes occurring there, are described. The additional aim of this study is to define the relative importance of the hydrographic fronts separating the Atlantic Waters in the Nordic Seas from other water masses. The data sets used and the applied methods are introduced in Sect. 2. In Sect. 3, the structure of the AD is described. Section 4 provides a description of the western AD border, and Sect. 5 refers to the eastern AD border. Section 6 gives a general description of the variability of the Arctic and Po-lar fonts, whereas Sect. 7 focuses specificially on the fonts’ structure in the Fram Strait and further north. Section 8 sum-marises the main conclusions of the present study.
2 Data and methods
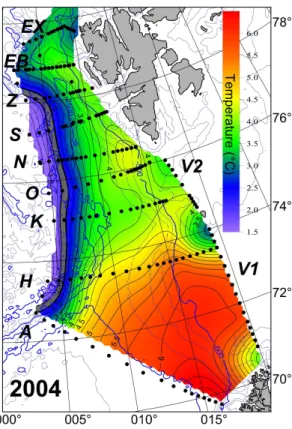
Fig. 3.Temperature at the 200 m level. Positions of the CTD profiles and section names are marked. The Arctic Front position is marked by the grey line.
properties and water modification. During the R/VOceania cruises, vertical profiles along standard sections (Fig. 3) are performed. The zonal sections are perpendicular to the gen-eral direction of the AW advection. Two meridional sections close the AW inflow into the Barents Sea. IOPAN’s main ef-forts focus on the northern part of the AD, where processes controlling the AW inflow into the Arctic Ocean through the Fram Strait and westward recirculation take place. Herein the part of the Atlantic domain between the latitudes of 74◦N and 79◦N is described.
The same station grid was used during the EU project DAMOCLES (Developing Arctic Modelling and Observing Capabilities for Long-term Environmental Studies). During 4 yr of the project, measurements at more than 800 station were taken. All observations were carried out in summer and the gathered data allow only for the summer-to-summer vari-ability analysis.
The equipment used for measurements include Sea-Bird CTD (SBE 911+) with duplicate temperature and conductiv-ity sensors (since 2008) and the Lowered Acoustic Doppler Current Profiler (LADCP) (since 2005). Every year the tem-perature and conductivity sensors are calibrated by the Sea-Bird Electronics service.
The data from the same sections covered by the mea-surements in summers (20 June–20 July) 2000–2010 were
The current vectors indicate only the baroclinic component of the flow, but offer a good representation of the general pat-tern of the flow (Walczowski et al., 2005). The heat content was calculated with reference to a temperature of−0.1◦C. This is chosen for consistency with previous studies; it is a commonly used reference temperature for the heat transport and heat content calculations in the Arctic, adopted after Aa-gaard and Greisman (1975). For the years 2005–2010, CTD data from the Norwegian Gimsøy Section, provided by the Institute of Marine Research, Bergen, were also used. Ad-ditionally, in order to provide an explanation of the frontal mesoscale structures, data from the process-oriented experi-ments performed by IOPAN in summers 1995 and 1996 were used.
Lowered Acoustic Doppler Profiler data were applied as well. The downward-looking LADCP was attached to the CTD rosette. The results were processed with the LDEO IX software for Matlab (Thurnherr, 2007).
There are several water-mass characteristics in the Nordic Seas. Herein the AW was defined as warmer than 0◦C and more saline than 34.92. In practice, in the majority of casts, both the upper and lower limits of the analysed water column were determined by salinity, and the mean properties of the AW layer were calculated for the water column satisfying the conditionS≥34.92. For comparison with other works, characterisation of the AW as water warmer than 2◦C and more saline than 34.90 was also applied.
3 The Atlantic domain structure and currents pattern
hundred metres; the Arctic domain is deeper than the Atlantic one.
The eastern border of the AD is limited by shallow waters. South of the 74◦N parallel, between the North Cap and the Bear Island, a part of the AW advects eastward through the Barents Sea Opening – a trench in the Barents Sea slope of a depth of ca. 480 m. North of the 74◦N parallel, the eastern AW boundary is formed by the Barents Sea and the western Spitsbergen slopes and shelves.
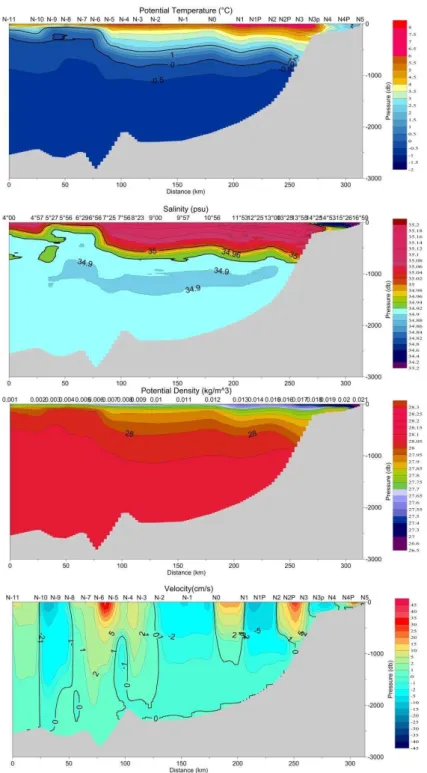
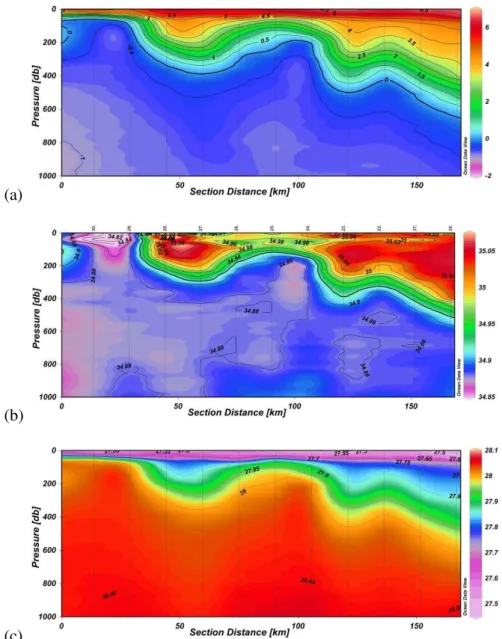
Along the AD borders, two branches of the WSC continue. The eastern branch continues as an intensive, narrow flow with a core over the 800 m isobath. The AW temperature and salinity reach the maximum in this stream. Eastward tilt and deepening of the2,S, andδisolines (Fig. 4a, b, c) indicate the existence of the northward current’s baroclinic compo-nent; baroclinic velocities exceed 25 cm s−1 (Fig. 4d). The
AW occupies also the outer part of the shelf where the local front between the AW and the Polar Water exists. The west-ern branch, continuing over the ridges, is maintained by the baroclinic frontal jet streams. The baroclinic front is mani-fested by shallowing of all isolines (Fig. 4, 80–100 km) or even by outcropping of isolines. In this branch the northward stream is wide, less concentrated than that in the eastern side, nevertheless, the baroclinic component of the northward flow reaches 40–50 cm s−1.
Changes of the bottom topography and convergence of iso-baths in the northern part cause confluence of both WSC streams at 78◦N and narrowing of the AD (Walczowski et al., 2005). Continuing north of the 78◦N parallel, the streams diverge and divide into paths which inflow the AO or recir-culate westward (Fig. 1). Correspondingly to the shape of the borders, the AD forms a wedge which is wide in the south-ern part and narrow in the north (Fig. 3). The width of the AD in the south, near the Bear Island latitude, amounts to 350–400 km, whereas in the vicinity of the Fram Strait, the width decreases to 100 km. Depending on the region and the AW definition, the thickness of the AW layer reaches 800– 1000 m (Fig. 4). The vertical gradients of properties (ther-mocline, halocline, pycnocline) separate the AW layer from intermediate waters (Fig. 5).
The AW flow between main streams is slower and fol-lows in both directions. The mesoscale activity with mostly anticyclonic eddies is intensive. Numerous flow reversals in the central part result in comparatively small volume trans-ports, considering the large areas covered by the AW. This causes small average northward velocities in the Atlantic do-main despite the relatively high local speeds (Cisewski et al., 2003). Indeed, the mean signal propagation velocities are es-timated to be between 2 cm s−1and 4 cm s−1(Furevik, 2000;
Cisewski et al., 2003; Walczowski and Piechura, 2007). West of the AF, the return Atlantic Water (rAW) occurs. This water mass originates from the AW recirculated in the Fram Strait and the Arctic Ocean or transported across the AF. The salinity and temperature of the rAW are lower, and the thickness of the rAW is less, than the salinity,
tempera-ture, and thickness of the AW on the east side of the front, and the rAW frequently forms mesoscale, anticyclonic eddies.
4 Western boundary of the AD: Arctic Front and western branch of the WSC
4.1 Structure of the Arctic Front
Between the Polar domain occupied by the water carried directly from the AO by the East Greenland Current and Atlantic domain, there is a region called the Arctic do-main. This domain, containing the cyclonic Greenland Sea Gyre, is bounded by large-scale climatological fronts. On the east the front is formed by the confluence of the Arc-tic and the AtlanArc-tic-origin water masses. There are various names for this structure: the Polar Front (Orvik and Niiler, 2002), the Polar Ocean Front (Johannessen, 1986), the Arc-tic Frontal Zone (van Aken et al., 1995). Herein, we call it, after Swift (1986), the Arctic Front (AF), to distinguish be-tween this front and the border bebe-tween the Polar and Arc-tic waters, usually called the Polar Front (PF). Both terms may be also confusing, because the names “Arctic Front” and “Polar Front” are moreover used for the local front which bounds the Atlantic domain on the east side. Herein we call this structure the Polar Front (Sect. 5.1), because the WSC eastern branch is adjacent to Barents Sea waters or Svalbard coastal waters of a more polar nature (cold and fresh). The AF is an 800 km long and 40–80 km-wide zone of strong horizontal and vertical gradients of all properties. Baroclinic jet streams maintain flows on both sides of the front. Some authors (van Aken et al., 1995) define the AF as the multi-frontal zone with the cold Greenland Sea Gyre in the west, the AW jet streams in the east, and a band of mesoscale ed-dies in between. From the south, the front is a continuation of the Iceland–Faroe Front; in the north, the front bifurcates in the Fram Strait region. Horizontal dimensions of the AF are compared with geophysical scales and the front can be clas-sified as a macroscale climatic phenomenon (Fedorov, 1986). In the Nordic Seas, circulation tends to follow f/H con-tours (Hopkins, 1991). Also the AF is strongly related to the bottom topography. This indicates that the large-scale defor-mation field responsible for the frontogenesis has to be of a barotropic nature (Spall, 1997). The Acoustic Doppler Cur-rent Profiler (ADCP) and LADCP measurements confirm the existence of the barotropic component of flow in the WSC (Osinski et al., 2003; Walczowski et al., 2005). In the west-ern branch, the barotropic currents reach up to 5 cm s−1.
‘N’ cross the Atlantic domain, along the latitude 76°30’ N, between
meridians 004° E and 017° E. (a) Potential temperature, (b) salinity, (c) potential density and
Fig. 4.Section “N” cross the Atlantic domain, along the latitude 76◦30′N, between meridians 004◦E and 017◦E.(a)Potential temperature, (b)salinity,(c)potential density and(d)baroclinic currents fields in summer 2009. The 200 m thick layer of the return AW west of the AF is visible.
The intermediate and deep waters are located below the AW cover. The Arctic Waters are cold, less saline, and denser.
Horizontal gradients of all properties occur under the sur-face mixed layer at the level of 100–700 dbar. Maximal hor-izontal gradients occur at 200–300 dbar but even here they are rather small in comparison with other climatic fronts
(Fe-dorov, 1986). In the AF, the horizontal gradients of tempera-ture, salinity and density reach values of 0.30–0.40◦C km−1,
0.02–0.03 km−1and 0.01 kg m−3km−1. The weak horizontal
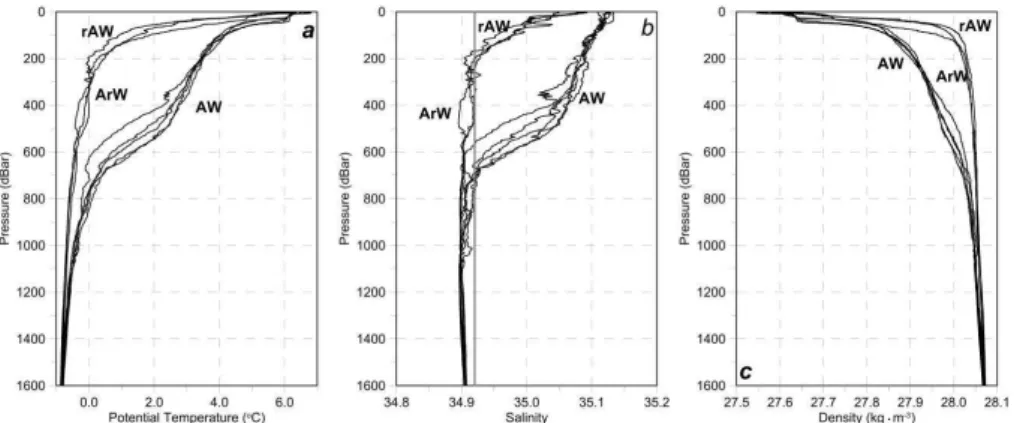
Summer 2009, section ‘N’. Atlantic Water has been indicated by ‘AW’ by ‘rAW’, Arctic Water by ‘ArW’
Fig. 5.Profiles of(a)temperature,(b)salinity and(c)density from the both sides of the Arctic Front (AF). Summer 2009, section “N”. Atlantic Water is indicated by “AW”, return Atlantic Water by “rAW”, and Arctic Water by “ArW”. A vertical line indicatingS=34.92 has been added in the salinity scale.
In summer 2009, at the latitude of 76◦30′N and the level of 200 dbar, the temperature was 0.4◦C and 3.4◦C, salinity was 34.92 and 35.07 and potential density was 28.02 kg m−3
and 27.90 kg m−3 for the shelf and Atlantic sides,
respec-tively. This results in a horizontal temperature gradient of 0.24◦C km−1, a salinity gradient of 0.011 km−1, and a
den-sity gradient of 0.0095 kg m−3km−1. There is a positive
cor-relation between the temperature and salinity fields: an in-crease in water temperature is linked with an inin-crease in salinity. The horizontal denisty gradient is due to differ-ences of temperature between the Arctic and Atlantic wa-ters; changes in salinity across the front partly compensate for temperature effect and weaken the density gradient.
In the AW column, salinity inversion occurs – salinity de-creases with depth (Fig. 5). Stability of the water column is caused by the temperature vertical gradient.
Despite the fact that the salinity inversion does not occur in the Arctic domain, the vertical stability of the Arctic Water column is lower than in the Atlantic domain.
4.2 The AF dynamics
The Rossby number: Ro= v
f·L, (1)
whereLis the horizontal length scale andf is the Coriolis parameter defined by:
f =2··sin(ϕ) (2)
estimated for width of the frontL=80 km, mean current ve-locity=25 cm s−1 and the Coriolis parameter for the
lati-tude of 75◦N,f =1.37×10⁻⁴s−1, equals 0.23 and fulfils
the condition for macroscale flows:Ro≪1 (Druet, 1995). It means that the front is in quasi-geostrophic balance and that geostrophic approximation may be applied. Besides the baro-clinic pressure, the Coriolis force is the main factor which
influences the dynamics of the front. Ageostrophic flows are very weak (Gill, 1982) but may play a significant role in transport across the front.
The core of the AW flow is located in the zone of the steepest front slope (Fig. 4d). The maximal velocity of baro-clinic jets is 50 cm s−1. The jet often splits into two streams.
The width of the streams reaches about 40 km. Consider-able summer-to-summer variability of the flow field is ap-parent (Fig. 6); it concerns the field structure, the location of the main stream, and its properties. For data collected by IOPAN in summers 1996–2010 the mean geostrophic AW volume and heat transport at the latitude of 76◦30′N for the 65 km-wide zone between the longitudes 006◦30′E (65th km in Fig. 4) and 009◦E (130th km in Fig. 4) equalled 1.5 Sv and 18.5 TW, with standard deviations of 0.9 Sv and 12.3 TW, respectively. These values change considerably over time (Fig. 7). The maximal transports in summer 2004 exceed 3 Sv of volume and 40 TW of heat carried with the AW (S> 34.92,T > 0). There is a positive, 0.12 Sv yr−1trend of
the baroclinic AW volume transport with the coefficient of determinationR2=0.30. The trend of the heat transport is also positive, 1.8 TW yr−1,R2=0.40. Changes of the heat
transport are caused mostly by changes in the volume trans-port; differences in the AW temperature play a minor role. Only during the 2004–2006 warming did the AW tempera-ture increase play an important role in the heat transport.
Fig. 6.Section “N” along 76◦30′N. Hovmoeller diagram of the baroclinic velocity at 200 dbar. Positive values indicate the northward flow.
Fig. 7.The geostrophic AW volume and heat transport in sum-mer, at latitude 76◦30′N for the 65 km wide zone between latitudes 006◦30′E and 009◦E.
4.3 The mesoscale activity within the AF
Flow instabilities may take a variety of forms, and the mech-anisms are often difficult to identify observationally (Gill, 1982). Stratification of the water mass, structure of the flow, and horizontal and vertical property gradients are factors which affect the front stability. During the AF study, a few mesoscale features, such as meanders and eddies, were found. Eddy sizes were of the order of the Rossby defor-mation radius, which in these regions reaches 9–11 km. The presence of meanders and eddies indicate that the AF is sen-sitive to instability, and suggests that a large-scale defor-mation field is active and that frontogenesis processes take place. The kinetic energy of barotropic motion is converted into the potential energy of stratified water by elevating par-ticles above the level specific for their density, which causes sloping of the isopycnic surfaces.
The energy which is possible to extract, the Available Po-tential Energy (APE), is described as (Gill, 1982):
APE=
ZZ 1
2ρgη
2dxdy, (3)
whereηdenotes particle elevation. The transformation of en-ergy from the vertical stratification into the mesoscale circu-lation occurs in the baroclinic instability process. Water
par-ticles moving along the inclined isopycnic surfaces convert their potential energy into the kinetic energy. This is possi-ble in regions of strong baroclinicity, i.e. where significant baroclinic currents occur, and where the vertical shear of the current exists. In the state of geostrophic equilibrium, only a small part of the APE may be converted into kinetic energy; rotation prevents the energy transformation.
Mesoscale eddies may be also created in the barotropic instability mechanism. By the horizontal shear of the flow, eddies gain energy directly from the mean flow’s kinetic en-ergy.
In case of the AF, maximal values of the horizontal ve-locity gradient∂v/∂x are 1 to 2 orders less than the verti-cal velocity gradients. This suggests that the possibility of barotropic instability occurrence is much less than the baro-clinic instability. The Burger number:
S=
R
D L
2
, (4)
equals 0.016, calculated for the width of the front as it is in a geostrophic equilibrium stateL=80 km and the Rossby radius of deformationRD=10 km. This also indicates that
only a small part of the energy needed for front destabilisa-tion is gained from barotropic instability, and disturbances are created mainly due to the APE releasing via baroclinic instability processes (Druet, 1994).
(b)
Fig. 8.Summer 1995.(a)Temperature and(b)salinity at 200 dbar.
meander was in a transformational phase on its way to be-coming an eddy. The radius of the meander was about 40 km. In the centre of the meander, water circulated in closed or-bits. The period of circulation was calculated to be approx-imately 120 h. The maximum radius of the eddy exceeded 20 km, which is twice that of the Rossby radius of defor-mation. The eddy depth reached 450 m. The meander was connected with the main front only from the surface layer to 150 m. At deeper levels the front and the meander are visible as separate structures.
A system of eddies and meanders was also found in 1996 (Fig. 10). The warm salty anticyclonic meander (with its centre at 74◦20′N, 007◦45′E) was an unstable, nearly sep-arated, “young” elliptical eddy. The horizontal and vertical dimensions of the eddy, whose maximal radius was 33 km, were bigger than those of the eddy found in 1995. The eddy reached 650 m in depth, but its horizontal temperature gradi-ents were visible even at the 800 dbar level.
Two years of investigations did not provide a clear answer regarding the causes of front meandering and eddy creation. These processes are complicated and the interaction of differ-ent factors takes place. Investigations of the frontal dynamic suggest that the instability of fronts and eddy creation is a mechanism which limits frontogenesis provided by the de-formation field (Spall, 1997). In this context, the presence of eddies indicates deformation field activity. The intensity of eddy creation may be a measure of frontogenesis process strength. Front meandering, and the growth and expansion of meanders, are possible due to the release of the APE and its transformation into kinetic energy. Unstable meanders can produce eddies. Warm, salt meanders produce anticyclonic eddies which migrate to the Arctic domain carrying salt and heat.
The bottom topography also plays a significant role in the eddies’ creation process. The occurrence of underwater mountains supports the eddies’ creation. The meandering of the front over the Schultz Bank – underwater mountain at 73◦50′N, 007◦30′E has been observed for a few times (Wal-czowski, 1998).
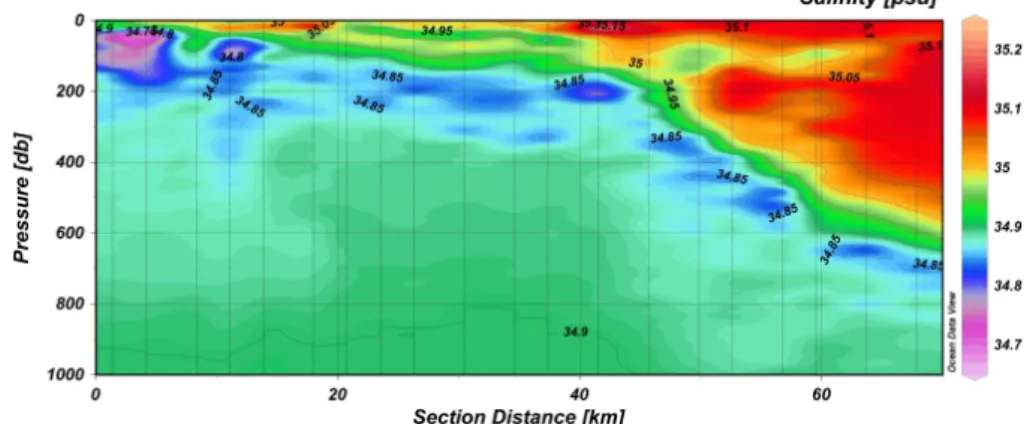
Thermohaline intrusions (Fig. 11) are another important phenomenon often observed along the AF. The occurrences of low-saline cold intrusions advecting from the Arctic to-wards the Atlantic domain have been frequent. Warm, saline intrusions were less distinct, probably because of their ten-dency to move upward (Hallock, 1985) towards the mixed layer. The observed intrusions were up to 40 km long and 100 m thick. The role of this phenomenon in the frontal sys-tem ranges widely from frontolysis processes to the trans-frontal transport of heat, salt and volume. The sinking of cold intrusions may be an efficient mechanism of the APE release and the cause of baroclinic instability. Intrusions closed in-side baroclinic eddies should help in eddy dissipation. 4.4 Eddy transport across the AF
The location of the AF in the AMOC northern limb deter-mines the significance of both alongfrontal and transfrontal transport processes. Preconditioning to deep water forma-tion, which is possible due to salt transport towards the Greenland Sea, makes the transport of the AW towards the Greenland Sea Gyre especially important. This transport is also necessary to close the heat and freshwater budget of the Greenland Sea (Latarius and Quadfasel, 2010; Segtnan et al., 2011).
(b)
(c)
along the 74°N parallel, across the frontal meander and eddy. (a)
Fig. 9.Section along the 74◦N parallel, across the frontal meander and eddy.(a)Temperature,(b)salinity, and(c)potential density in
summer 1995.
the temperature anomaly and heat transport by the eddy (Walczowski, 1998). A similar method, but on isopycnic in-stead of isobaric levels, was used for the Iceland-Faroe Front (Allen et al., 1994). The method was also used to calcu-late the temperature anomaly and heat transport by the eddy (Walczowski, 1998).
Based on the field measurements, 70 km was specified as the characteristic AF wavelength. Determining the eddy growth rate was much more difficult. Direct defining this fac-tor from measurements was not possible and only approxi-mated values could be used. The literature does not provide precise information about this value. The rapid production of a single eddy in 3 to 7 days is possible (Johannessen et al., 1987). A similar value, obtained from a two level model, was
used in calculations for the Iceland–Faroe Front (Allen et al., 1994). The study of baroclinic instability in the ocean carried out by Tulloch et al. (2011) shows a baroclinic growth rate between 0.01 and 0.05 days−1(creation time 20–100 days).
At high latitudes and in frontal regions, the eddies’ creation times are shorter than at lower latitudes. For the purpose of approximating the mean time needed for eddy creation in the AF, it was assumed that this time should not be shorter than the time needed for one eddy rotation. 40 days was chosen as the most probable value, which corresponds well with Tul-loch et al. 2011) work.
(a)
(b)
Fig. 10.Summer 1996.(a)Temperature and(b)salinity at 200 dbar.
following results: QQ=17.7×10¹²W, QSal=188×103kg s−1, QVol=2.1 Sv.
The eddy-supported heat transport, QQ, which was ob-tained is two times greater than the value estimated by van Aken et al. (1995) (8×10¹²W). If released from the Green-land Sea Gyre (surface 1.89×10¹¹m2)into the atmosphere, QQ would produce a heat flux of 93 W m−2. This result is less than the mean annual heat flux from the Greenland Sea to the atmosphere, which is 160 W m−2(Hopkins, 1991), but
close to the flux calculated by Latarius and Quadfasel (2010). Segtnan et al. (2011) calculated that in order to close the Greenland Sea budget, cross-frontal heat fluxes of 35 TW across the Arctic Front are necessary. They estimate that the volume transport across the whole front dividing the Green-land and Norwegian seas equals 4 Sv. Using the baroclinic
volume and heat budget for summers 2000–2007, the author obtained the cross-frontal AW volume transport of 2.6 Sv and a measurement of 28 TW of heat for the AF between latitudes 73◦30′N–78◦50′N (sections H-EB)(Walczowski, 2013).
There may be numerous sources of differences between estimations: various methods of calculations, different pe-riods of measurements, various AW parameterisations. Be-sides, not all of the heat transported by the AF is released in Greenland Sea Gyre. The rAW interacts with the East Green-land Current and contributes to the Denmark Strait overflow (Rudels et al., 2005).
5 Eastern boundary of the AD: Polar Front and eastern branch of the WSC
5.1 Structure of the PF
The eastern WSC branch is related to the shelf break and slope and continues over the 800 m isobath (Fig. 1). Bor-der of the Atlantic domain follows east of this flow, over the Barents Sea slope and western Spitsbergen shelf and slope. The AW flow frequently crosses the 800 m isobath, pene-trates the Storfjordrenna trough, which is between Bear Is-land and Sørkapp (southern tip of Spitsbergen), advects over the shelf and even flows into the western Spitsbergen fjords. The front dividing the Atlantic-origin waters and the Arctic Waters from the Barents Sea was sometimes called the Bar-ents Sea Polar Front (Gawarkiewicz and Pluedemann, 1995). In the Spitsbergen vicinity the shallow water front is often called the Arctic Front (Saloranta and Svendsen, 2001). They state that the coastal front west of Spitsbergen is a part of the Nordic Seas frontal system as a continuation of the front at the Barents Sea (Barents Sea Polar Front). Herein, after Skogseth et al. (2006) and other authors we call the front sep-arating the warm Atlantic-origin waters from the cold Arctic waters from the east the “Polar Front”.
Between Bear Island and Sørkapp, the frontal line is com-plicated because part of the AW circulates cyclonically in the Storfjordrenna and Kveitehola troughs (Fig. 12). In this region, the Bjørnøya Current maintains the front on the right, shallow-water side. West of the Svalbard, the shelf waters originate mostly from the East Spitsbergen Current (Salo-ranta and Svendsen, 2001). On the shelf, the freshwater input from the glaciers and rivers gives an additional contribution (Meredith et al., 2001). The current carrying the cold and less saline waters around the southern Spitsbergen tip is of-ten called the Sørkapp Current or the South Cape Current, whereas the flow over the western Spitsbergen shelf is called the Coastal Current.
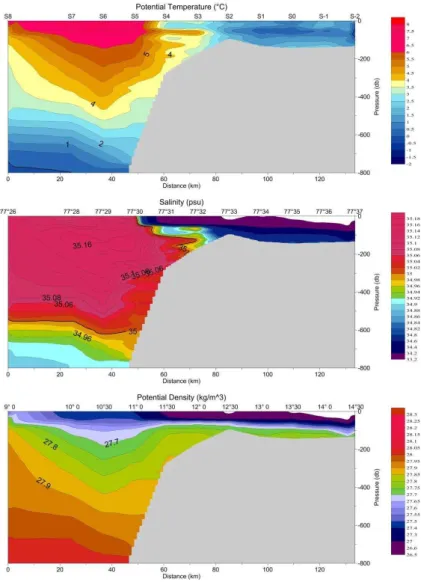
There is a strong front of properties between the Sørkapp Current and AW in the Storfjordrenna (Fig. 12). At depth of 100 m, temperature was−0.2◦C and 5.9◦C, salinity be-tween 34.67 and 35.14, density bebe-tween 27.85 kg m−3 and
Fig. 11.Low-salinity intrusion of the Arctic waters towards the Atlantic domain.
from the Sørkapp at the left hand side to Bear Island. (a) Temperature, (b) Section V2, R/V ‘Oceania’, summer 2006
Section ‘S’, R/V ‘Oceania’,
Fig. 13.Section across the core of the WSC and the Polar Front over western Spitsbergen shelf.(a)Temperature,(b)salinity, and(c)potential density. Section “S”, R/VOceania, summer 2005.
This results in a horizontal temperature gradient of 0.27◦C km−1, a salinity gradient of 0.021 km−1, and a
den-sity gradient of 0,008 kg m−3km−1. Temperature and
salin-ity gradients are stronger than in the AF, but the denssalin-ity gra-dient is weaker.
West of Svalbard, the front line continues over the shelf edge (Fig. 13). The temperature and salinity horizontal gra-dients are weaker than in the Sørkapp region, and the density gradient vanishes; the salinity and temperature changes com-pensate each other. Colder, less saline shelf water overlies the AW. There are numerous intrusive structures; AW penetrates over the shelf.
5.2 The PF dynamics
The WSC is the primary source of heat and salt to the AO, and the WSCeast and its extension in the Arctic Ocean – the Svalbard branch (Sect. 7) – plays a major role in this
transport. It gives a nearly constant volume flux; the long-term mean of the northward transport is 1.8±0.1 Sv, includ-ing 1.3±0.1 Sv of the AW warmer than 2◦C (Beszczynska-Möller et al., 2012).
There is a very weak density gradient or no gradient at all between the AW and the shelf/coastal waters on the eastern AD border. Additionally, there is a strong horizontal velocity shear – the core of the AW flows much faster than the shelf waters. This outline suggests that the barotropic instability should be the main mechanism of the current destabiliza-tion and cross-frontal exchange. Indeed, Nilsen et al. (2006) wrote that the Gaussian current profiles for narrower cur-rent jets in the WSCeast produce unstable modes due to a stronger velocity shear. The unstable eddies probably con-tribute significantly to the heat loss of the WSCeast warm core by isopycnal eddy diffusion. Cottier et al. (2005) found that the barotropic instabilities form pockets of the AW at the shelf front. The AW leaks onto the shelf and propagates as topographically steered features toward the fjords. Cottier et al. (2007) described the warm AW inflow over the shelf in winter 2005/2006 as being caused by sustained along-shelf winds as generating upwelling and cross-frontal exchange.
The tidal forcing is an additional mechanism promoting the cross-shelf exchange. Tides propagate as coastal Kelvin waves along the Spitsbergen coast (Kowalik, 1994). Diur-nal tides can be enhanced near the shelf edges, causing the generation of shelf waves with tidal periods (Nilsen et al., 2006). Kasajima and Svendsen (2002) found an increase of the cross-shelf velocity component of diurnal tides from deep water to the shelf edge.
The ice and brine production is another mechanism of cross-slope exchange. The Storfjorden is the region of the biggest brine production in the Svalbard Archipelago; Stor-fjordrenna is the pathway of the brines’ westward trans-port. Conditions of freezing, brine release and transportation should be the most important here; but the brine production in smaller West Spitsbergen fjords also influences the ex-change’s mechanisms (Nilsen et al., 2008).
IOPAN investigations of the western Barents Sea and Spitsbergen slope/shelf show a variety of mesoscale struc-tures. There are isopycnal intrusions, pockets of the AW sep-arated from the mean flow and advected over the shelf, and domes of brines migrating down along the Storfjordrenna slope (Fig. 14).
The shelf is a transitional zone between the warm AW and fjords. The large fjords systems in western
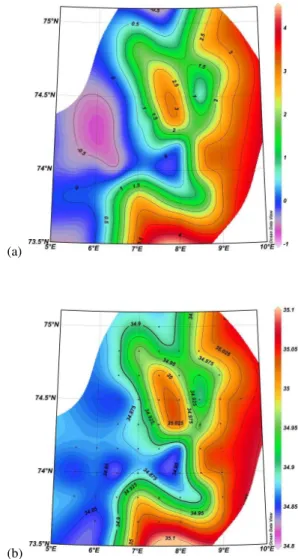
Spitsber-Both frontal zones separating the Atlantic-origin waters from the Arctic and Polar water masses are related to the bot-tom topography. The western frontal zone (the Arctic Front) runs meridionally between about 005◦E and 006◦E, and is “semipermanent” (van Aken, 1995). Its position is associ-ated with the mid-ocean ridges. The frontal zone bordering the AD from the east (Polar Front) is related to the Barents Sea and western Spitsbergen slope and shelf.
The positions of both zones are not permanent; they change depending on the intensity of the AW flow, frontal instabilities, atmospheric conditions and other processes. In warm years and when there is high activity of the WSC western branch, the AF line moves westward (Fig. 15). The mesoscale activity also changes the position of the fronts. Processes of the meanders’ growth and the eddies’ forma-tion may shift the frontal line westward by tens of kilo-metres (Walczowski and Piechura, 2007). Changes in the AF position and strength may be also affected by winds over the Nordic Seas and the NAO index (Schlichtholtz and Goszczko, 2006). Schlichtholtz and Goszczko found a large negative correlation between the North Atlantic Oscillation (NAO) index and the AW flow in the ridge area at the lati-tude 76◦30′N.
The eastern branch of the WSC seems to be more stable in the southern than in the northern part. At section “K”, lat-itude 75◦N, the position of the WSCeast (peak of the AW integrated transport at the 290th km of section) appears in the same position for several years (Fig. 16a). At 76◦30′N (sec-tion “N”) the axis of the current moves zonally by 50 km. This may be caused by the Sørkapp Current activity. Trans-port peaks of the western branch are also concentrated more at the 75◦N parallel than at 76◦30′N. Between the two flows’ maxima, significant mesoscale activity is apparent. The mesoscale eddies occur also west of the AF.
Table 1.Mean properties of AW (T> 2◦C,S> 34.90) and baroclinic transports cross the WSC eastern branch at sections K and N. Mean for
summers 2000–2010, R/VOceaniadata.
Section Latitude Longitude AW Temp (◦C)/Sd AW Sal/Sd AW_Vol (Sv)/Sd AW_Vol+(Sv)/Sd Q_Vol (TW)/Sd
K 75◦00′N 13◦45′–15◦45′ 4.35/0.31 35.08/0.02 1.27/0.80 1.81/0.63 16.06/9.68 N 76◦30′N 12◦00′–14◦00′ 4.07/0.30 35.07/0.02 0.91/0.56 1.51/0.41 10.55/6.32
Section ‘O’,
‘ ’
Fig. 14.Inflow of the AW in the upper layer and brines migrating along the Storfjordrenna near the bottom.(a)Temperature,(b)salinity, and (c)potential density. Section “O”, R/VOceania, summer 2000.
in both branches simultaneously, with positive trends and maxima in the 2005–2006 periods. Temperature increases by 0.81◦C and 1◦C per 10 yr, and salinity by 0.073 and 0.082 per 10 yr in the eastern and western WSC branch, re-spectively. The correlation coefficients for data presented in Fig. 17 equalled r=0.64, p=0.008 for temperature and r=0.83,p=0.0001 for salinity, without time lag. For de-trended data, the correlations are smaller:r=0.48,p=0.06 andr=0.56,p=0.02, respectively.
– 2.25 °C
Fig. 15.Temperature at 200 dbar in the cold conditions 2002, and warm 2005, 2006. The western frontal line (isotherms 2–2.25◦C) is marked
by the grey line.
(a)
(b)
· ) cross the section (a) ‘K’ along the 75° N and (b) ‘N’ along the 76°30’ N parallel.
Fig. 16.Vertically integrated baroclinic volume transport (m2s−1) cross the section(a)“K” along the 75◦N parallel and(b)“N” along
the 76◦30′N parallel.
(Walczowski and Piechura, 2007). Therefore, water releases more heat to the atmosphere, and mixing processes in the AF cause water cooling and freshening.
In summers 2005 and 2006, some uncommonly large ed-dies were observed (Walczowski and Piechura, 2007). These eddies carried an unusual amount of heat along the western border of the Atlantic domain. The maximum of the front westward shift at the section along the 76◦30′N parallel dur-ing the period 1996–2010 occurred in these warmest years, 2005 and 2006 (Fig. 18). During that time, temperature and salinity in both WSC branches rose; the 2000 warming was manifested mostly by the coreT andSincreasing.
(a)
(b)
Fig. 17.Time series of mean (a)temperature and(b) salinity at 200 m depth, in 50 km wide zones of the eastern (red lines) and western WSC branches.
7 The AF and PF in Fram Strait and northward
(a)
(b)
Figure 18. Section ‘N’ along the 76°30’ N. Hovmoeller diagram of the (a) temperature and Fig. 18.Section “N” along the 76◦30′N. Hovmoeller diagram of the(a)temperature and(b)salinity at 200 dbar.
Fig. 19.Summer 2007.(a)Baroclinic currents and temperature at 100 dbar and(b)LADCP-measured currents at 200 dbar.
diverges again into two or even three streams (Fig. 20). The eastern one – the Svalbard Branch, and the central one – the Yermak Branch, flow into to the Arctic Ocean through the Fram Strait. The Svalbard Branch, fed by the along-slope core of the WSC (WSCeast), after passing the Fram Strait, continues eastward along the shelf break. The local front sep-arates this AW flow from the Barents Sea waters located on the south. Due to intensive heat loss to the atmosphere and to freshening through mixing with the melted ice water, the AW upper portion cools and freshens, which leads to the isolation
of the AW warm core from the ocean surface (Ivanov et al., 2009). The water mass configuration becomes complicated near the St. Anna Trough where the Svalbard Branch meets the AW Barents Branch (Rudels et al., 2013).
along 78°50’N, between longitudes 0°06’E 9°08’E. R/V ‘Oceania’, summer 2010.
Fig. 20.Temperature and baroclinic velocity at section EB along 78◦50′N, between longitudes 0◦06′E–9◦08′E. R/VOceania, summer 2010.
the western branch are able to cross the Fram Strait and inflow the Arctic Ocean (Walczowski and Piechura, 2007). The AW warm water pulses may influence the ice conditions north of Svalbard (Piechura and Walczowski, 2009).
8 Conclusions
AF baroclinic jet streams in the WSCwest are a signifi-cant source of the AW and cannot be ignored in the Nordic Sea mass, heat and salt balance. At high latitudes baroclinic transport of the AW is comparable or even larger than the vol-ume transport along the shelf break by the WSCeast, which is commonly regarded as the main AW stream in the Nordic Seas. The transfrontal transport of the AW occurs along the whole AF. The baroclinic, mesoscale anticyclonic eddies are the main structures carrying the AW into the Greenland Sea. Eddies are created due to the front baroclinic instability, am-plified by the bottom topography.
The transfrontal transport and final AF bifurcation is im-portant for the whole Nordic Seas system, and especially for the maintenance of the thermohaline circulation. The return intermediate Atlantic Water plays a significant role in the convection and deep water mass formation in the Greenland Sea (van Aken, 2007).
Transport cross the eastern AD border is less intensive. The eastern branch of the West Spitsbergen Current preserves its signature on the long way to the Arctic Ocean. The ocean– atmosphere heat exchange is the main process modifying the WSCeast water properties. The transfrontal exchange is
mostly important for the Svalbard fjords, as it modifies their physical conditions.
Acknowledgements. The hydrographic data were collected under the European Union Fifth Framework Program project ASOF-N (Arctic–Subarctic Ocean Flux Array for European Climate: North), contract number EVK2-CT-200200139, and the Sixth Framework Program DAMOCLES (Developing Arctic Modelling and Observing Capabilities for Long-term Environment Studies), contract number 018509GOCE. This research was supported by the Polish-Norwegian grant AWAKE, PNRF-22-AI-1/07. The author is grateful to the entire crew of R/VOceaniaand the colleagues who participated in the work at sea.
Edited by: J. M. Huthnance
References
Aagaard K. and Carmack, E.: The role of sea ice and other fresh wa-ter in the arctic circulation, J. Geophys. Res., 94, 14485–14498, 1989.
Aagaard, K. and Greisman, P.: Toward new mass and heat budgets for the Arctic Ocean, J. Geophys. Res., 80, 3821–3827, 1975. Allen, J. T., Smeed, D. A., and Chadwick, A. L.: Eddies and mixing
in the Iceland-Faeroes Front, Deep-Sea Res., 41, 51–79, 1994. Beszczynska- Möller, A., Fahrbach, E., Schauer, U., and Hansen,
E.: Variability in Atlantic water temperature and transport at the entrance to the Arctic Ocean, 1997–2010, ICES J. Mar. Sci., 69, 852–863, doi:10.1093/icesjms/fss056, 2012.
Greenland Sea derived from hydrographic and acoustic Doppler current profiler measurements, J. Geophys. Res., 108, 3298, doi:10.1029/2002JC001530, 2003.
Cottier, F. R., Tverberg, V., Inall, M., Svendsen, H. , Nilsen, F., and Griffiths, C.: Water mass modification in an Arctic fjord through cross-shelf exchange: The seasonal hydrography of Kongsfjorden, Svalbard, J. Geophys. Res., 110, C12005, doi:10.1029/2004JC002757, 2005.
Cottier, F. R., Nilsen, F., Inall, M. E., Gerland, S., Tverberg, V., and Svendsen, H.: Wintertime warming of an Arctic shelf in response to large-scale atmospheric circulation, Geophys. Res. Lett., 34, L10607, doi:10.1029/2007GL029948, 2007.
Dickson , R., Meincke, J., and Rhines, P.: Arctic-Subarctic Ocean Fluxes: Defining the Role of the Northern Seas in Climate, in: Arctic-Subarctic Ocean Fluxes, Springer Science, 1–15, 2008. Dietrich, G., Kalle, K., Krauss, W., and Siedler, G.: General
oceanography, 2nd ed., Wiley-Intersci., New York, 626 pp., 1980.
Druet, C.: Dynamika stratyfikowanego oceanu, PWN Warszawa, 146 pp., 1994.
Druet, C.: Elementy hydrodynamiki geofizycznej, PWN Warszawa, 111 pp., 1995.
Emery W. J. and Thomson, R. E.: Data analysis methods in physical oceanography, Elsevier, Amsterdam, 650 pp., 2001.
Fedorov, K. N.: The Physical Nature and Structure of Oceanic Fronts, Springer-Verlag, New York, 333 pp., 1986.
Furevik, T.: On anomalous sea surface temperatures in the Nordic Seas, J. Climate., 13, 1044–1053, 2000.
Gawarkiewicz, G. and Pluedemann, A. J.: Topographic control of the thermohaline frontal structure in the Barents Sea Polar Front on the south flank of the Spitsbergen Bank, J. Geophys. Res., 100, 4509–4524, 1995.
Gill, A. E.: Atmosphere-Ocean Dynamics, International Geo-physics Series, 30, Academic Press Inc., 662 pp., 1982. Hallock, Z. R.: Variability of Frontal Structure in the Southern
Nor-wegian Sea., J. Phys. Oceanogr., 15, 1245–1254, 1985. Hansen, B. and Østerhus, S.: North-Atlantic-Nordic Seas
ex-changes, Prog. Oceanogr., 45, 109–208, 2000.
Hansen, B., Larsen, K. M. H., Østerhus, S., Turrell, B., and Jónsson, S.: The Atlantic Water inflow to the Nordic Seas, The Interna-tional WOCE Newsletter, 35, 33–35, 1999.
Hansen, B., Østerhus, S., Hátún, H., Kristiansen, R., and Larsen, K. M. H.: The Iceland-Faroe inflow of Atlantic water to the Nordic seas, Prog. Oceanogr., 59, 443–474, 2003.
Holliday, N. P., Hughes, S. L., Bacon, S., Beszczynska-Möller, A., Hansen, B., Lavin, A., Loeng, H., Mork, K. A., Østerhus, S., Sherwin, T., and Walczowski, W.: Reversal of the 1960s to 1990s freshening trend in the northeast North Atlantic and Nordic Seas, Geophys. Res. Lett., 35, L03614, doi:10.1029/2007GL032675, 2008.
Holliday, N. P., Hughes, S. L., and Beszczynska-Möller, A.: ICES report on ocean climate 2008, ICES cooperative research report, 298, 2009.
Hopkins, T. S.: The GIN Sea-A synthesis of its physical oceanog-raphy and literature review 1972–1985, Earth-Sci. Rev., 30, 75– 318, 1991.
Ivanov, V. and Korablev, A.: Structure and dynamic of hydrolog-ical fronts, in Large-scale processes in Norway Energetic Zone
and adjacent regions, Gidrometeoizdat, Sankt-Petersburg, 41–55, 1994 (in Russian).
Ivanov, V., Polyakov, I. V., Dmitrenko, I. A., Hansen, E., Repina, I. A. Kirillov, S. S., Mauritzen, C., Simmons, H., and Timokhov, L. A.: Seasonal Variability in Atlantic Water off Spitsbergen, Deep-Sea Res. Pt. I, 56, 1–14, 2009.
Johannessen, J. A., Johannessen, O. M., Svendsen, E., Shuchman, R., Mendley, T., Campbell, W. J., Josberger, E. G., Sandven, S., Gascard, J.-C., Olaussen, T., Davidson, K., and van Leer, J.: Meso-scale eddies in the Fram Strait marginal ice zone during the 1983 and 1984 Marginal Ice Zone Experiments, J. Geophys. Res., 92, 6754–6772, 1987.
Johannessen, O. M.: Brief overview of the physical oceanography, in: Nordic seas, edited by: Hurdle, B. G., 103–127, New York, Springer, 1986.
Kasajima, Y. and Svendsen, H.: Tidal features in the Fram Strait, Cont. Shelf Res., 22, 2461–2477, 2002.
Kowalik, Z.: Modeling of topographically amplified diurnal tides in the Nordic Seas, J. Phys. Oceanogr., 24, 1717–1731, 1994. Kuhlbrodt, T., Griesel, A., Montoya, M., Levermann, A., Hofmann,
M., and Rahmstorf, S.: On the driving processes of the Atlantic meridional overturning circulation, Rev. Geophys., 45, RG2001, doi:10.1029/2004RG000166, 2007.
Larsen, K. M. H., Hátún, H., Hansen, B., and Kristiansen, R.: At-lantic water in the Faroe area: sources and variability, ICES Jour-nal of Marine Science, 69, 802–808, doi:10.1093/icesjms/fss028, 2012.
Latarius, K. and Quadfasel, D.: Seasonal to interannual variability of temperature and salinity in the Greenland Sea: heat and fresh-water budgets, Tellus, 62, 497–515, 2010.
Maslowski W., Marble, D., Walczowski, W., Schauer, U., Clement, J. L., and Semtner, A. J.: On climatological mass, heat, and salt transports through the Barents Sea and Fram Strait from a pan-Arctic coupled ice-ocean model simulation, J. Geophys. Res., 109, C03032, doi:10.1029/2001JC001039, 2004.
Mauritzen, C., Hansen, E., Andersson, M., Berx, B., Beszczynska-Möller, A., Burud, I., Christensen, K. H., Debernard, J., de Steur, L., Dodd, P., Gerland, S., Godøy, Ø., Hansen, B., Hud-son, S., Høydalsvik, F., Ingvaldsen, R., Isachsen, P. E., Kasajima, Y., Koszalka, I., Kovacs, K. M., Køltzow, M., LaCasce, J., Lee, C. M., Lavergne, T., Lydersen, C., Nicolaus, M., Nilsen, F., Nøst, O. A., Orvik, K. A., Reigstad, M., Schyberg, H., Seuthe, L., Skagseth, Ø., Skarðhamar, J., Skogseth, R., Sperre-vik, A., Svensen, C., Søiland, H., Teigen, S. H., Tverberg, V., Wexels Riser C.: Closing the loop – Approaches to monitor-ing the state of the Arctic Mediterranean durmonitor-ing the Interna-tional Polar Year 2007–2008, Progr. Oceanogr., 90, 1–4, 62–89, doi:10.1016/j.pocean.2011.02.010, 2011.
Meredith, M., Heywood, K. J., Dennis, P., Goldson, L., White, R., Fahrbach, E., Schauer, U., and Østerhus, S: Freshwater fluxes through the western Fram Strait, Geophys. Res. Lett., 28, 1615– 1618, 2001.
Mork, K. A. and Blindheim, J.: Variations in the Atlantic inflow to the Nordic Seas, 1955–1996, Deep-Sea Res. Pt. I, 47, 1035– 1057, 2000.
curl in the North Atlantic on the Atlantic inflow to the Nor-wegian Sea toward the Arctic, Geophys. Res. Lett., 30, 1884, doi:10.1029/2003GL017932, 2003.
Orvik, K. A., Skagseth, Ø., and Mork, M.: Atlantic inflow to the Nordic Seas: Current structure and volume fluxes from moored current meters, VM-ADCP and SeaSoar-CTD observa-tions, 1995–1999, Deep-Sea Res. Pt. I, 48, 937–957, 2001. Osi´nski, R., Wieczorek, P., Beszczynska-Moller, A., and Goszczko,
I.: ADCP-referenced geostrophic velocity and transport in the West Spitsbergen Current, Oceanologia, 45, 425–435, 2003. Piechura, J. and Walczowski, W.: The Arctic Front: structure and
dynamics, Oceanologia, 37, 47–73, 1995.
Piechura, J. and Walczowski, W.: Warming of the West Spitsbergen Current and sea ice north of Svalbard, Oceanologia, 51, 147–164, 2009.
Rudels, B., Björk G., Nilsson, J., Winsor, P., Lake, I., and Nohr, C.: The interaction between waters from the Arctic Ocean and the Nordic Seas north of Fram Strait and along the East Greenland Current: results from the Arctic Ocean-02 Oden expedition, J. Marine Syst., 55, 1–30, 2005.
Rudels, B., Schauer, U., Björk, G., Korhonen, M., Pisarev, S., Rabe, B., and Wisotzki, A.: Observations of water masses and circu-lation with focus on the Eurasian Basin of the Arctic Ocean from the 1990s to the late 2000s, Ocean Sci., 9, 147–169, doi:10.5194/os-9-147-2013, 2013.
Saloranta, T. M. and Svendsen, H.: Across the Arctic front west of Spitsbergen: high-resolution CTD sections from 1998–2000, Polar Res., 20, 177–184, 2001.
Schauer, U., Loeng, H., Rudels, B., Ozhigin, V., and Dieck, W.: Atlantic water flow through the Barents and Kara Sea, Deep-Sea Res. Pt. I, 49, 2281–2296, 2002.
Schlichtholz, P. and Goszczko, I.: Interannual variability of the At-lantic water layer in the West Spitsbergen Current at 76.5◦N in summer 1991–2003, Deep-Sea Res. Pt. I, 53, 608–626, doi:10.1016/j.dsr.2006.01.001, 2006.
Segtnan, O. H., Furevik, T., and Jenkins, A. D.: Heat and freshwa-ter budgets of the Nordic seas computed from atmospheric re-analysis and ocean observations, J. Geophys. Res., 116, C11003, doi:10.1029/2011JC006939, 2011.
Software, ftp://ftp.ldeo.columbia.edu/pub (last access: 2008), 2007.
Troupin, C., Barth, A., Sirjacobs, D., Ouberdous, M., Brankart, J.-M., Brasseur, P., and Rixen, M.: Generation of analysis and con-sistent error fields using the Data Interpolating Variational Anal-ysis (Diva), Ocean Model., 52–53, 90–101, 2012.
Tulloch, R., Marshall, J., Hill, C., and Shafer Smith, K.: Scales, Growth Rates, and Spectral fluxes of Baroclinic Instability in the Ocean, J. Phys. Oceanogr., 41, 1057–1076, 2011.
Van Aken, H. M.: The Oceanic Thermohaline Circulation: An In-troduction, Springer Science+Business Media, LLC, ISBN-10: 0-387-36637-7, 2007.
Van Aken, H. M., Budeus, G., and Hähnel, M.: The anatomy of the Arctic Frontal Zone in the Greenland Sea, J. Geophys. Res., 100, 15999–16014, 1995.
Walczowski, W.: Transfrontal heat and mass exchange in the Arctic Front region, Ph.D. thesis, 123 pp., Institute of Oceanology PAS, Sopot, 1998.
Walczowski, W.: Atlantic Water in the Nordic Seas, Springer Inter-national Publishing, 300 pp, 2013.
Walczowski W. and Piechura, J.: Pathways of the Green-land Sea warming, Geophys. Res. Lett., 34, L10608, doi:10.1029/2007GL029974, 2007.
Walczowski, W. and Piechura, J.: Influence of the West Spitsbergen Current on the local climate, Int. J. Climatol., 31, 1088–1093, doi:10.1002/joc.2338, 2011.
Walczowski, W., Piechura, J., Osinski, R., and Wieczorek, P.: The West Spitsbergen Current volume and heat transport from syn-optic observations in summer (2005), Deep-Sea Res. Pt. I, 52, 1374–1391, doi:10.1016/j.dsr.2005.03.009, 2005.
Walin, G., Broström, G., Nilsson, J., and Dahl, O.: Baroclinic boundary currents with downstream decreasing buoyancy: A study of an idealized Nordic Seas system, J. Mar. Res., 62, 517– 543, 2004.