www.hydrol-earth-syst-sci.net/20/2779/2016/ doi:10.5194/hess-20-2779-2016
© Author(s) 2016. CC Attribution 3.0 License.
Estimating drought risk across Europe from reported drought
impacts, drought indices, and vulnerability factors
Veit Blauhut1, Kerstin Stahl1, James Howard Stagge2, Lena M. Tallaksen2, Lucia De Stefano3, and Jürgen Vogt4
1Hydrology, Faculty of Environment and Natural Resources, University of Freiburg, Freiburg, Germany 2Department of Geosciences, University of Oslo, Oslo, Norway
3Department of Geodynamics, Complutense University of Madrid, Madrid, Spain 4Joint Research Centre of the European Commission, JRC, Ispra, Italy
Correspondence to:Veit Blauhut ([email protected])
Received: 31 October 2015 – Published in Hydrol. Earth Syst. Sci. Discuss.: 3 December 2015 Revised: 25 May 2016 – Accepted: 10 June 2016 – Published: 12 July 2016
Abstract.Drought is one of the most costly natural hazards in Europe. Due to its complexity, drought risk, meant as the combination of the natural hazard and societal vulnerabil-ity, is difficult to define and challenging to detect and pre-dict, as the impacts of drought are very diverse, covering the breadth of socioeconomic and environmental systems. Pan-European maps of drought risk could inform the elab-oration of guidelines and policies to address its documented severity and impact across borders. This work tests the ca-pability of commonly applied drought indices and vulner-ability factors to predict annual drought impact occurrence for different sectors and macro regions in Europe and com-bines information on past drought impacts, drought indices, and vulnerability factors into estimates of drought risk at the pan-European scale. This hybrid approach bridges the gap between traditional vulnerability assessment and probabilis-tic impact prediction in a statisprobabilis-tical modelling framework. Multivariable logistic regression was applied to predict the likelihood of impact occurrence on an annual basis for par-ticular impact categories and European macro regions. The results indicate sector- and macro-region-specific sensitivi-ties of drought indices, with the Standardized Precipitation Evapotranspiration Index (SPEI) for a 12-month accumula-tion period as the overall best hazard predictor. Vulnerability factors have only limited ability to predict drought impacts as single predictors, with information about land use and water resources being the best vulnerability-based predictors. The application of the hybrid approach revealed strong regional and sector-specific differences in drought risk across Europe.
The majority of the best predictor combinations rely on a combination of SPEI for shorter and longer accumulation periods, and a combination of information on land use and water resources. The added value of integrating regional vul-nerability information with drought risk prediction could be proven. Thus, the study contributes to the overall understand-ing of drivers of drought impacts, appropriateness of drought indices selection for specific applications, and drought risk assessment.
1 Introduction
Re-port Inventory (EDII) across 15 different impact categories from agriculture to water quality (Stahl et al., 2016) and fi-nancial losses over the last 3 decades were estimated to over EUR 100 billion (EC, 2007).
To mitigate these impacts, until recently drought risk management at the pan-European scale has predominantly focused on coping with financial losses, mainly through calamity funds, mutual funds, and insurances (Diaz-Caneja et al., 2009). Nevertheless, today’s scientific consensus points to the need to move from a reactive to a proactive risk management strategy (Wilhite et al., 2007). Rossi and Can-celliere (2012) stated that an advanced assessment of drought must include firstly, an investigation of socioeconomic and environmental impacts, secondly, multicriteria tools to miti-gate these, and thirdly, a set of easily understood models and techniques for application by stakeholders and decision mak-ers responsible for drought preparedness planning.
The risk of natural disasters in a very general sense is a combined function of hazard and vulnerability (Birkmann et al., 2013). For drought risk analysis, risk may be estimated through a combination of hazard measures and estimates of vulnerability or proxies of it. Cardona et al. (2012) observed that “vulnerability and risk assessment deal with the iden-tification of different facets and factors of vulnerability and risk, by means of gathering and systematising data and in-formation, in order to be able to identify and evaluate dif-ferent levels of vulnerability and risk of societies – social groups and infrastructures – or coupled socioecological sys-tems”. Hence, the assessment of the vulnerability component of drought risk is based either on vulnerability factors or on past drought impacts, as these are considered to be symptoms of vulnerability (Knutson et al., 1998).
According to Knutson et al. (1998), vulnerability assess-ments provide a framework for identifying the root causes of drought impacts at social, economic, and environmental lev-els and measure a potential state, which will generate impacts if a given level of hazard occurs. Vulnerability to drought, as the predisposition to be adversely affected by a given haz-ard (IPCC, 2012), therefore is often assessed by the factor approach, in which a set of vulnerability factors (e.g. Swain and Swain, 2011; Jordaan, 2012; Naumann et al., 2014; Kar-avitis et al., 2014) contribute to an overall classification of vulnerability (e.g. information on water resources, society or technical infrastructure; González-Tánago et al., 2015). Based on their review of 46 drought-factor-based vulnera-bility assessments, González-Tánago et al. (2015) observed that only 57 % of the studies actually describe the process followed to select vulnerability factors. Among those, the criteria used include the consultation of previous studies and specialised literature, data availability, and expert knowledge (González-Tánago et al., 2015). The selection of vulnerabil-ity factors is guided by the focus of the study, the definition of drought applied, the study location, and data availability. Vulnerability factors are often combined and weighted by ex-pert knowledge and stakeholder interaction to a single,
over-all vulnerability index (Wilhelmi and Wilhite, 1997; Adepetu and Berthe, 2007; Deems and Bruggeman, 2010). The ma-jority of studies provide limited or no information on proce-dures applied to verify the derived index (González-Tánago et al., 2015). Only few studies validate their results, among them Aggett (2013), Naumann et al. (2014), and Karavitis et al. (2014).
Impact approaches to vulnerability and risk assessment, on the other hand, use information on past drought impacts as a proxy for vulnerability, assuming that a system has been vulnerable if it has been impacted. Drought risk is then con-sidered the risk for a particular type of impact. Typically, the impact of drought is then characterised based on data of ei-ther financial or quantitative losses of agricultural production (Hlavinka et al., 2009; Rossi and Niemeyer, 2010; Tsakiris et al., 2010; Gil et al., 2011; Jayanthi et al., 2014; Quijano et al., 2014), human mortality (Dilley et al., 2005), or im-pacts on forestry (Vicente-Serrano et al., 2012; Muukkonen et al., 2015). Blauhut et al. (2015a) applied annual impact oc-currence based on reported information in the EDII to char-acterise sector-specific vulnerability. Drought risk was then estimated as the probability of impact occurrence as a func-tion of the Standardized Precipitafunc-tion Evapotranspirafunc-tion In-dex (SPEI). The function used was a fitted logistic regression model. The estimated parameters could subsequently be used to generate a first set of pan-European drought risk maps. The displayed likelihood of impact occurrence on the maps can be considered impact-category-specific drought risk for selected hazard intensities. Stagge et al. (2015b) considered variations of the logistic regression and expanded the ap-proach to include multiple hazard predictors. Bachmair et al. (2015) applied regression tree and correlation approaches to link impact number and occurrence with a range of in-dices. Both studies relied on a rather high temporal resolution of reported impact occurrence, and hence considered only a few regions with particularly good data coverage.
lev-els are commonly categorised into arbitrarily chosen haz-ard index thresholds, such as those selected for the Stan-dardized Precipitation Index (SPI) (−1.5<SPI<−1: mod-erate drought,−2<SPI<−1.5: severe drought, SPI<−2: extreme drought, where negative values represents less than median precipitation) (McKee et al., 1993). Defining haz-ard severity thresholds that relate to potential impacts on socioeconomic and natural systems, and thus the drought risk, is often left to expert judgement. However, an indepen-dent validation of the relevance of the various drought in-dicators for management purposes is of crucial importance (Pedro-Monzonís et al., 2015). Bachmair et al. (2016) found that although drought monitoring and early warning system providers often collect impact information, these are rarely used systematically to validate the usefulness of particular hazard indices. Such usefulness has been tested mostly in local or regional case studies based on empirical links be-tween quantified losses such as financial or yield losses and climatic or resource (water availability) conditions (Jayan-thi et al., 2014; Stone and Potgieter, 2008; Schindler et al., 2007). Stagge et al. (2015b). Bachmair et al. (2015) have as-sessed the link between impacts and different drought indices in selected European countries and found that the best indices vary with location and sector.
In this study, we expand the method of Blauhut et al. (2015a) into a hybrid approach, which implies the consid-eration of vulnerability factors into the probabilistic impact prediction. The approach builds on earlier work developed for the agricultural sector (Zhang et al., 2011; Ahmed and Elagib, 2014; Han et al., 2015; Yin et al., 2014) and a Euro-pean assessment by De Stefano et al. (2015), who considered several physical and socioeconomic factors to calculate sen-sitivity and adaptive capacity, and used impact information collected in the EDII to estimate exposure. More specifically, the hybrid approach aims to
1. investigate the ability of commonly used drought in-dices and vulnerability factors to predict annual drought impact occurrence for various sectors;
2. identify the best-performing combinations of predictors to model drought risk for different sectors; and
3. map sector-specific drought risk for selected hazard severity levels across Europe.
This study addresses these aims through statistical modelling (logistic regression) of the combined effect of drought haz-ard, defined by drought indices, and drought vulnerability, defined by vulnerability factors, on the occurrence of histor-ical drought impacts as extracted from the EDII. In a first step, potentially relevant drought indices and vulnerability factors were tested for their suitability as impact predictors in binary logistic models. Then, impact category and region-specific multivariable logistic models were built in a hybrid approach, combining the most relevant drought indices and
Figure 1.Number of annual aggregated NUTS-combo-scale im-pacts reported and archived in the European Drought Impact Re-port Inventory (EDII) by European macro region (left panel) and by NUTS-combo region (right panel).
vulnerability factors as predictors of drought impact likeli-hood using stepwise selection. The final models were then used to construct pan-European drought risk maps for spe-cific hazard severity levels.
2 Data
2.1 Impact information
Information on drought impacts are derived from the EDII (Stahl et al., 2016; http://www.geo.uio.no/edc/droughtdb/). Since its creation in 2012, this archive has grown signifi-cantly due to extensive data collection. Documentation on the database’s structure and categorisation scheme can be found on the website and in a pan-European summary assess-ment by Stahl et al. (2016). All reports archived in the EDII database (a) describe negative impacts of drought on soci-ety, the economy, or the environment as reported by a given information source, e.g. government report, any type of pub-lic media; (b) are spatially referenced, either to their respec-tive NUTS (Nomenclature of Territorial Units for Statistics) region or to locations such as rivers, lakes, or coordinates; (c) are time referenced to at least the year of occurrence, preferably the season or month if given, and, when possible, assigned to a major regional drought event; and (d) are as-signed to one of 15 impact categories and an associated num-ber of subordinate impact types (105 in total). To guarantee a standard quality of entries, each entry has been reviewed by an expert (Stahl et al., 2016).
Figure 2.Annual drought impact occurrence by European macro
region and impact categories. A & L: Agriculture and Livestock Farming, Fo: Forestry, A & F: Aquaculture and Fisheries, E & I: En-ergy and Industry, WT: Waterborne Transportation, T & R: Tourism and Recreation, PWS: Public Water Supply, WQ: Water Quality, FE: Freshwater Ecosystems, TE: Terrestrial Ecosystems, SS: Soil Systems, WF: Wildfires, H & P: Human Health and Public Safety, Co: Conflicts.
of impact occurrence and shows significant differences be-tween European macro regions (Fig. 1, left panel). These macro regions are climatologically comparable regions de-fined in order to cope with larger climatic differences and data shortfalls (Blauhut et al., 2015a). The majority of im-pact reports are located in maritime Europe (1290) with fewer entries in the western Mediterranean (342), southeast-ern Europe (283), and northeastsoutheast-ern Europe (62). The highest numbers for drought impact entries by NUTS-combo level (Fig. 1, right panel) are available for southern UK, central Europe, and the southwestern Iberian Peninsula. Northeast-ern Europe has the lowest number of EDII entries.
To overcome reporting biases, including regionally lack-ing data for a pan-European application of the EDII data set (Stahl et al., 2016), we followed Blauhut et al. (2015a) and: (a) created binary data sets (occurrence/absence of im-pact reports) from 1970 to 2012 for each imim-pact category and macro region, (b) assigned multiyear drought impacts to each affected year (e.g. 1975–1976: impact occurrence in 1975 and 1976), and (c) generalised seasonal and short-term infor-mation to the year of occurrence. Figure 2 shows the timeline
of annual drought impact occurrence for all reported impact categories pooled for European macro regions.
Drought impact reports stem from various sources and are assigned with a certain level of reliability, decreasing by its enumeration rank: academic work, governmental re-ports and documents, rere-ports, media and webpages, and other sources (Stahl et al., 2016). The proportions of im-pact sources by macro regions differ significantly. In both the western Mediterranean and maritime Europe regions, academic work and governmental documents are the dom-inant sources of information (about two-thirds). By con-trast, EDII entries for northeastern Europe are strongly dom-inated by academic work and the media (∼90 %). The ma-jority of information sources for southeastern Europe are non-governmental reports and the media, which suggest that southeastern Europe may have the least reliable data. Explicit information is lacking that would allow assigning an uncer-tainty flag depending on the source. Thus, in this study all information sources were treated equally. Nevertheless, un-certainties due to the nature of the impact data need to be discussed and considered in the interpretation of any studies that are based on this or similar sources of data.
2.2 Hazard indices
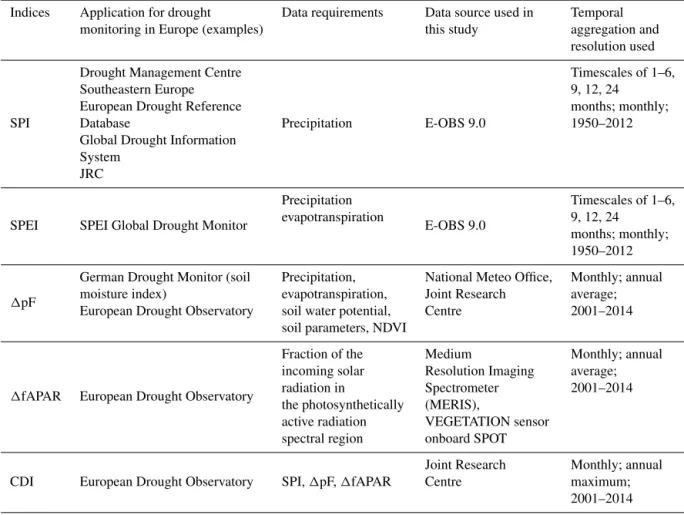
Variables which describe drought hazard are numerous, and can be categorised into two main groups: indicators and in-dices (Heim, 2002; Zargar et al., 2011). Drought indica-tors directly measure a certain facet of the drought haz-ard, e.g. climatological conditions, vegetation health, or soil moisture by a quantitative measure. Drought indices, such as the Standardised Precipitation Index (SPI) or Soil Mois-ture Anomaly (1pF), are quantitative measures characteris-ing drought levels by assimilatcharacteris-ing data from one or multiple drought indicators to a single numerical value (Zargar et al., 2011). Unlike these, combined drought indices, e.g. drought intensity of the US Drought Monitor (Svoboda et al., 2002) or the Combined Drought Indicator of the EDO (Sepulcre Canto et al., 2012) blend drought indicators and indices to a categorical hazard severity index. For the purpose of this study, focus is on drought indices that are commonly rec-ommended (Stahl et al., 2015), readily available, monitored, and used operationally in Europe for drought monitoring (Ta-ble 1). For the purpose of this work, all drought indices (pre-sented below) were first derived at the original grid scale on a monthly basis for periods with the necessary data availabil-ity. To match the spatial resolution of recorded impacts, these drought indices were aggregated to the NUTS-combo scale (Fig. 1, right panel) by taking the mean of gridded values.
transforma-Table 1.Overview of selected drought indices.
Indices Application for drought Data requirements Data source used in Temporal monitoring in Europe (examples) this study aggregation and
resolution used
SPI
Drought Management Centre
Precipitation E-OBS 9.0
Timescales of 1–6,
Southeastern Europe 9, 12, 24
European Drought Reference months; monthly;
Database 1950–2012
Global Drought Information System
JRC
SPEI SPEI Global Drought Monitor
Precipitation
E-OBS 9.0
Timescales of 1–6,
evapotranspiration 9, 12, 24
months; monthly; 1950–2012
1pF
German Drought Monitor (soil Precipitation, National Meteo Office, Monthly; annual moisture index) evapotranspiration, Joint Research average; European Drought Observatory soil water potential, Centre 2001–2014
soil parameters, NDVI
1fAPAR European Drought Observatory
Fraction of the Medium Monthly; annual incoming solar Resolution Imaging average; radiation in Spectrometer 2001–2014 the photosynthetically (MERIS),
active radiation VEGETATION sensor spectral region onboard SPOT
CDI European Drought Observatory SPI,1pF,1fAPAR
Joint Research Monthly; annual
Centre maximum;
2001–2014
tion of the precipitation time series into a standardised nor-mal distribution” (Lloyd-Hughes and Saunders, 2002), and is commonly used to estimate wet or dry conditions based on long-term records of monthly precipitation. SPI is com-puted by summing precipitation overnmonths, termed ac-cumulation periods, and is typically calculated at a monthly resolution. For instance, SPI-3 for December represents the number of standard deviations from the standard normal dis-tribution of accumulated precipitation for Oct–Dec relative to a given reference period. The SPI’s strength is its low data needs and its multiscalar nature. It can be calculated for various accumulation periods and therefore can be re-lated to different types of drought (e.g. soil moisture drought or hydrological drought) and temporal duration (e.g. sum-mer drought to multiyear drought). Nevertheless, the SPI has limited interpretability for short accumulation periods (<2 months) in dry regions where monthly precipitation is often near 0 (Stagge et al., 2015a). For this study we used gridded monthly aggregated precipitation from the E-OBS-9 data set and derived the SPI for accumulation periods of 1–24 months (SPI-1, SPI-2, etc.) based on the gamma distri-bution with a baseline for standardisation from 1970 to 2010. Subsequently, the gridded monthly SPI values were spatially
aggregated by averaging all grid cells within each NUTS-combo level.
The SPEI (Vicente-Serrano et al., 2010; Stagge et al., 2015b) is an alternative drought index, which is defined as precipitation minus potential evapotranspiration. The index thus provides a more comprehensive measure of the climatic water balance while avoiding problems with zero precipita-tion as for the SPI. Consequently, it has been growing in pop-ularity (Beguería et al., 2010; Lorenzo-Lacruz et al., 2010; Blauhut et al., 2015a). Here, the SPEI was calculated based on monthly aggregated E-OBS-9 data following the recom-mendations of Stagge et al. (2015a), which uses the Har-greaves equation (HarHar-greaves, 1994) to estimate potential evapotranspiration and the generalised extreme value distri-bution for normalisation based on data from 1970 to 2010. Finally, all gridded SPEI indices were spatially averaged to NUTS-combo level.
processes and is the key indicator of agricultural drought (Kulaglic et al., 2013; Hlavinka et al., 2009; Potop, 2011). The JRC’s EDO provides daily and 10-day assessments of the moisture content of the top soil layer (upper 30 cm). Soil moisture is obtained from the LISFLOOD distributed rainfall–runoff model with a grid-cell resolution of 5 km across Europe, using daily meteorological input from the JRC MARS meteorological database. Soil moisture is ex-pressed as soil suction (pF), providing a quantitative mea-sure of the force needed to extract water from the soil ma-trix. Soil moisture anomalies (1pF) are then calculated as the standardised deviation from the long-term average for the period 1996–2014, and are used as input for the CDI. This standardisation results in a quantification of the soil moisture deficit which is normally distributed and thus comparable to the SPI and other similar indices. For this study, the index was aggregated temporally to monthly values, and spatially to NUTS-combo level by averaging.
Direct measurement of stomatal activity (or photosyn-thetic activity, e.g. NDVI, VCI) (Chopra, 2006; Amoako et al., 2012) has been applied in many drought hazard analy-ses and has directly been used as a proxy for drought im-pacts (Skakun et al., 2014). The JRC derives the fraction of absorbed photosynthetically active radiation (fAPAR) from satellite measurements at approximately 1 km spatial reso-lution and for 10-day periods. The fAPAR is a quantitative measure of the fraction of solar energy that is absorbed by vegetation and a proxy for the status of the vegetation cover. Analogous to the SPI and soil moisture, fAPAR anomalies (1fAPAR) are calculated as the standardised deviation from the long-term mean (1975–2010). For this study, the index was averaged to monthly values and the NUTS-combo level. The fAPAR anomaly can be associated with plant productiv-ity and has therefore been recommended as an agricultural drought index by the UN Global Climate Observing tem (GCOS) and the FAO Global Terrestrial Observing Sys-tem (GTOS). However, fAPAR measures the photosynthetic activity of the vegetation cover only, which can be due to drought but also related to factors such as pests and diseases. It is therefore important to analyse the index in conjunction with other indices in order to ensure the link to a drought situation.
The Combined Drought Indicator (CDI) (Sepulcre-Canto et al., 2012) generated by the JRC represents a logical com-bination of several drought indices to detect the severity of agricultural/ecosystem drought with a time step of 10 days. The method is a classification scheme that corresponds to dif-ferent stages of drought propagation from the initial precipi-tation deficit, over a soil moisture deficit, to a water stress for the vegetation canopy. It is a logical combination of the SPI for 1- and 3-month accumulation periods,1pF, and1fAPAR with adjusted time lags. It results in four increasingly severe drought states: Watch, Warning, Alert, and Alert2, as well as two recovery states: Partial recovery and Full recovery. For the purpose of our analysis the levels of recovery were
ne-glected. For this study, monthly and annual maxima within each NUTS-combo region were selected as further hazard indices available for the modelling.
2.3 Vulnerability factors
The most commonly used method to assess vulnerability to drought or other natural hazards is to employ a set of proxy factors or composites of them. These factors aim at capturing different issues that influence the level of vulnerability of a system to a given hazard, herein referred to as vulnerability factors. Vulnerability is often assessed through the combina-tion of factors in the following components of vulnerability: – Exposure is the extent to which a unit of assessment
falls within the geographical range of a hazard event (Birkmann et al., 2013).
– Sensitivity is the occupance and livelihood characteris-tics of the system (Smit and Wandel, 2006).
– Adaptive capacity is the particular asset bundles for risk reduction (Pelling and Uitto, 2001; Gosling et al., 2009).
In Europe, the assessment of vulnerability to drought has been undertaken mostly at national or local scales. With the exception of comprehensive efforts to characterise causes, components, and factors of drought vulnerability (Flörke et al., 2011; Lung et al., 2011), De Stefano et al. (2015) was the first to map a vulnerability index at a pan-European scale. This study builds on the experience gained in that effort, which was complemented by some additional data, as ex-plained below.
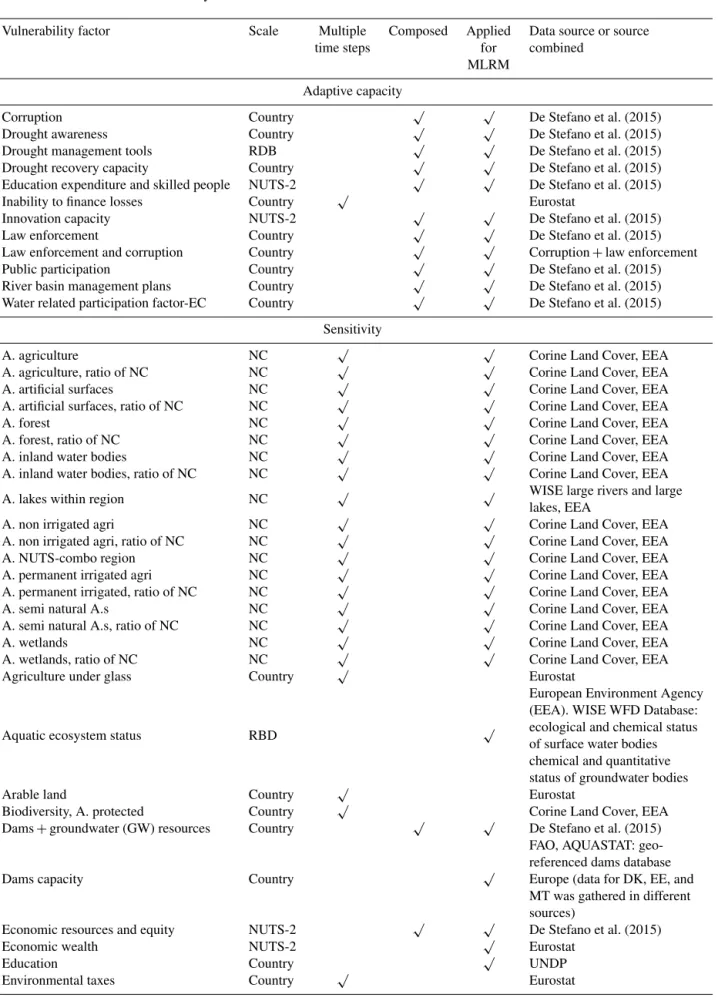
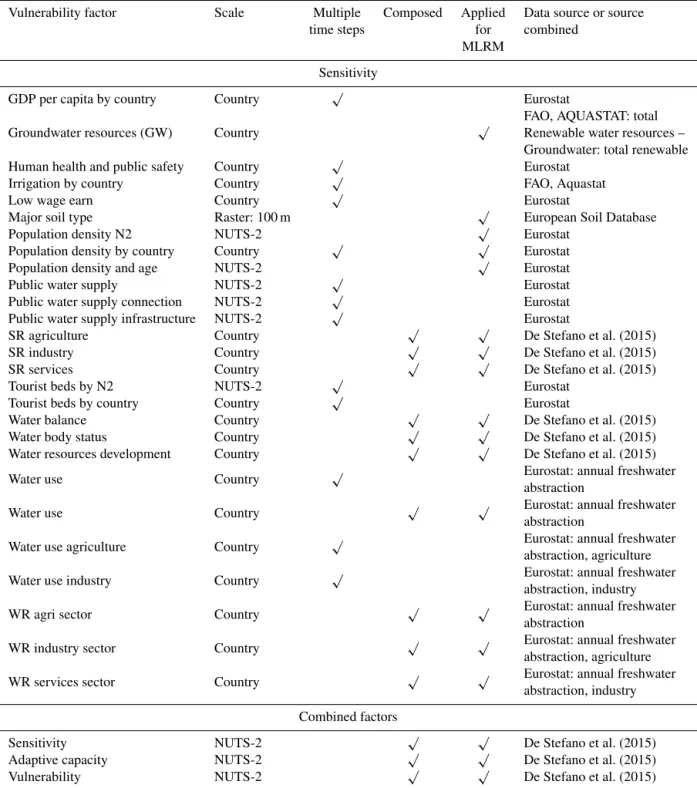
De Stefano et al. (2015) defined 16 vulnerability factors grouped into three thematic components: exposure (1), sen-sitivity (5), and adaptive capacity (10). The latter further sub-divided into four classes. The factors were assessed through a large set of parameters produced at the NUTS-2 resolu-tion for the 28 member states of the European Union plus Norway and Switzerland. To build the data set, De Stefano et al. (2015) extracted data from international databases, in-cluding Aquastat, the Eurobarometer, European Commis-sion, the European Environment Agency, Eurostat, the World Bank, FAO, as well as from the literature. In order to be able to compare and combine data describing different factors, De Stefano et al. (2015) normalised the data from 0 to 1. Combined vulnerability factors and the vulnerability index itself were generated on the basis of equal weights (more de-tails on the processes can be found in their report). For this analysis, we obtained the raw data as initially collected, their normalised values, as well as combined versions of vulnera-bility factors (Table 2).
Table 2.Factors used to assess vulnerability.
Vulnerability factor Scale Multiple Composed Applied Data source or source
time steps for combined
MLRM
Adaptive capacity
Corruption Country √ √ De Stefano et al. (2015)
Drought awareness Country √ √ De Stefano et al. (2015)
Drought management tools RDB √ √ De Stefano et al. (2015)
Drought recovery capacity Country √ √ De Stefano et al. (2015) Education expenditure and skilled people NUTS-2 √ √ De Stefano et al. (2015)
Inability to finance losses Country √ Eurostat
Innovation capacity NUTS-2 √ √ De Stefano et al. (2015)
Law enforcement Country √ √ De Stefano et al. (2015)
Law enforcement and corruption Country √ √ Corruption+law enforcement
Public participation Country √ √ De Stefano et al. (2015)
River basin management plans Country √ √ De Stefano et al. (2015) Water related participation factor-EC Country √ √ De Stefano et al. (2015)
Sensitivity
A. agriculture NC √ √ Corine Land Cover, EEA
A. agriculture, ratio of NC NC √ √ Corine Land Cover, EEA
A. artificial surfaces NC √ √ Corine Land Cover, EEA
A. artificial surfaces, ratio of NC NC √ √ Corine Land Cover, EEA
A. forest NC √ √ Corine Land Cover, EEA
A. forest, ratio of NC NC √ √ Corine Land Cover, EEA
A. inland water bodies NC √ √ Corine Land Cover, EEA
A. inland water bodies, ratio of NC NC √ √ Corine Land Cover, EEA
A. lakes within region NC √ √ WISE large rivers and largelakes, EEA
A. non irrigated agri NC √ √ Corine Land Cover, EEA
A. non irrigated agri, ratio of NC NC √ √ Corine Land Cover, EEA
A. NUTS-combo region NC √ √ Corine Land Cover, EEA
A. permanent irrigated agri NC √ √ Corine Land Cover, EEA
A. permanent irrigated, ratio of NC NC √ √ Corine Land Cover, EEA
A. semi natural A.s NC √ √ Corine Land Cover, EEA
A. semi natural A.s, ratio of NC NC √ √ Corine Land Cover, EEA
A. wetlands NC √ √ Corine Land Cover, EEA
A. wetlands, ratio of NC NC √ √ Corine Land Cover, EEA
Agriculture under glass Country √ Eurostat
Aquatic ecosystem status RBD √
European Environment Agency (EEA). WISE WFD Database: ecological and chemical status of surface water bodies chemical and quantitative status of groundwater bodies
Arable land Country √ Eurostat
Biodiversity, A. protected Country √ Corine Land Cover, EEA
Dams+groundwater (GW) resources Country √ √ De Stefano et al. (2015)
Dams capacity Country √
FAO, AQUASTAT: geo-referenced dams database Europe (data for DK, EE, and MT was gathered in different sources)
Economic resources and equity NUTS-2 √ √ De Stefano et al. (2015)
Economic wealth NUTS-2 √ Eurostat
Education Country √ UNDP
Table 2.Continued.
Vulnerability factor Scale Multiple Composed Applied Data source or source
time steps for combined
MLRM
Sensitivity
GDP per capita by country Country √ Eurostat
Groundwater resources (GW) Country √
FAO, AQUASTAT: total Renewable water resources – Groundwater: total renewable
Human health and public safety Country √ Eurostat
Irrigation by country Country √ FAO, Aquastat
Low wage earn Country √ Eurostat
Major soil type Raster: 100 m √ European Soil Database
Population density N2 NUTS-2 √ Eurostat
Population density by country Country √ √ Eurostat
Population density and age NUTS-2 √ Eurostat
Public water supply NUTS-2 √ Eurostat
Public water supply connection NUTS-2 √ Eurostat
Public water supply infrastructure NUTS-2 √ Eurostat
SR agriculture Country √ √ De Stefano et al. (2015)
SR industry Country √ √ De Stefano et al. (2015)
SR services Country √ √ De Stefano et al. (2015)
Tourist beds by N2 NUTS-2 √ Eurostat
Tourist beds by country Country √ Eurostat
Water balance Country √ √ De Stefano et al. (2015)
Water body status Country √ √ De Stefano et al. (2015)
Water resources development Country √ √ De Stefano et al. (2015)
Water use Country √ Eurostat: annual freshwater
abstraction
Water use Country √ √ Eurostat: annual freshwaterabstraction
Water use agriculture Country √ Eurostat: annual freshwaterabstraction, agriculture
Water use industry Country √ Eurostat: annual freshwaterabstraction, industry
WR agri sector Country √ √ Eurostat: annual freshwaterabstraction
WR industry sector Country √ √ Eurostat: annual freshwaterabstraction, agriculture
WR services sector Country √ √ Eurostat: annual freshwaterabstraction, industry
Combined factors
Sensitivity NUTS-2 √ √ De Stefano et al. (2015)
Adaptive capacity NUTS-2 √ √ De Stefano et al. (2015)
Vulnerability NUTS-2 √ √ De Stefano et al. (2015)
Scale: indicates the spatial detail of information. Multiple time steps: vulnerability data have been available for different time steps or only the most recent state of the system. Composed: vulnerability factors are a composition of different data. Applied to MLRM: factor has been analysed in multivariable logistic regression models (step two) as a possible best-performing predictor for impact detection. A.=area of, SR=socioeconomic relevance, WR=water use relevance, NC=NUTS-combo region, N2=NUTS-2 region, RBD=river basin district, MLRM=multivariable logistic regression model.
mainly from Eurostat (Eurostat, http://ec.europa.eu/eurostat/ data/database) and the European Environment Agency (http: //www.eea.europa.eu/data-and-maps). Data on land cover as derived from the CORINE Land Cover Datasets (http://www. eea.europa.eu/data-and-maps) were expressed as a
ag-gregations (e.g. “Population density” for NUTS-2 or country level), for different time steps (e.g. “Water use” for single or multiple time steps), or related to different spatial scales (e.g. “Area of agriculture” to “Area of agriculture” by NUTS-combo level). Furthermore, individual components of com-bined vulnerability factors are analysed (e.g. “Dams capac-ity” and “Groundwater resources” for “Dams+groundwater resources”).
For vulnerability data which did not have multiple time steps available, the most recent information for the en-tire period of investigation was applied. Vulnerability data with multiple time steps were assigned to the corresponding year, and preceding years up to the next time step available (e.g. available time steps were 1976, 1990 and 2003; data for 1970–1976, 1977–1990, and 1991–2012 were applied).
3 Methods
The overall approach followed a series of steps to find the best logistic regression models. Hereby one model is deter-mined for each European macro region and impact category, using annual impact occurrence as a target variable and cor-responding hazard and vulnerability observations as predic-tors. This is achieved by employing a regionally pooled set of target and predictor variables that includes all NUTS-combo regions that lie within the macro region. NUTS regions that did not have any reported impact or information on a given vulnerability factor were disregarded. Step 1 tested the pre-dictors SPEI and SPI for the temporal aggregations of 1, 2, 3, 4, 5, 6, 9, 12, and 24 months and 69 vulnerability fac-tors as individual predicfac-tors in a univariate binary logistic regression. Step 2 employed a stepwise selection process to evaluate the best-performing combination of five possible predictors in a multivariable logistic regression model. Fi-nally, Step 3 applied the best multivariate models for selected hazard-level scenarios to create pan-European drought risk maps.
In Step 1, the ability of each single predictor (drought in-dices and vulnerability factors) to predict the occurrence of drought impacts on an annual basis was tested separately. Following Blauhut et al. (2015a), the likelihood of drought impact occurrence LIO is assessed using binary logistic re-gression models (BLMs) (Eq. 1).
log
LIO
NUTS
1−LIONUTS
=αMacro+βMacro·PNUTS (1)
The logit transformation of LIO equals the sum of the model parameterαand the product of the model parameterβMacro with the selected predictor PNUTS of the NUTS-combo re-gion. All model parameters were estimated using standard regression techniques within the framework of generalised linear models (GLMs) (Harrel Jr., 2001; Venables and Rip-ley, 2002; Zuur et al., 2009). Hence, the LIO is a mea-sure of the probability of drought impact occurrence from 0
to 1, depending on the selected predictor. The predictive power of each selected predictor was quantified by predictor-significance (p value for the parameter β) to estimate LIO and by the overall model performance. The latter is mea-sured using the area under the ROC (receiver operating char-acteristics) curve,AROC, which quantifies the skill of proba-bilistic models (Mason and Graham, 2002; Wilks, 2011) in a range from 0 to 1. Significant predictors (p values<0.05) withAROC>0.5 indicate that the resulting model will be superior to random guessing, but are still considered poor model performance (marked by a single star∗). Significant
predictors withAROC>0.7 are considered good model per-formance (∗∗), while significant predictors withAROC>0.9
are considered excellent model performance (∗∗∗).
In Step 2, the approach was expanded by stepwise model building to include multiple hazard indices and vulnerability predictors (hybrid approach) into one statistical model. This analysis follows Stagge et al. (2015b) and Blauhut and Stahl et al. (2015) and applies multivariable logistic regression to assess the LIO (Eq. 2).
log LIO
NUTS
1−LIONUTS
=αMacro+X
i
βi,Macro·HNUTS
+X
j
βj,Macro·VNUTS (2)
Again, the left-hand side is the logit transformation of LIO, whileαandβ are estimated using standard regression tech-niques within the framework of GLMs (Harrel Jr., 2001; Ven-ables and Ripley, 2002; Zuur et al., 2009). Multivariable lo-gistic regression models (MLRMs) are fitted for each impact category and macro region. For each macro region and im-pact category, the aim was to find the best combination of one or two hazard indices (H) and up to three vulnerability factors (V). Due to the short period of available data (2001– 2014) of1fAPAR,1pF, and CDI, only SPEI data of differ-ent aggregation periods were used as hazard indices for this part of analyses. The combined vulnerability factors “Sensi-tivity and adaptive capacity” were also neglected as they are predetermined combinations of individual factors that might also enter the model as predictors, resulting in multicollinear-ity.
with smaller numbers indicating better models. Accordingly, a second hazard index is only chosen for the final MLRM if AROC increases or remains constant and BIC decreases.
A maximum of two hazard indices are allowed in the final MLRM.
Furthermore then, up to three vulnerability factors are in-cluded into the model in a stepwise fashion based on the same criteria. Proceeding as in the previous step, the best-performing vulnerability factors are only considered for the final MLRM if they improve the overall model, either in-creasingAROC or producing equalAROC, but a lower BIC.
IfAROCdecreases or remains constant with a poor BIC, the
factor was not added to the final MLRM and further vulner-ability factors were not analysed. A maximum of three vul-nerability factors were included into the resultant MLRM.
In Step 3 of the study, the resultant MLRMs were applied to construct drought risk maps that show the likelihood of impact occurrence for three selected hazard levels, based on the standard deviation from normal−0.5, −1.5, and −2.5. The hazard predictors were all standardised indices repre-senting a certain hazard severity and likely frequency of oc-currence. The definition of drought severity for SPI, SPEI, 1pF, and1fAPAR is inspired by the definition of McKee et al. (1993) who assigned standard deviations from normal to hazard severity levels for SPI, with a threshold of 1 corre-sponding to a return period of 6.3 years, classified as mod-erate drought, and −2 as extreme drought conditions. The final pan-European drought risk map presents the LIO by the best-performing combination of predictors for 15 impact cat-egories and for 3 hazard levels. For countries with a lack of sufficient vulnerability data (Table S1 in the Supplement), LIO was estimated using the best hazard-only model.
4 Results
4.1 Distribution of drought impacts and impact characteristics
As shown in Fig. 2, the majority of the reported drought impacts occurred during well-known major drought events: 1975–1976 in central Europe, 1991–1995 in the Mediter-ranean, 2003 all over Europe (except the Mediterranean), and 2004–2007 in the western Mediterranean (Stagge et al., 2013; Stahl et al., 2016), as well as in more recent events, e.g. the drought of 2010–2012 in the United King-dom (Kendon et al., 2013; Parry et al., 2013), the Eu-ropean drought of 2011 (DWD, 2011), and the 2011– 2012 drought in southeastern Europe (Spinoni et al., 2015). The highest number of reports is represented by the drought events of “1975–1976 Europe”, “2003 Europe”, and “2010– 2012 UK”.
Except for northeastern Europe, almost all impact cate-gories (except “Air Quality”) have at least one annual im-pact recorded per macro region (Blauhut et al., 2015a). An
increasing trend of impact reports with time is observed for all macro regions. Overall, maritime Europe has the high-est number of impacted years in total, which is consistent with this region’s higher number of overall impact reports. Generally, the number of reported impacts cluster with well-known drought events, although impacts on “Forestry” show a delay and longer duration compared to the meteorological hazard. “Waterborne Transportation”, “Tourism and Recre-ation”, “Public Water Supply”, “Water Quality”, and “Fresh-water Ecosystems” show a similar temporal pattern of impact occurrence. Impacts on “Agriculture and Livestock Farm-ing”, Public Water Supply, and Freshwater Ecosystems are reported for almost every year. For southeastern Europe, Agriculture and Livestock Farming has the most frequent im-pacts. Furthermore, Public Water Supply and “Human Health and Public Safety” have a continuous presence of impacts from 1983 to 1996. From 2000 on, all impact categories have reported impacts. Northeastern Europe has only a few impact categories with drought-impacted years, but Forestry shows a long continuous time with impacts, from 1991 on. The west-ern Mediterranean region shows a less scattered pattwest-ern. Be-sides a low number of impacts from the middle of the 1970s until the beginning of the 1980s for Agriculture and Live-stock Farming, Forestry, “Energy and Industry”, and Public Water Supply impacts occurred during the two major long-term drought events of 1989–1995 and 2003–2008.
The observed increase in the occurrence of reported im-pacts from 2000 onwards may have several reasons; one of the most important being an increased reporting behaviour (governmental and news) due to an increased awareness of natural hazard impacts and the possibility of easy and fast communicated information (internet). Nevertheless, we can-not exclude the fact that Europe is warming and that this warming may lead to an increase in reported drought im-pacts.
4.2 Suitable predictor variables for hazard and vulnerability
First, the individual predictors in binary logistic regres-sion models, BLMs, were evaluated by impact category and macro region. Data availability allowed the identification of robust BLMs for all impact categories only for the mar-itime Europe region. For southeastern Europe, the impact category “Terrestrial Ecosystems”, for northeastern Europe Water Quality, and for the western Mediterranean Terres-trial Ecosystems, Air Quality, and Human Health and Public Safety could not be modelled. All hazard indices performed differently across regions and impact categories. Tables S2 to S4 show the model performance for the individual hazard indices and the vulnerability factors. These detailed results are only briefly summarised here as they only represent a preliminary screening step in the model-building process.
grow-ing season, but the annual average1fAPAR appears not to be a suitable predictor. The 1pF performs as the overall best predictor with mostly good models between March and November and the best overall performance of the annual average of1pF. The CDI resulted in only few poor to good models.
For the indices of SPEI, a longer period of hazard data was available (1970–2012) than for the EDO indices and hence overall better model fits were achieved. The best-performing indices (in terms of aggregation times) are more specific to the impact category than to the macro region and tend to span from 6- to 12-month aggregation times. SPEI-12 performs with good to excellent models for the majority of impact categories and macro regions from August to September. In comparison to the other impact categories, few robust models were identified for Forestry and Public Water Supply. In gen-eral, SPI follows the similar performance pattern as SPEI, but with consistently lower model performance and is therefore not shown in the tables. To estimate the influence of longer time series for model input, Table S5 shows model perfor-mance for SPEI applied for the shorter time period 2001– 2012. Resultant model performance follows a similar but less strong performance pattern as the longer time series.
To identify patterns in the many vulnerability factor vari-ables tested, Table S4 groups the individual vulnerability fac-tors by the vulnerability components of adaptive capacity and sensitivity. In general, none of these obtained an excel-lent model performance. Factors related to “Sensitivity” that characterise land use and are based on multiple time steps, such as “Area of Agriculture”, “Area of Forest”, “Area of Semi-natural Areas”, and “Percentage of Area of Agricul-ture” proved to be significant in many cases. In addition, ro-bust model predictors for all macro regions include “Dams and Groundwater Resources” and “Water related Participa-tion EC” for Agriculture and Livestock Farming or “Social relevance for services sector” for Energy and Industry. For the remaining vulnerability factors, no clear patterns were detectable. Only few robust models could be identified. Pre-dictive skill for vulnerability factors such as “GDP by coun-try”, “Public Water Supply connection by NUTS-2” or “Bio-diversity, Areas protected” was not found. The combined vul-nerability factors resulted in few macro region and impact category robust models. Impact occurrence for the categories “Aquacultures and Fisheries”, “Soil Systems”, “Wildfires” and Air Quality were generally difficult to model by vulner-ability factors.
In summary, the drought hazard indices SPEI and SPI alone were better suited than the rather static vulnerability factors alone to estimate the likelihood of annual drought impact occurrence, and will therefore be treated as more im-portant for the identification of the best-performing MLRMs (Step 2, ref. Sect. 3).
4.3 Estimating the best-performing combinations of hazard indices and vulnerability factors to assess the likelihood of impact occurrence
Out of the final 44 best-performing MLRMs, 18 models used the maximum of three vulnerability predictors, 14 models used two, 9 models only one, and 3 models did not use any vulnerability predictor at all. For the majority of MLRMs, two hazard predictors are used, whereas four models found that one hazard index alone was sufficient to obtain the opti-mum model performance.
Table 3 shows the MLRM performance for the best-performing hazard indices and the improvement for the final models that include vulnerability factors. In general, integrat-ing vulnerability factors to the MLRMs improved the model performance, except for models of the impact categories Soil Systems and Wildfires for southeastern Europe and Forestry for the western Mediterranean region. The improvement in model performance differed by region and impact category, whereas an increase ofAROC and a decrease of BIC reflect
model performance improvement.1ROC (improvement of AROC with vulnerability factor predictors) ranges from 0
to 0.32 with an average increase of 0.08, whereas 1BIC range between 9 and−347 with an average value of−65.
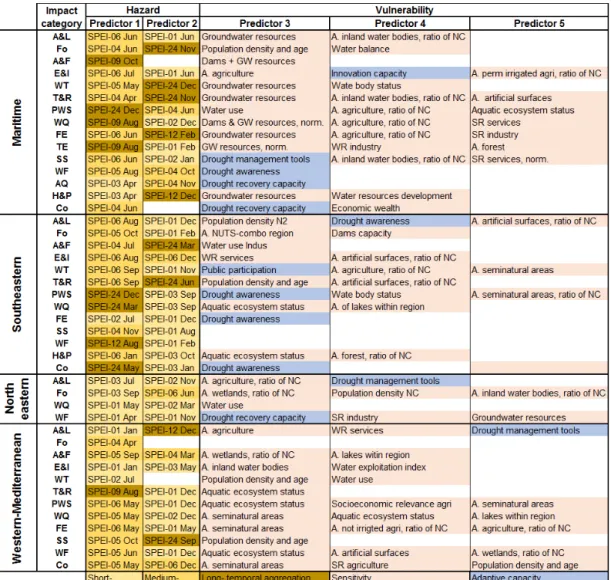
Figure 3 summarises the selected hazard predictors and vulnerability factor predictors for all models. Among the drought hazard indices, 34 short-, 32 mid-, and 18 long-term SPEI predictors were selected for the best model perfor-mance (with short-, mid-, and long-term periods correspond-ing to 1–3, 4–9, and 12–24 month accumulation). The major-ity of MLRMs with two selected hazard indices are combina-tions of SPEIs with one longer and one shorter accumulation period. Generally, the most frequent SPEI predictors cover the summer months from May to August with accumulation intervals between 1 and 6 months.
For all regions, about 40 % of the selected vulnerabil-ity factors describe land surface characteristics related to agricultural and semi-natural land cover. Among the vul-nerability factors, only 16 % of those selected are associ-ated with Adaptive Capacity components. For the western Mediterranean, all selected vulnerability factors, apart from “Drought Management Tools”, describe Sensitivity.
4.4 Mapping drought risk
T able 3. MLRM performance of models with hazard predictors only and performance impro vement ( 1 ) with added vulnerability factors. IC Maritime Europe Southeastern Europe Northeastern Europe W estern Mediterranean Hazard V ulnerability Hazard V ulnerability Hazard V ulnerability Hazard V ulnerability n A R OC BIC n 1A R OC 1 BIC n A R OC BIC n 1A R OC 1 BIC n A R OC BIC n 1A R OC 1 BIC n A R OC BIC n 1A R OC 1 BIC A & L 2 0.80 749 2 0.07 − 95 2 0.86 378 3 0.04 − 196 2 0.02 68 2 0.02 − 5 2 0.79 318 3 0.10 − 52 Fo 2 0.83 477 2 0.10 − 110 2 0.82 109 2 0.08 − 30 2 0.32 287 3 0.32 − 110 1 0.75 50 0 A & F 1 0.96 86 1 0.01 − 2 2 0.98 47 1 0.01 − 6 2 0.97 37 2 0.02 9 E &I 2 0.91 257 3 0.04 − 25 2 0.86 237 2 0.10 − 167 2 0.82 178 2 0.06 − 23 WT 2 0.82 456 2 0.09 − 50 2 0.87 114 3 0.11 − 46 1 0.98 45 2 0.02 − 9 T & R 2 0.85 331 3 0.09 − 45 2 0.75 92 2 0.21 − 34 2 0.89 116 1 0.05 − 16 PWS 2 0.76 1125 3 0.16 − 347 2 0.75 511 3 0.19 − 298 2 0.84 266 3 0.07 − 29 WQ 2 0.83 606 3 0.08 − 115 2 0.78 178 2 0.20 − 86 2 0.83 182 3 0.12 − 57 FE 2 0.77 845 3 0.14 − 207 2 0.93 119 1 0.05 − 60 2 0.01 37 1 0.01 0 2 0.83 238 3 0.09 − 40 TE 2 0.85 311 3 0.10 − 83 SS 2 0.79 302 3 0.11 − 31 2 0.95 64 0 2 1.00 30 1 0.00 − 6 WF 2 0.86 445 1 0.02 − 25 2 0.93 134 0 2 0.04 58 3 0.04 9 2 0.90 101 3 0.08 − 12 A Q 2 0.95 67 1 0.02 2 H & P 2 0.94 287 2 0.02 − 20 2 0.72 293 2 0.27 − 198 Co 1 0.99 60 2 0.01 − 16 1 0.93 65 1 0.05 − 20 2 0.88 127 3 0.10 − 31 IC: impact cate gory; n :number of indices or vulnerability factors applied; 1A R OC :dif ference of A R OC of MLRM with vulnerability factors to MLRM without vulnerability factors; 1 BIC: dif ference of BIC of MLRM with vulnerability factors to MLRM without vulnerability factors (ne gati ve values indicate performance increase); A & L: Agriculture and Li vestock Farming, Fo: Forestry ,A & F: Aquaculture and Fisheries, E & I: Ener gy and Industry ,WT :W aterborne T ransportation, T & R: Tourism and Recreation, PWS: Public W ater Supply ,WQ: W ater Quality ,FE: Freshw ater Ecosystems, TE: Terrestrial Ecosystems, SS: Soil Systems, WF: W ildfires, A Q: Air Quality ,H & P: Human Health and Public Safety ,Co: Conflicts.
Figure 3.Selected of the best-performing predictors, yellow: SPEI with short temporal accumulation, light yellow to brown: SPEI with
increasing temporal aggregation (short, medium, and long temporal accumulation), red: vulnerability factors associated with sensitivity, blue: vulnerability factors associated with adaptive capacity, A.=Area of, GW=Groundwater, norm.=normalised, NC=NUTS-combo
region, N2=NUTS-2 region, SR=Socioeconomic relevance, WR=Water use relevance.
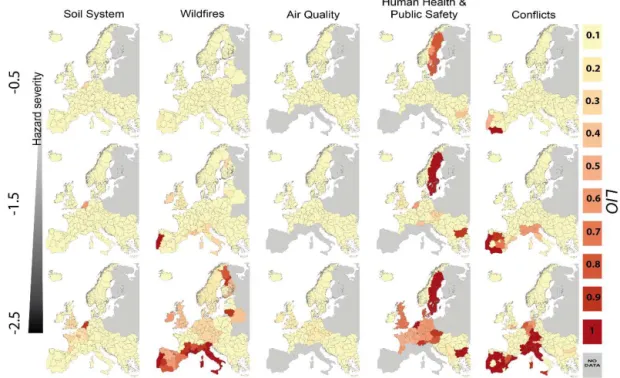
Health and Public Safety are at high risk for Bulgaria, Czech Republic, Switzerland, the Netherlands and Sweden and in-creased risk for the remaining maritime regions. The risk of “Conflicts” under extreme dry conditions is either very high (majority of the western Mediterranean and Germany, Switzerland, the Netherlands, and the southeast UK) or not a risk at all.
5 Discussion
5.1 Hazard indices and vulnerability factors’ individual predictive potential
The systematic test of a series of hazard indices and vul-nerability factors individually allowed a first order assess-ment of their potential to predict impact occurrence. Despite
Figure 4.Drought risk maps with the likelihood of impact occurrence (LIO) in the impact categories Agriculture and Livestock Farming, Forestry, Aquaculture and Fisheries, Energy and Industry, and Waterborne transportation (columns) for three hazard levels of SPEI with
−0.5: near normal,−1.5: severely dry, and−2.5: extremely dry (rows).
Figure 5.Drought risk maps with the likelihood of impact occurrence (LIO) in the impact categories Tourism and Recreation, Public Water
Figure 6.Drought risk maps with the likelihood of impact occurrence (LIO) in the impact categories Soil System, Wildfires, Air Quality,
Human Health and Public Safety, and Conflicts; (columns) for three hazard levels of SPEI with−0.5: near normal,−1.5: severely dry, and −2.5: extremely dry (rows).
Generally, the tests showed that the hazard impact link-age will benefit from longer time series and thus a wider range of drought conditions. Furthermore, it was found that the overall better performance of SPI and SPEI to JRC haz-ard indices was not due to the differences in time series length. SPEI shows an overall better model performance than SPI for all accumulation times and impact categories. This is in agreement with the studies of Lorenzo-Lacruz et al. (2010) and López-Moreno et al. (2013), who found the SPEI to be better correlated than the SPI with environmen-tal impacts. The overall best-performing (across all impact categories and macro regions) temporal accumulation was 12 months, which is as expected, since the target variables are impact occurrences on an annual basis. The best perfor-mance was found for SPEI-12 of September and December. SPEI-12 of December measures the same calendar year used for aggregating annual impact information. Alternatively, the SPEI-12 of September measures water balance during a wa-ter year, defined by the US Geological Survey as 1 October– 30 September, which captures the growing season along with the entire preceding winter. Thus, both indices can be recom-mended for analyses at an annual scale.
The tested vulnerability factors alone revealed generally limited skills to predict impact occurrence, with exceptions of land surface cover types or information on regional wa-ter uses/storages. This is somehow at odds with the fact that the most commonly used vulnerability factors in vulnerabil-ity assessments are related to “Economic and financial
re-sources” and to technical, technological, and infrastructural aspects (González-Tánago et al., 2015). As few of the fac-tors varied in time, the models reflect mostly spatial differ-ences of impact occurrence among the pooled NUTS-combo regions rather than temporal differences. Although data to characterise vulnerability in Europe are numerous, there are important gaps that implied constraints in our analysis and predictor selection. Much of the data are available only at country level or are not available in a centralised data reposi-tory. For instance, De Stefano et al. (2015) observe that there are no European-wide data of water use efficiency, or data about alternative water sources such as desalination, reused water, or rainwater harvesting, especially in those locations where these sources are important, such as the islands or tourist areas on the Mediterranean coast. We found that vul-nerability factor normalisation practices did not improve the predictive potential model performance and composed vul-nerability factors were not better than individual ones. For an application like in our study, this can be interpreted as mean-ing that prior standardisation, composition, and weightmean-ing of vulnerability factors appears unnecessary.
5.2 Building hybrid models with hazard indices and vulnerability factors
computation-ally too expensive for this study. Nevertheless, it was possi-ble to identify suitapossi-ble models for most cases and the multi-variable selection process further elucidated joint important controls on drought risk. The majority of SPEIs selected for final model application were combinations of SPEI with dif-ferent accumulation times, often short and long periods. The stepwise procedure showed that hazard indices with tempo-ral accumulations from 3 to 12 months genetempo-rally performed best, depending on the region and impact. These results con-firmed previous case studies on the best combinations, e.g. by Stagge et al. (2015b), and common practice using combined drought monitoring indices, such as the US Drought Mon-itor (Svoboda et al., 2002). The majority of MLRMs also performed better by adding at least one vulnerability fac-tor, suggesting that these can improve the predictability of annual drought impact occurrence. The vulnerability factors selected are dominated by factors associated with the vulner-ability component of Sensitivity. This could be explained by the fact that adaptive capacity evolves much faster than sen-sitivity and the values of “Adaptive Capacity” factors used in the models refer to present conditions while impacts span over a 50-year time period. Thus, the poor performance of Adaptive Capacity indicators as predictors of impact could be due to the mismatch between the adaptive capacity that existed when impact occurred in the past and the one used in our models rather than their lack of relevance in absolute terms.
The predictor selection was likely influenced by some of the particular biases and characteristics of the underlying databases. The EDII’s impact categories broadly pool im-pact types of similar topics. Reported imim-pact types within a category can be very different and reported impact types can differ between countries (Stahl et al., 2015). Using Agri-culture and Livestock Farming impacts as an example, the large range of SPEIs selected for the final models (with re-gard to temporal accumulation and month) can be due to sev-eral reasons. These may include differences in impacts in irrigated vs. fed agriculture. Whereas impacts on rain-fed agriculture are often described best by meteorological drought (short accumulation periods), irrigated agriculture strongly depends on lagged hydrological drought (Pedro-Monzonís et al., 2015). Characteristics of location and cul-tivation may also play a role. Depending on the climatic and orographic conditions of a NUTS-combo region, impact-category-specific characteristics differ (e.g. growing season, dormancy, development). Hence, the most relevant SPEI for each region may differ in accumulation time and month se-lected. This corresponds e.g. to Lei et al. (2011) and Po-topová et al. (2015) who detected different optimal accu-mulation times of SPEI for maize productivity for north-ern China and Czech Republic. A reason for the selection of more unexpected combination of SPEI (e.g. SPEI-6 of August was selected together with SPEI-1 in December for Agriculture and Livestock Farming in southeastern Europe)
might be due to the criterion of variable independence em-ployed.
For wildfires, Gudmundsson et al. (2014) suggested SPI with lead times not longer than 2 months to indicate ma-jor effects of wildfires in southern Europe, contradicting the longer accumulation times selected in this study. However, Gudmundsson et al. (2014) used the comprehensive Euro-pean Fire Database, whereas the EDII only contains wildfire reports that were directly attributed to drought. On the other hand, our variable selections match the results of Catry et al. (2010) who estimated that the majority (51 %) of all wild-fires occur during the summer months.
Hydrological drought takes the longest time to respond to drought conditions. Accordingly, impact categories for which surface and groundwater availability is important and often linked to water quality (e.g. higher water temperatures due to low flow) (Aquaculture and Freshwater Fisheries, En-ergy and Industry, Waterborne Transportation, Water Quality, Freshwater Ecosystems), are best predicted by longer accu-mulation times (≥SPEI-9). Impacts on Public Water Sup-ply are generally poorly predicted by SPEI. The best perfor-mances are obtained for long accumulation times (SPEI-24) indicating that impacts on water resources rely on the stor-age characteristics (natural or artificial) and thus depend on a variety of conditions that cannot be characterised by SPEI on the larger scale. Other impact categories show weaker pat-terns, but in general show better results for predictions in summer.
This seasonal focus points to a related data challenge. The temporal resolution of reported impacts, which often only re-fer to an entire season, year, or multiyear drought, does not allow an identification of the onset, duration, and ending of a given drought impact. The annual timescale employed here is a compromise between a sufficient high number of reported impacts and spatial coverage. Stagge et al. (2015b) showed that seasonal models can be constrained better, but sufficient seasonal information on impacts was not available for all re-gions or countries across Europe. Furthermore, in order to overcome data availability issues, Europe was divided into four European macro regions to pool impact information, some of which may not reflect regions with similar drought impacts and as such influence the model performance ob-tained (Blauhut et al., 2015a).
More than one-third of applied factors quantitatively charac-terise regional land use, and almost half of the selected fac-tors characterise the water resources. This is in accordance with Gonzáles Tánago et al. (2015) who summarised that drought vulnerability analyses have often applied informa-tion on water resources and land use informainforma-tion. Neverthe-less, according to Gonzáles Tánago et al. (2015), the most commonly applied information in drought vulnerability as-sessment is related to economic and financial resources and technical infrastructure, but these priorities are not reflected in our findings where e.g. “Economic Wealth”, “Public Water Supply Connection” or “Drought Recovery Capacity” were of minor importance or not selected at all in the model build-ing process. Nevertheless, the results call for a review of the relevance of vulnerability factors in wider ranges of drought cases and for progress with regard to thematic content, data generation, and transformation from qualitative to quantita-tive data and their rationalisation.
5.3 Regional patterns of modelled sectorial drought risk across Europe
Statistical models to predict drought impact occurrence re-main a relatively new approach that has proved successful within targeted country-scale studies (e.g. Bachmair et al., 2015; Stagge et al., 2015b). As with any data-driven ap-proach, the presented risk modelling relies on the quality and availability of its underlying data. Since its establishment, the EDII database has been constantly growing and now con-tains data across Europe, covering the majority of major past drought events (Stagge et al., 2013). The database used here was also considerably larger than that used in the previous pan-European risk modelling study by Blauhut et al. (2015a). This increased database, as well as addition of vulnerability factors, led to some differences in the resulting risk maps. Nevertheless, the updated EDII database still has certain bi-ases and characteristics (Stahl et al., 2016) that may affect the results of the risk models and maps this study presents. One bias in the impact data is a decreasing data availabil-ity from west to east and poor data availabilavailabil-ity in northern Europe. Additionally, using binary information of annual im-pact occurrence is less sensitive to these reporting biases than e.g. the number of reports or impacts as discussed by Bach-mair et al. (2015). Overall, uncertainties of the risk models are likely higher in regions with lower report availability as well as with lower availability of vulnerability data as in this study for the macro region of southeastern Europe.
Agriculture and Livestock Farming is the best-covered im-pact report data category across Europe and thus an issue at pan-European scale (Kossida et al., 2012; Stahl et al., 2016). In accordance with reports of the European Commis-sion (EC, 2007, 2008), the derived risk maps for Agriculture and Livestock Farming show high drought risk for most of the western Mediterranean regions, covering water scarce re-gions as detected by Strosser et al. (2012). Moderate to high
drought risk for maritime Europe confirms pattern previously identified by Blauhut et al. (2015a) based on hazard predic-tors only. A relatively low risk such as for most of France, may reflect the added vulnerability predictor, particular agri-cultural land use as well as drought management (e.g. com-pensation) tools. The relatively high risk for Sweden in the Nordic countries may reflect that agriculture is a much larger sector in Sweden than in the neighbouring countries (Eu-rostat database: “Agricultural production”, 2015). The rela-tively low drought risk for Agriculture and Livestock Farm-ing in southeastern Europe may result from the aforemen-tioned lack of data. Stahl et al. (2015) actually found the im-pact category in the region to be relatively important among all impact categories. Regional pooling for this study may also have affected these results and should be further tested in future studies.
The pattern of drought risk for Energy and Industry iden-tified by Blauhut et al. (2015a) were confirmed by this study. Regions with a high dependency on water resources for en-ergy production, such as Slovenia or Bavaria, are at higher risk of impacts in this category. As an example, Slove-nia’s total energy production is based on∼55 % hydropower sources and ∼45 % by thermal power plants (HEP, 2009) and Bavaria (and also France) has several nuclear power-plants. Quite contrarily, Norway is at low risk for severe hazard conditions even though about 98 % of its energy pro-duction is by hydropower (Christensen et al., 2013). A rela-tive index should be able to pick up deviations from normal inducing impacts on hydropower production. Rather there must be some other reasons (e.g. regional averaging of the indices, pooling of impact information to macro regions). Future work will require higher temporally and spatially re-solved impact information such as daily power production to solve this issue. Nevertheless, drought indices quantifying the absolute state of water reservoirs or sources could im-prove predictions for this impact category.
The pattern of risk of impacts on Public Water Supply differs somewhat from the results of Blauhut et al. (2015a) who presented medium risk for extreme conditions (SPEI-12= −3) all over Europe. For regions with high water stress (Mediterranean) (EEA, 2009), impacts on Public Water Sup-ply are more likely, as well as in regions where water storage capacity is limited (UK). Estimates for southeastern Europe are likely to be impaired due to data availability and regional pooling.
2012), even though this was not a selected predictor in the models (as for the other regions). In their study on drivers of vulnerability, Blauhut et al. (2015b) raised an additional point of uncertainty to consider for this category: an increase of reported impacts due to an increased ecological monitor-ing and increased public and scientific recognition. The UK has the densest surface water monitoring network in Europe and the longest history of ecological status care (Royal Geo-graphical Society (with IBG), 2012). Hence, a higher number of reported impacts even under less severe drought is likely. A high risk for southern England, northern central Europe, and the Iberian Peninsula is also detected for the impact cat-egory of Freshwater Ecosystems. For maritime Europe, the regional pattern also resembles that of diffuse agricultural emissions of nitrogen to freshwater (EEA, 2010), and for the Mediterranean it resembles that of highly irrigated regions (EEA, 2014). These relations indicate a strong influence of agriculture on Freshwater Ecosystems, which could be taken into account in future impact-data-based risk assessments.
Analysing the risk of Wildfires at the pan-European scale has particular challenges. According to the European For-est Fire Information System, over 95 % of forFor-est fires are human-induced (San-Miguel and Camia, 2009; Ganteaume et al., 2013). The EDII data only contain reports that have at-tributed fires to drought (Stahl et al., 2015). Hence, patterns of high risk as derived for the Mediterranean, the Baltics, and Finland do not fully agree e.g. with the findings of Gud-mundsson et al. (2014). However, a comparison to the forest fire hazard map by the ESPON, which is based on a com-bination of numbers of observed fires and biogeographic re-gions (EEA, 2012), and to the fire density map by Catry et al. (2010), shows high similarities for the western Mediter-ranean, maritime, and northeastern Europe with only a few national exceptions. For southeastern Europe, a high num-ber of fires has been reported, but this is not reflected in the drought risk maps.
For the impact category of Waterborne Transportation a specifically high drought risk was modelled mainly for NUTS regions with rivers of high international importance for transportation, such as the large rivers draining into the North and Baltic seas and the Danube (Eurostat, 2015).
Impacts on Tourism and Recreation can occur all over Eu-rope and throughout the year, whereas drought risk maps in-dicate comparably low risk for Spain, France, and southeast-ern Europe. However, this category incorporates a very wide range of impacts and for more informative characteristics, a more detailed analyses of impact types or subjects, e.g. light outdoor activities, freshwater, tourism, and winter sports as used by Amelung and Moreno (2009) may be required.
Conflicts caused by drought are reported over all of Europe and affect a wide range of interest groups such as farmers, fishers, golfers, or citizens. However, the risk for these re-source conflicts is elevated in southern Europe’s water scarce regions, regions with high proportion of irrigation in
agricul-ture, and regions with a high water exploitation index (EEA, 2016).
The presented hazard severity levels are based on an ar-bitrary choice inspired by McKee et al. (1993) and cannot be used as fixed threshold. In accordance with Blauhut et al. (2015a) and Stagge et al. (2015b), it should be highlighted that drought risk is sensitive to impact category and location, and develops very differently with increasing hazard sever-ity (deviation from normal). Thus, common overall seversever-ity thresholds are not recommendable.
6 Conclusion
This study tested commonly used drought hazard indices and vulnerability factors for the empirical modelling of drought risk in terms of likelihood of impact occurrence and applied these models to map sector-specific drought risk across Eu-rope. Building on prior applications of the statistical mod-elling of drought impact occurrence (Blauhut et al., 2015a; Stagge et al., 2015b; Bachmair et al., 2015), an important expansion of this study was the inclusion of vulnerability factors as predictors into the models in addition to only the hazard indices previously used. Furthermore, the use of the updated EDII database allowed a pan-European applica-tion to the risk modelling and assessment of a wider range of drought impact categories than previously possible. As with all empirical modelling, the application demonstrated the benefits of the availability of high-quality data. Repre-sentative records on past drought impacts as well as a good coverage of vulnerability factors are crucial to obtain mean-ingful models. In regions where data are scarce, modelling may be biased due to the limited information available. Haz-ard indices were confirmed to be impact-sector-sensitive and should thus be selected carefully to enable the characterisa-tion of different drought causing impacts. Here the distinc-tion was mainly made through using different accumuladistinc-tion times of SPEI. However, hydrological drought indices based on streamflow, groundwater, reservoir levels, etc. may also improve the drought impact models.