Optimization of the All-D Peptide D3 for Aβ
Oligomer Elimination
Antonia Nicole Klein1, Tamar Ziehm1, Markus Tusche1, Johan Buitenhuis2, Dirk Bartnik1, Annett Boeddrich3, Thomas Wiglenda3, Erich Wanker3, Susanne Aileen Funke1,4, Oleksandr Brener1,5, Lothar Gremer1,5, Janine Kutzsche1, Dieter Willbold1,5*
1Institute of Complex Systems, Structural Biochemistry (ICS-6), Research Center Jülich, 52425, Jülich, Germany,2Institute of Complex Systems, Soft Matter (ICS-3), Research Center Jülich, 52425, Jülich, Germany,3Neuroproteomforschung und Molekulare Mechanismen Neurodegenerativer Erkrankungen, Max-Delbrück-Centrum für Molekulare Medizin, Berlin, Germany,4Bioanalytik, Fakultät angewandte Naturwissenschaften, Hochschule für angewandte Wissenschaften Coburg, 96450, Coburg, Germany,
5Institut für Physikalische Biologie, Heinrich-Heine-Universität Düsseldorf, 40225, Düsseldorf, Germany
Abstract
The aggregation of amyloid-β(Aβ) is postulated to be the crucial event in Alzheimer’s dis-ease (AD). In particular, small neurotoxic Aβoligomers are considered to be responsible for the development and progression of AD. Therefore, elimination of thesis oligomers repre-sents a potential causal therapy of AD. Starting from the well-characterizedD-enantiomeric peptide D3, we identified D3 derivatives that bind monomeric Aβ. The underlying hypothesis is that ligands bind monomeric Aβand stabilize these species within the various equilibria with Aβassemblies, leading ultimately to the elimination of Aβoligomers. One of the hereby identifiedD-peptides, DB3, and a head-to-tail tandem of DB3, DB3DB3, were studied in detail. Both peptides were found to: (i) inhibit the formation of Thioflavin T-positive fibrils; (ii) bind to Aβmonomers with micromolar affinities; (iii) eliminate Aβoligomers; (iv) reduce Aβ -induced cytotoxicity; and (v) disassemble preformed Aβaggregates. The beneficial effects of DB3 were improved by DB3DB3, which showed highly enhanced efficacy. Our approach yielded Aβmonomer-stabilizing ligands that can be investigated as a suitable therapeutic strategy against AD.
Introduction
There are 4.2 million new cases of dementia worldwide each year with Alzheimer’s disease (AD) being the most common cause. Currently, there is no causal treatment for AD available [1,2].
Intracellular neurofibrillary tangles (NFTs), consisting of hyperphosphorylated tau and extracellular plaques, consisting predominantly of amyloid-β(Aβ), are the major pathological hallmarks of AD. The cleavage of the amyloid precursor protein (APP) by theβ- andγ- secre-tases releases Aβ. Various species of Aβare formed because the N- and C-terminal cleavage events are non-homogeneous. The most abundant species of Aβis Aβ(1–40), consisting of 40 amino acids. The second most dominant species is Aβ(1–42) [3,4].
a11111
OPEN ACCESS
Citation:Klein AN, Ziehm T, Tusche M, Buitenhuis J, Bartnik D, Boeddrich A, et al. (2016) Optimization of the All-D Peptide D3 for AβOligomer Elimination. PLoS ONE 11(4): e0153035. doi:10.1371/journal. pone.0153035
Editor:Damian Christopher Crowther, MedImmune Ltd Research and Development, UNITED KINGDOM
Received:November 16, 2015
Accepted:March 22, 2016
Published:April 22, 2016
Copyright:© 2016 Klein et al. This is an open access article distributed under the terms of the
Creative Commons Attribution License, which permits unrestricted use, distribution, and reproduction in any medium, provided the original author and source are credited.
Data Availability Statement:All data are within this paper.
Funding:D. W. was supported by grants from the “Portfolio Technology and Medicine”, the“Portfolio Drug Research”and the Helmholtz-Validierungsfonds of the Impuls und Vernetzungs-Fonds der Helmholtzgemeinschaft. D.W. was also supported by the TT-Fonds of the Technology Transfer Department of the Forschungszentrum Jülich.
According to the amyloid cascade hypothesis the aggregation of Aβis responsible for the development and the progression of AD. Various Aβaggregate species have been described, including Aβoligomers and Aβprotofibrils [5]. In particular, soluble, toxic Aβoligomers are thought to be responsible for damage of synaptic plasticity, formation of free radicals, disequi-librium of intracellular calcium distribution, chronic inflammation and increased phosphoryla-tion of tau [6,7]. Thus, inhibition of Aβoligomerization and the elimination of Aβoligomers are promising treatment strategies for the development of a causal therapy of AD.
We have previously selected the 12mer all-D-enantiomeric peptide D3 via mirror image
phage display [8,9].In vitro, D3 binds to amyloid plaques, reduces Aβaggregation to regular fibrils, eliminates Aβoligomers and converts preformed fibrils into amyloidogenic, non-fibrillar, non-toxic aggregates [10–14].In vivo, the plaque load and cerebral inflammation of transgenic mice is reduced after injection of D3 into the brain and cognitive impairment of transgenic mice is improved after oral application [10,15,16]. The original phage library, from which D3 was selected, coded for about 109different peptides. A fully randomized 12mer library would contain 2012different peptides. That equals 4 x 10¹⁵theoretically possible 12mer sequences and is absolutely impossible to achieve due to limitations in the transformation effi-ciency during generation of the original phage library. Thus, it can be expected that variation of the D3 sequence will lead to even more potent D3 derivatives.
In the present study, we screened for D3 derivatives with optimized efficiency. To facilitate the screening for various derivatives, peptide microarrays were used because they allow miniaturiza-tion, parallelization and automaminiaturiza-tion, and enable high-throughput screenings [17,18]. In addition, non-natural amino acids and linker groups, like biotin or fluorescein, can be introduced easily.
We screened more than 600 different D3 derivatives for their ability to bind monomeric Aβand characterized the five most promising candidates by examining their ability to prevent Aβfibril for-mation. For further optimization, the most promising D3 derivative DB3 was modified by design-ing a head-to-tail tandem peptide, called DB3DB3. Both peptides were characterized in more detail regarding their affinity to Aβmonomers and their efficiency to eliminate Aβoligomers.
Material and Methods
Peptides
Aβ(1–42), N-terminally biotinylated Aβ(1–42) and FITC-Aβ(1–42) were purchased from Bachem (Heidelberg, Germany). D3 (RPRTRLHTHRNR), DB1 (RPITRLHTDRNR), DB2 (RP ITTLQTHQNR), DB3 (RPITRLRTHQNR), DB4 (RPRTRLRTHQNR) and DB5 (RPITRLQT HEQR) were purchased from JPT (Berlin, Germany). DB3DB3 (RPITRLRTHQNRRPITRLRT HQNR) was purchased from peptides&elephants (Potsdam, Germany). AllD-peptides
con-sisted ofD-enantiomeric amino acids, were C-terminally amidated and>95% pure.
HFIP pretreatment of A
β
(1
–
42)
For obtaining monomeric Aβ(1–42), N-terminally biotinylated Aβ(1–42) and FITC-Aβ(1–42) were dissolved in 1,1,1,3,3,3-hexafluoroisopropanol (HFIP) overnight to a final concentration of 1 mg/ml and aliquoted. HFIP was evaporated by vacuum concentration (Concentrator 5301, Eppendorf, Germany) for 20 min and the aliquots were stored at -20°C until further usage.
Peptide Microarrays
Pepspot membranes. In a first generation peptide array, every position of the 12 amino
peptides (JPT, Berlin, Germany) was blocked using TBS pH 7.4 with 10% v/v blocking solution (Roche, Basel, Switzerland) for 2.5 h at room temperature. After 5 min washing with TBS and 0.1% v/v Tween 20 (TBS-T), the membrane was incubated with 5μM Aβ(1–42) in 10 mM sodium phosphate buffer pH 7.4 for 1 h. The potential of all 240 derivatives to bind monomeric Aβwas measured by applying 6E10 (BioLegend, San Diego, USA, diluted 1:10.000 in TBS pH 7.4) and a horseradish peroxidase (HRP)-conjugated goat anti-mouse antibody (Fisher Scien-tific, Schwerte, Germany, diluted 1:10.000 in TBS pH 7.4). The membrane was washed with TBS-T pH 7.4 for 2 h. HRP activity was measured after incubation with HRP substrate (Pierce, Waltham, USA) by using a ChemiDoc 200 detection system (Bio-Rad Laboratories, Munich, Germany) and the ImageLab software (Bio-Rad Laboratories, Hercules, Munich, Germany).
Pepscan. For the second generation a peptide microarray was produced by Pepscan
(Lely-stad, Netherlands).
For the Pepscan chip, the peptides were covalently coupled on glass slides in triplicate (spots with diameter of 100μm). Slides were incubated with 5μM FITC-Aβ(1–42) in 10 mM sodium phosphate buffer pH 7.4 for 1 h at room temperature with gentle agitation. After incu-bation, the slides were washed three times with TBS-T for 10 min, three times with water for 10 min and subsequently dried using a stream of nitrogen gas.
Fluorescence intensity of FITC-Aβ(1–42) bound to the peptide spots was measured by a FLA800 fluorescence image system (Fujifilm Medical Systems USA Inc, Stamford, USA) with a slide carrier employing a 473 nm laser for excitation. Digital images were recorded at 5μm res-olution. Fluorescence was analyzed by the software AIDA Array Metrix (Raytest, Staubenhardt, Germany). Signals were integrated for each spot (diameter 80μm). The background signal was detected from local dot rings with diameter widths of 150μm and background ring widths of 30μm, and subtracted from the peptide spot signal.
Thioflavin T (ThT) Assay
20μM Aβ(1–42) was mixed with 20μM Thioflavin T (ThT) and 31μg/ml DB3 or DB3DB3 in 10 mM sodium phosphate buffer, pH 7.4. The assay was performed using a non-binding 96 well plate (Greiner Bio-One, Frickenhausen, Germany). ThT fluorescence was measured every 15 min atλex= 440 nm andλem= 490 nm in a temperature-controlled plate reader (Polarstar Optima, BMG, Offenburg, Germany) at 37°C with 1 min agitation before every measurement. Each value was background corrected using the ThT fluorescence of a peptide solution without Aβ(1–42).
Biolayer interferometry (BLI)
BLI experiments were performed using an Octet RED96 instrument (fortéBIO, PALL Life Sci-ence, Menlo Park, USA). N-terminally biotinylated Aβ(1–42) was dissolved in HFIP, lyophi-lized and dissolved in 2 mM aqueous sodium hydroxide (1 mg/ml) in order to destroy any pre-existing aggregates. The Aβ(1–42) solution was neutralized by dilution in running buffer (20 mM sodium phosphate buffer, pH 7.4) to a final concentration of 20μg/ml and directly immo-bilized on Super Streptavidin biosensors (SSA) (fortéBIO, PALL Life Science, Menlo Park, USA) to a final depth of 3 nm. Ligand biosensors and reference biosensors were quenched with 20μg/ml biotin for 7 min.
For KDdeterminations, the binding of a dilution series of DB3 (200, 100, 50, 25, 12.5, 6.25,
QIAD assay
The quantitative determination of interference with Aβ(1–42) aggregate size distribution (QIAD) was performed as described before [14]. In brief, 80μM Aβ(1–42) was incubated in 10 mM sodium phosphate buffer, pH 7.4 for 4.5 h at 22°C with 600 rpm agitation. Aβ(1–42) aggregation was continued for an additional 40 min with or without DB peptide. The obtained partial size distribution was analyzed by applying density gradient centrifugation. 100μl of the incubated sample was placed on top of a gradient with 5 to 50% iodixanol (Optiprep, Axis-shield, Oslo, Norway) and separated at 259.000 x g for 3 h at 4°C using an ultracentrifuge (Optima MAX-XP, Beckman Coulter, Brea, USA). Fourteen fractions of 140μl were taken from top to bottom. The pellet was dissolved by adding 60μl of 6 M guanidine hydrochloride to the centrifugation tube. After boiling for 5 min, the dissolved pellet sample was collected. The samples were stored at -80°C until further use.
For quantification of the Aβ(1–42) amount in each fraction, reversed-phase high perfor-mance liquid chromatography (RP-HPLC) was performed using a Zorbax SB-300 C8 column (Agilent, Böblingen, Germany) connected to an Agilent 1260 Infinity system using 30% (v/v) acetonitrile with 0.1% (v/v) trifluoroacetic acid (TFA) as the mobile phase with a flow of 1 ml/ min and a column temperature of 80°C. The applied sample volume was 20μl. The UV absorp-tion at 214 nm was measured. For quantificaabsorp-tion of the Aβ(1–42) amount, the area under the peak representing Aβ(1–42) was calculated and the molar concentration was determined using a calibration curve.
For additional control and visualization of the Aβcontent in each fraction, a 16% tricine-SDS-PAGE was performed and Aβ(1–42) was visualized by silver staining according to Schag-ger [19].
MTT cell viability assay
Rat pheochromocytoma PC12 cells (Leibniz Institute DSMZ, Braunschweig, Germany) were cultivated in DMEM medium supplemented with 10% fetal bovine serum and 5% horse serum. 10,000 cells per well were seeded on collagen-coated 96 well plates (Gibco, Life technology, Carlsberg, USA) and incubated in a 95% humidified atmosphere with 5% CO2at 37°C for 24 h.
To yield oligomeric Aβ, monomerized Aβ(1–42) was preincubated for 4.5 h in sodium phos-phate buffer at 21°C and 600 rpm agitation. DB peptide was then added at different concentra-tions and incubated for further 40 min at 21°C and 600 rpm agitation before addition to the PC12 cells. Final concentrations were 1μM Aβ(1–42) and 0, 2, 1, or 5μM DB3 or half of the molar peptide concentrations of DB3DB3. The PC12 cells were further incubated for 24 h in 95% humidified atmosphere with 5% CO2at 37°C after adding the Aβ-peptide mixture. Cell
viability was then measured using the Cell proliferation Kit I (MTT) (Roche, Basel, Switzer-land) according to the manufacturer’s instruction. The absorbance of the formazan product was determined by measuring at 570 nm after subtracting the absorption at 660 nm. For absorption measurements, a Polarstar Optima plate reader (BMG, Offenburg, Germany) was used. All results were normalized to cells that were treated with buffer only.
A
β
Aggregation inhibition ELISA
blocked for 2 h at room temperature with 5% casein buffer. After washing, Aβaggregate solu-tions were added to the plate and incubated for 1 h at room temperature. The plate was washed again and bound Aβaggregates were detected by biotinylated 6E10/HRP-avidin mediated immunoreaction (BioLegend, San Diego, CA USA) using TMB as detection reagent. Each value was background corrected which were derived from ELISA of samples without capture antibody and normalized to the control without peptide (0% no inhibition, 100% full inhibi-tion). Mean value and standard error were calculated from three independent experiments. EC50was calculated by fitting the data to a logistic dose response function.
A
β
Aggregate disassembly ELISA
Freshly dissolved monomeric Aβ(1–42) (400 nM in 500 mM Tris-buffer pH 7.4) was incubated in a humidity chamber for 22 h at 37°C in order to preform Aβ(1–42) aggregates. These pre-formed aggregates were coincubated withD-peptide in different concentrations (0.01, 0.05, 0.1,
0.5, 1, 5, 10, 50, 100μM for DB3 or with half of the molar concentrations in case of DB3DB3) for additional 22 h at 37°C. The content of Aβaggregates was measured and evaluated in the same way as the aggregation inhibition ELISA.
Transmission electron microscopy (TEM)
10μM of freshly dissolved monomeric Aβ(1–42) was incubated in 10 mM sodium phosphate buffer pH 7.4 with or without DB peptide in equal molar ratios for 24 h at 37°C. Afterwards, 20μl of the samples were absorbed on formval/carbon coated copper grids (S162, Plano, Wet-zlar, Germany) for 3 min, washed three times with water and negative stained with 1% v/v ura-nylacetate for 1 min. The images were acquired using a Libra 120 electron microscope (Zeiss, Oberkochen, Germany) at 120 kV.
Statistical analysis
Statistical analysis was performed using the Origin 8.5 (OriginLab Cooperation, Northampton, USA) software package.
Results
Screening for optimized D3 derivatives using peptide microarrays
We identified previously the Aβoligomer eliminatingD-enantiomeric peptide D3 via mirror
image phage display [10,16]. A possible explanation of the efficiency of D3 is that it binds to and stabilizes Aβmonomers within the various equilibria with Aβoligomers and other Aβ
antibody (Fig 2A). The amino acid substitutions that yielded the highest Aβbinding activity, as measured by the dot staining density, were chosen for further combinations in the second round (Fig 2B and 2C). In particular, the substitutions R3I, R5T, H9D, R10Q, R10E, N11Q and N11D were found to bind more favorably to Aβmonomers. The residue H7 showed the highest potential for further improvement, because most substitutions at this position yielded higher affinity towards Aβmonomers. H7P, H7Q, H7R and H7S were selected as the most promising substitutions for H7. Substitution of R12 was excluded from the analysis because a minimum number of arginines has been recognized to be responsible for the superior pharmacokinetic properties of D3 [20]. Interestingly, nine of the eleven substitutions were located in the C-ter-minal half of D3 at positions 7, 9, 10 and 11.
For the second round of optimization, every possible combination of the eleven single resi-due replacements R3I, R5T, H7P, H7Q, H7R, H7S, H9D, R10Q, H10E, N11Q and N11D, were combined to yield 360 different peptides, which were spotted on a glass chip (Pepscan, Lely-stad, Netherlands) (Fig 2C). To compare their binding activities to monomeric Aβ, the peptide microarrays were incubated with freshly dissolved monomeric FITC-Aβ(1–42) and fluores-cence intensities of the Aβ-peptide interactions were measured. Five peptides that showed tight binding to Aβmonomers as deduced from high FITC fluorescence intensities were chosen for furtherin vitrocharacterization (Fig 2DandTable 1). The fluorescence intensities of these D3 derivatives, termed DB1 to DB5, were up to six times higher when compared with the fluores-cence intensity obtained with D3 (Fig 2D). As shown inTable 1, the sequences of DB1 to DB5 had two to four amino acid substitutions to the original D3 template.
The influence of DB3 and DB3DB3 on A
β
fibril formation
To investigate the influence of DB1 to DB5 on Aβfibril formation, a Thioflavin T (ThT) assay was performed. In an aqueous environment the benzothiazole dye has a low fluorescence. Upon interaction with regularly formed amyloid fibrils the fluorescence signal is significantly enhanced and excitation and emission maxima shift from 385 and 445 nm to 450 and 490 nm, respectively. The emission at 490 nm is directly proportional to the quantity of amyloid fibrils. Fibril forma-tion of Aβcan be followed in real time by measuring the ThT fluorescence [21–23].
Therefore, the inhibitory effects of theD-peptides DB1 to DB5 and D3 were investigated by
co-incubating these peptides with Aβ(1–42) and performing the ThT assay. Fluorescence emis-sion data were compared after 5 h incubation, because after this period the Aβ(1–42) control (without added peptide) reached its fluorescence maximum. As shown inFig 3, D3 inhibited
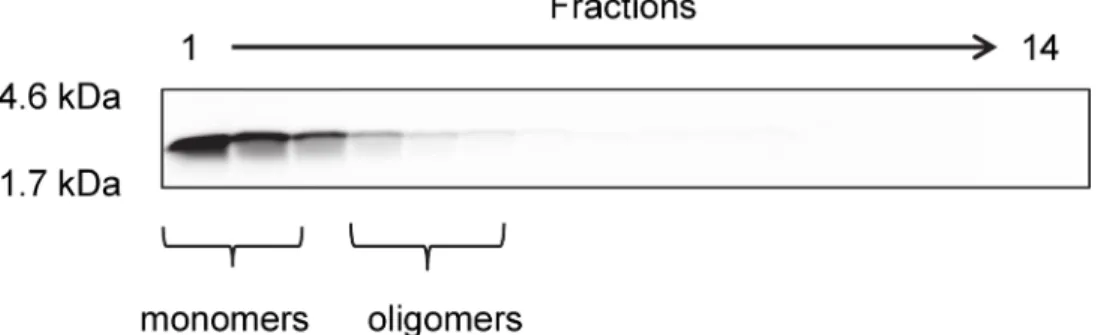
Fig 1. Aggregation state of monomeric Aβ(1–42) after 1 h incubation.For optimization of D3 with peptide
microarrays, the peptide microarrays were incubated with 5μM initially monomeric Aβ(1–42) for 1 h at room temperature. The aggregation state of this Aβpreparation was analyzed by density gradient centrifugation followed by 16% Tricine-SDS-PAGE. FITC-Aβ(1–42) was detected via FITC fluorescence and was only detectable in the first four lanes, which represent mainly monomeric and oligomeric FITC-Aβ[14].
Aβ(1–42) fibril formation by 30%, whereas DB3 inhibited the Aβ(1–42) fibril formation by 80%, DB5 by 76%, DB1 by 63% and DB2 by 49% when compared to the control (Fig 3). Sur-prisingly, DB4 had no effect on the fibril formation of Aβ.
The results of the ThT assay indicate that DB3 is the most promising peptide according to the inhibitory effect of fibril formation. Therefore, we selected DB3 for further in vitro studies. As a further potential optimization step of the DB peptides, we wanted to investigate the impact of avidity. Although the DB peptides were selected for monomer binding, elimination
Fig 2. Selection of DB1 to DB5 based on two cycles of peptide microarray based screenings.A) Promising replacements in the sequence of D3 were selected via PepSpots peptide array. Binding of monomeric Aβ(1–42) to spotted D3 derivatives was detected using the Aβantibody 6E10 and a HRP-labeled secondary antibody. Several of the dots with the highest staining density, representing the most promising single replacements, are marked in red. The original D3 controls are indicated in blue. B) The HRP-intensity was evaluated by the staining density of the peptide dots and plotted against the amino acid substitutions. Eleven promising substitutions that showed>1.5 times increase in binding to monomeric Aβ(1–42) when compared with that of D3, were chosen for a second generation peptide microarray. The red line represents the mean dot staining intensity of D3. C) Schematic overview of the first generation microarray output. D) Binding of FITC-Aβ(1–42) to the peptides DB1 to DB5. The binding of FITC-Aβ(1–42) to the spotted peptides was analyzed by measuring the FITC-fluorescence intensity. All intensities were background corrected. The signal intensities of the top five peptides were plotted. The red line represents the mean fluorescence intensity of D3.
of toxic oligomer species might require contacting monomer units within these oligomers. In order to make use of the multivalence of oligomers, multivalent DB3 could possibly have increased efficiency in oligomer elimination. As the simplest multivalent DB3 peptide, we designed a head-to-tail tandem peptide of DB3, named DB3DB3. In contrast to other divalent DB3 molecules, e.g. head-to-head or tail-to-tail orientations, the head-to-tail tandem of DB3 contains only peptide bonds between the amino acid residues and is thus easily accessible by standard peptide synthesis. As shown inFig 3, 10μM DB3DB3 inhibited the formation of ThT-positive aggregates as efficiently as 20μM DB3.
Binding affinities of DB3 and DB3DB3 to A
β
(1
–
42) monomers
For further characterization of DB3 and DB3DB3, the equilibrium dissociation constants (KD) of theD-peptides were determined for their interaction with Aβ(1–42) monomers using bio-layer interferometry (BLI) (Fig 4). For DB3, aKDvalue of 75μM was determined, whereas for the designed dimer peptide DB3DB3 aKDvalue of 1μM was obtained. Therefore, the binding affinity to Aβ(1–42) monomers was enhanced by 75-fold for the dimeric version of DB3.
A
β
aggregation inhibition by DB3 and DB3DB3
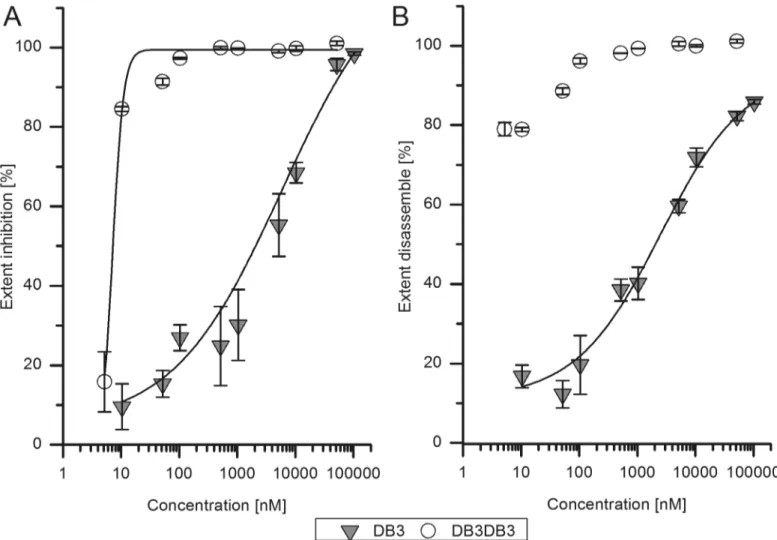
To confirm and further investigate the efficiency of DB3 and DB3DB3 activity on Aβ aggrega-tion, an aggregation inhibition ELISA was performed. Initially monomeric Aβ(1–42) was incu-bated with different concentrations of DB3 or DB3DB3 and the Aβ(1–42) aggregates were specifically detected via ELISA. DB3 inhibits Aβaggregate formation with an EC50of 6μM, whereas DB3DB3 inhibits Aβaggregate formation with an EC50of 8 nM (Fig 5A). Thus,
DB3DB3 is 1000-fold more efficient in inhibiting Aβaggregation when compared with that of DB3. Furthermore, the aggregation inhibition ELISA showed that the fibrillization of Aβ(1–42) was almost inhibited completely at a peptide concentration of 20μM DB3 and 10μM DB3DB3.
A
β
aggregates disassembly ability of DB3 and DB3DB3
The Aβaggregate disassembly ELISA was used to analyze the effect of DB3 and DB3DB3 on preformed Aβaggregates (Fig 5B). Preformed Aβ(1–42) aggregates were co-incubated with dif-ferent concentrations of DB3 or DB3DB3 for 24 h. The Aβaggregates specific ELISA was used to quantify Aβaggregates. The raw data were normalized to Aβaggregates without peptide. The results of measured Aβaggregates normalized to the Aβcontrol were plotted against the peptide concentration. The EC50was calculated by a logarithmic dose response function.
The EC50value using D3 to dissemble the Aβaggregates was 2.5μM; however, the value for DB3DB3 could not be determined because the Aβaggregates were already disassembled at very
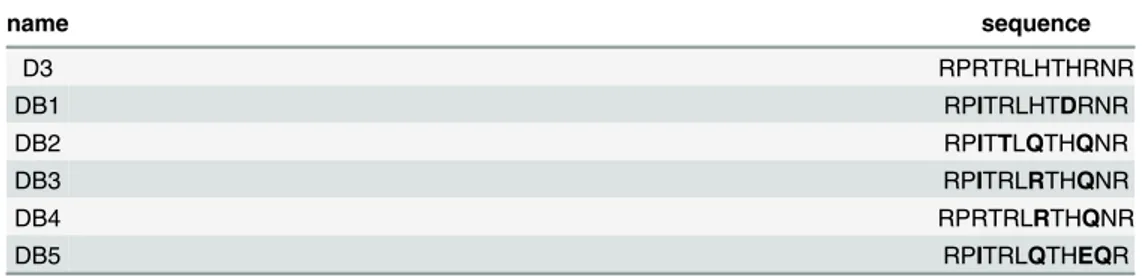
Table 1. Amino acid sequences of D3 and DB1 to DB5.
name sequence
D3 RPRTRLHTHRNR
DB1 RPITRLHTDRNR
DB2 RPITTLQTHQNR
DB3 RPITRLRTHQNR
DB4 RPRTRLRTHQNR
DB5 RPITRLQTHEQR
All amino acids of the peptides areD-enantiomeric and their C-termini are amidated. The amino acid
substitutions made to the D3 template are indicated in bold.
low peptide concentrations, i.e., addition of 10 nM DB3DB3 to 400 nM Aβgave 80% disassem-bly of the Aβaggregates when compared to Aβin the absence of peptide.
Elimination of A
β
oligomers
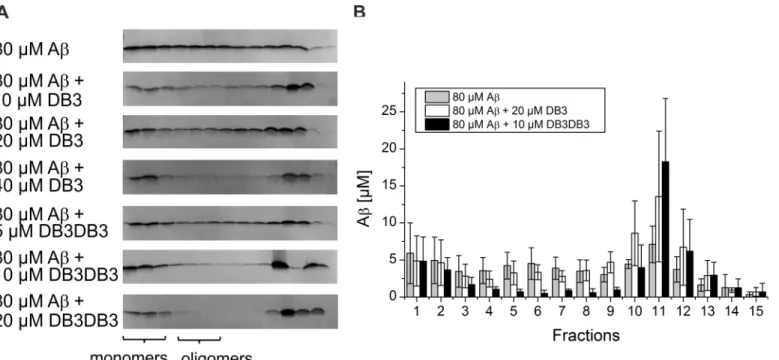
Aβoligomers are the main toxic species and are discussed to be responsible for development and progression of AD [7]. A promising therapeutic approach is the elimination of Aβ oligo-mers. We have previously established an assay that determines quantitatively the Aβoligomer elimination efficiency of a given substance (QIAD assay) [14]. By applying this assay the Aβ(1–
42) oligomer elimination efficacy of DB3 and DB3DB3 (Fig 6) was determined. Incubation of 80μM monomeric Aβ(1–42) for 4.5 h led to the formation of a mixture of Aβmonomers
Fig 3. Thioflavin T fibril formation assay.20μM Aβ(1–42) was mixed with 20μM DB1 to DB5 or 10μM DB3DB3 and the ThT fluorescence was monitored. Aβ(1–42) without peptide addition was taken as the control. The ThT fluorescence of all samples were compared after 5 h, where the control, Aβ(1–42) only, reached its maximum in fluorescence emission. The Mann-Whitney-U-test was used for statistical analysis.* p<0.05;**p<0.01;***p<0.001.
(fractions 1–2), oligomers (fractions 4–6) and larger aggregates (other fractions) (Fig 6A). Addition of DB3 at different concentrations resulted in the elimination of Aβoligomers in a concentration-dependent manner. Addition of 40μM DB3 to Aβoligomers yielded near com-plete elimination of the oligomers. In comparison, addition of 20μM DB3DB3 to 80μM Aβ eliminated the oligomer species completely. Moreover, the content of Aβoligomers was also strongly reduced when applying 10μM DB3DB3.
RP-HPLC was used to quantify the Aβoligomer elimination efficiency (Fig 6B). 20μM DB3 reduced the amount of Aβoligomers by ~27% compared with that of the Aβonly control. 10μM DB3DB3 reduced the content of Aβoligomers by 82%, which is a significant improve-ment over the DB3 result. The content of large co-precipitates increased and represented the content of Aβoligomers that were eliminated. The content of monomeric Aβwas not affected by DB3 and DB3DB3. Thus, DB3 and DB3DB3 eliminated Aβoligomers without affecting the monomers and shifted the equilibrium from oligomeric Aβto larger Aβaggregates.
Reduction of A
β
toxicity
The MTT assay with rat PC12 cells was performed to analyze the influence of DB3 and DB3DB3 to Aβ-induced cytotoxicity (Fig 7). Monomeric Aβ(1–42) was pre-incubated for 4.5 h
Fig 4. KDdetermination of DB3 and DB3DB3 to monomeric Aβusing biolayer interferometry (BLI).N-terminally biotinylated Aβ(1–42) monomers were
to yield Aβoligomers. After additional co-incubation with DB3 or DB3DB3 for 40 min, the mixture was added to PC12 cells and cell viability was analyzed after 24 h using the MTT assay.
In the absence of peptides a solution of 1μM Aβreduced the PC12 cell viability to 44% (Fig 7). In contrast, neither DB3 (5μM) nor DB3DB3 (5μM) exhibited any effect on PC12 cell via-bility, which indicates that both peptides are not toxic at the applied concentration. Addition of DB3 to 1μM pre-incubated Aβover the concentration range of 0.2 to 5μM did not signifi-cantly increase cell viability. However, a significant concentration-dependent increase of cell viability was observed in the presence of 0.1 to 2.5μM DB3DB3 in a concentration dependent manner up to 80% (Fig 7). Thus, DB3DB3 was able to inhibit Aβ-induced cytotoxicity.
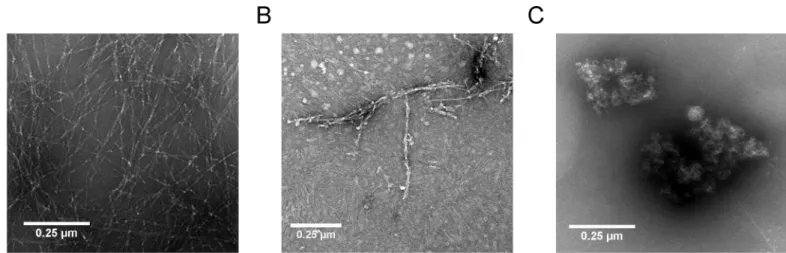
Morphology of co-incubated A
β
To analyze the morphology of Aβco-complexes with DB3 and DB3DB3, initially monomeric Aβ(1–42) was incubated with DB3 and DB3DB3 for 24 h and TEM analysis performed. For
TEM analysis, the samples were absorbed onto formval/copper grids and negatively stained using uranyl acetate.
Aβformed large meshes of fibrils after 24 h incubation (Fig 8A). Co-incubation of Aβwith DB3 in an equal molar ratio resulted in the formation of substantially fewer and shorter fibrils (Fig 8B), which is in perfect accordance with the observation from the ThT assay that DB3 was able to reduce fibril formation by 80%. Co-incubation of Aβwith DB3DB3 yielded huge amor-phous co-precipitates, which did not contain any fibrillar structures (Fig 8C). Obviously, at least under these artificially high concentrations, DB3DB3 did not yield mostly Aβmonomers, but high-molecular-weight non-fibrillar co-precipitates with Aβ(Fig 8C), as also observed in the QIAD assay (Fig 6).
Discussion
Currently, there is no causal therapy for Alzheimer’s disease (AD).In vitroandin vivostudies showed that Aβoligomers play an important role in the progression of AD [7]. Therefore, elimination of these toxic Aβoligomers is a promising strategy to retard AD. Using peptide microarrays, we have optimized the amino acid sequence of the well-characterizedD
-enantio-meric Aβoligomer-eliminating peptide D3. The most promising D3 derivatives, DB1–DB5, exhibit two to four different amino acids compared with D3. Besides DB4, the DB peptides have a lower net charge than D3, due to the substitution of R3, R5 and R10, and the introduc-tion of negatively charged amino acids. The substituintroduc-tion of R10Q within DB4 was charge com-pensated through the substitution H7R. Additional substitutions that had no effect to the net charge were H7Q and N11Q. Combination of single amino acid residue replacements within D3 that each showed slightly enhanced binding capabilities to monomeric FITC-Aβ(Fig 2B) ultimately yielded D3 derivatives that are characterized by significantly enhanced binding capabilities to monomeric FITC-Aβ(Fig 2D). Increased binding capabilities to monomeric
Fig 6. Effect of DB3 and DB3DB3 on different Aβaggregation species.A) Analysis of Aβ(1–42) aggregation species with density gradient centrifugation and followed by analysis using silver-stained Tricine-SDS-PAGE to analyze the influence of DB3 and DB3DB3 on the distribution of Aβassemblies. B) Quantification of Aβ(1–42) by RP-HPLC. All data were recorded in triplicate.
FITC-Aβwere solely deduced from fluorescence intensities. Although we cannot prove that this assumption holds true for each peptide spot, it allowed us to pre-select the five most prom-ising D3 derivatives that subsequently were compared to each other.
The inhibition efficacy of Aβaggregation by DB1 to DB5 was investigated. DB3 was found to be the most promising D3 derivative that inhibited the Aβaggregation by up to 80%. In con-trast, D3 inhibited Aβaggregation by only 30%. Considering the results of the ThT assay, DB3 was chosen for furtherin vitrocharacterization. BLI analysis revealed that DB3 interacts with Aβmonomers with a binding affinity of 75μM, and an ELISA showed that DB3 inhibits the formation of Aβaggregates with an EC50of 6μM.
TheD-enantiomeric peptides D3 and DB1–DB5 were developed for elimination of Aβ
oligo-mers. This was tested by the QIAD assay [14]. The addition of DB3 to Aβreduced Aβ oligo-mers by 28%. Aβmonomers, which are assumed to have neuroprotective functions [24], were
Fig 7. Influence of DB3 and DB3DB3 on Aβ-introduced cytotoxicity.The cell viability assay was performed using PC12 cells in a MTT test. Therefore, Aβ
(1–42) was preincubated for 4.5 h and further coincubated with DB3 or DB3DB3 for 40 min. The cells were incubated for 24 h with the Aβ(1–42)-peptide mixture or Aβ(1–42) alone as a control. The absorption of buffer treated cells was set to 100% cell viability. The cell viability of cells treated with Aβand DB3 or DB3DB3 were compared with cells treated with Aβonly. The Mann-Whitney-U-test was used for statistical analysis.*p<0.05;**p<0.01;***p<0.001.
not affected. The reduction of oligomeric Aβresulted in an increase of large amorphous Aβ co-precipitates. TEM images showed that these aggregates possess a higher density. Typical Aβ
fibrils, which are linear, unbranched and 5 to 10 nm wide [25], were not visible. Additionally, DB3 was able to disassemble preformed Aβaggregates.
Since Aβoligomers are a multivalent target, the divalent tandem peptide DB3DB3 was expected to be significantly more effective. DB3DB3 showed a 75-fold higher affinity for Aβ
monomers. This increase in affinity resulted in an increase in the inhibition of Aβfibrilation and an increased reduction in Aβ-induced cytotoxicity. Additionally, in the Aβaggregation inhibition ELISA, DB3DB3 yielded an EC50that was 1000-fold lower when compared with that
of DB3. DB3DB3 was also able to efficiently eliminate Aβoligomers as shown in the QIAD assay. Interestingly, DB3 and DB3DB3 did not significantly affect the Aβmonomer content. TEM images showed that these aggregates were not fibrillary structured.
In summary, ourin vitrodata show that the D3 derivative DB3 and its tandem version DB3DB3 were highly efficient at reducing Aβoligomer content in samples. In particular, the tandem peptide DB3DB3 yielded a significant optimization step when compared with the orig-inal peptide DB3.In vivostudies will show whether the new compounds’in vitroproperties can be translated into enhanced therapeutic activity in AD animal models.
Acknowledgments
D. W. was supported by grants from the“Portfolio Technology and Medicine”, the“Portfolio Drug Research”and the Helmholtz-Validierungsfonds of the Impuls- und Vernetzungs-Fonds der Helmholtzgemeinschaft. D.W. was also supported by the TT-Fonds of the Technology Transfer Department of the Forschungszentrum Jülich.
Author Contributions
Conceived and designed the experiments: ANK TZ DB SAF OB LG JK DW. Performed the experiments: ANK TZ MT JB DB AB TW. Analyzed the data: ANK TZ MT DB AB TW. Con-tributed reagents/materials/analysis tools: JB DW EW. Wrote the paper: ANK TZ MT JB SAF JK AB EW DW.
Fig 8. TEM of Aβ-DB3 and -DB3DB3 co-complexes.10μM initial monomeric Aβ(1–42) without (A) and with 10μM DB3 (B) or 5μM DB3DB3 (C) were coincubated for 24 h. Subsequently, the samples were absorbed onto formval/carbon coated copper grids and negative stained with 1% uranyl acetate. The images were obtained using a transmission electron microscope (TEM). Scale bar: 0.25μm.
References
1. Ferri CP, Prince M, Brayne C, Brodaty H, Fratiglioni L, Ganguli M, et al. Global prevalence of dementia: a Delphi consensus study. Lancet. 2005; 366(9503):2112–7. PMID:16360788
2. Sperling RA, Jack CR, Aisen PS. Testing the Right Target and Right Drug at the Right Stage. Science Translational Medicine. 2011; 3(111):111cm33.
3. Hardy J, Selkoe DJ. The Amyloid Hypothesis of Alzheimer's Disease: Progress and Problems on the Road to Therapeutics. Science. 2002; 297(5580):353–6. PMID:12130773
4. Selkoe DJ. Alzheimer's Disease: Genes, Proteins, and Therapy. 2001; 81(2):741–66.
5. Finder VH, Glockshuber R. Amyloid-βAggregation. Neurodegenerative Diseases. 2007; 4(1):13–27. PMID:17429215
6. McLean CA, Cherny RA, Fraser FW, Fuller SJ, Smith MJ, Konrad V, et al. Soluble pool of Aβamyloid as a determinant of severity of neurodegeneration in Alzheimer's disease. Annals of Neurology. 1999; 46(6):860–6. PMID:10589538
7. Shankar GM, Li S, Mehta TH, Garcia-Munoz A, Shepardson NE, Smith I, et al. Amyloid-βprotein dimers isolated directly from Alzheimer's brains impair synaptic plasticity and memory. Nature medicine. 2008; 14(8):837–42. doi:10.1038/nm1782PMID:18568035
8. Schumacher TN, Mayr LM, Minor DL Jr, Milhollen MA, Burgess MW, Kim PS. Identification of D-peptide ligands through mirror-image phage display. Science. 1996; 271(5257):1854–7. PMID:8596952
9. Wiesehan K, Buder K, Linke RP, Patt S, Stoldt M, Unger E, et al. Selection of D-Amino-Acid Peptides That Bind to Alzheimer's Disease Amyloid Peptide Aβ1–42 by Mirror Image Phage Display. ChemBio-Chem. 2003; 4(8):748–53. PMID:12898626
10. Funke SA, van Groen T, Kadish I, Bartnik D, Nagel-Steger L, Brener O, et al. Oral Treatment with the d-Enantiomeric Peptide D3 Improves the Pathology and Behavior of Alzheimer’s Disease Transgenic Mice. ACS Chemical Neuroscience. 2010; 1(9):639–48. doi:10.1021/cn100057jPMID:22778851
11. Bartnik D, Funke SA, Andrei-Selmer L-C, Bacher M, Dodel R, Willbold D. Differently Selected d-Enan-tiomeric Peptides Act on Different AβSpecies. Rejuvenation Research. 2009; 13(2–3):202–5.
12. van Groen T, Kadish I, Wiesehan K, Funke SA, Willbold D. In vitro and in vivo Staining Characteristics of Small, Fluorescent, Aβ42-Binding D-Enantiomeric Peptides in Transgenic AD Mouse Models. Chem-MedChem. 2009; 4(2):276–82. doi:10.1002/cmdc.200800289PMID:19072935
13. Wiesehan K, Stöhr J, Nagel-Steger L, van Groen T, Riesner D, Willbold D. Inhibition of cytotoxicity and amyloid fibril formation by a d-amino acid peptide that specifically binds to Alzheimer’s disease amyloid peptide. Protein Engineering Design and Selection. 2008; 21(4):241–6.
14. Brener O, Dunkelmann T, Gremer L, van Groen T, Mirecka EA, Kadish I, et al. QIAD assay for quantitat-ing a compound’s efficacy in elimination of toxic Aβoligomers. Scientific Reports. 2015; 5:13222. doi: 10.1038/srep13222PMID:26394756
15. van Groen T, Kadish I, Funke SA, Bartnik D, Willbold D. Treatment with D3 Removes Amyloid Deposits, Reduces Inflammation, and Improves Cognition in Aged AβPP/PS1 Double Transgenic Mice. Journal of Alzheimer's Disease. 2013; 34(3):609–20. doi:10.3233/JAD-121792PMID:23271316
16. van Groen T, Wiesehan K, Funke SA, Kadish I, Nagel-Steger L, Willbold D. Reduction of Alzheimer’s Disease Amyloid Plaque Load in Transgenic Mice by D3, a D-Enantiomeric Peptide Identified by Mirror Image Phage Display. ChemMedChem. 2008; 3(12):1848–52. doi:10.1002/cmdc.200800273PMID: 19016284
17. Uttamchandani M, Yao SQ. Peptide Microarrays: Next Generation Biochips for Detection, Diagnostics and High-Throughput Screening. Current Pharmaceutical Design. 2008; 14(24):2428–38. PMID: 18781992
18. Foong YM, Fu J, Yao SQ, Uttamchandani M. Current advances in peptide and small molecule microar-ray technologies. Current Opinion in Chemical Biology. 2012; 16(1–2):234–42. doi:10.1016/j.cbpa. 2011.12.007PMID:22221853
19. Schagger H. Tricine-SDS-PAGE. Nat Protocols. 2006; 1(1):16–22. PMID:17406207
20. Jiang N, Leithold LHE, Post J, Ziehm T, Mauler J, Gremer L, et al. Preclinical Pharmacokinetic Studies of the Tritium Labelled D-Enantiomeric Peptide D3 Developed for the Treatment of Alzheimer´s Dis-ease. PloS one. 2015; 10(6):e0128553. doi:10.1371/journal.pone.0128553PMID:26046986
21. LeVine H. Thioflavine T interaction with amyloidβ-sheet structures. Amyloid. 1995; 2(1):1–6.
22. Levine H. Thioflavine T interaction with synthetic Alzheimer's diseaseβ-amyloid peptides: Detection of amyloid aggregation in solution. Protein Science. 1993; 2(3):404–10. PMID:8453378
24. Giuffrida ML, Caraci F, Pignataro B, Cataldo S, De Bona P, Bruno V, et al.β-Amyloid Monomers Are Neuroprotective. The Journal of Neuroscience. 2009; 29(34):10582–7. doi:10.1523/JNEUROSCI. 1736-09.2009PMID:19710311