Dissection of a Complex Disease
Susceptibility Region Using a Bayesian
Stochastic Search Approach to Fine Mapping
Chris Wallace1,2*, Antony J Cutler1, Nikolas Pontikos1, Marcin L Pekalski1, Oliver
S Burren1, Jason D Cooper1¤, Arcadio Rubio García1, Ricardo C Ferreira1, Hui Guo1,3, Neil
M Walker1, Deborah J Smyth1, Stephen S Rich4,5, Suna Onengut-Gumuscu4,6, Stephen J Sawcer7, Maria Ban7, Sylvia Richardson2☯, John A Todd1☯, Linda S Wicker1☯
1JDRF/Wellcome Trust Diabetes and Inflammation Laboratory, Department of Medical Genetics, NIHR Biomedical Research Centre, Cambridge Institute for Medical Research, University of Cambridge, Cambridge, United Kingdom,2MRC Biostatistics Unit, Cambridge Institute of Public Health, Cambridge, United Kingdom,3Centre for Biostatistics Institute of Population Health, The University of Manchester Manchester, United Kingdom,4Center for Public Health Genomics, University of Virginia, Charlottesville, Virginia, United States of America,5Department of Medicine, Division of Endocrinology, University of Virginia, Charlottesville, Virginia, United States of America,6Department of Public Health Sciences, Division of Biostatistics and Epidemiology, University of Virginia, Charlottesville, Virginia, United States of America, 7University of Cambridge, Department of Clinical Neurosciences, Cambridge, United Kingdom
☯These authors contributed equally to this work.
¤ Current address: Department of Chemical Engineering and Biotechnology, University of Cambridge, Cambridge, United Kingdom
Abstract
Identification of candidate causal variants in regions associated with risk of common dis-eases is complicated by linkage disequilibrium (LD) and multiple association signals. None-theless, accurate maps of these variants are needed, both to fully exploit detailed cell specific chromatin annotation data to highlight disease causal mechanisms and cells, and for design of the functional studies that will ultimately be required to confirm causal mecha-nisms. We adapted a Bayesian evolutionary stochastic search algorithm to the fine mapping problem, and demonstrated its improved performance over conventional stepwise and reg-ularised regression through simulation studies. We then applied it to fine map the estab-lished multiple sclerosis (MS) and type 1 diabetes (T1D) associations in the IL-2RA (CD25) gene region. For T1D, both stepwise and stochastic search approaches identified four T1D association signals, with the major effect tagged by the single nucleotide polymorphism, rs12722496. In contrast, for MS, the stochastic search found two distinct competing models: a single candidate causal variant, tagged by rs2104286 and reported previously using step-wise analysis; and a more complex model with two association signals, one of which was tagged by the major T1Dassociated rs12722496 and the other by rs56382813. There is low to moderate LD between rs2104286 and both rs12722496 and rs56382813 (r2
⋍0:3) and
our two SNP model could not be recovered through a forward stepwise search after condi-tioning on rs2104286. Both signals in the two variant model for MS affect CD25 expression on distinct subpopulations of CD4+T cells, which are key cells in the autoimmune process.
a11111
OPEN ACCESS
Citation:Wallace C, Cutler AJ, Pontikos N, Pekalski ML, Burren OS, Cooper JD, et al. (2015) Dissection of a Complex Disease Susceptibility Region Using a Bayesian Stochastic Search Approach to Fine Mapping. PLoS Genet 11(6): e1005272. doi:10.1371/ journal.pgen.1005272
Editor:Jonathan Marchini, University of Oxford, UNITED KINGDOM
Received:October 2, 2014
Accepted:May 12, 2015
Published:June 24, 2015
Copyright:© 2015 Wallace et al. This is an open access article distributed under the terms of the Creative Commons Attribution License, which permits unrestricted use, distribution, and reproduction in any medium, provided the original author and source are credited.
Data Availability Statement:Raw RNAseq data is not available to protect anonymity of donors. Read counts at each position in the study region after alignment are available for each sample in the Supplementary Information. MS genetic data are previously published (http://dx.doi.org/10.1038/ng. 2770) and available upon application to the IMSGC. T1D genetic data are available from dbGAP:http:// www.ncbi.nlm.nih.gov/projects/gap/cgi-bin/study.cgi? study_id=phs000180.v2.p2
(9-The results support a shared causal variant for T1D and MS. Our study illustrates the benefit of using a purposely designed model search strategy for fine mapping and the advantage of combining disease and protein expression data.
Author Summary
Genetic association studies have identified many DNA sequence variants that associate with disease risk. By exploiting the known correlation that exists between neighbouring variants in the genome, inference can be extended beyond those individual variants tested to identify sets within which a causal variant is likely to reside. However, this correlation, particularly in the presence of multiple disease causing variants in relative proximity, makes disentangling the specific causal variants difficult. Statistical approaches to this fine mapping problem have traditionally taken a stepwise search approach, beginning with the most associated variant in a region, then iteratively attempting to find additional associat-ed variants. We adaptassociat-ed a stochastic search approach that avoids this stepwise process and is explicitly designed for dealing with highly correlated predictors to the fine mapping problem. We showed in simulated data that it outperforms its stepwise counterpart and other variable selection strategies such as the lasso. We applied our approach to under-stand the association of two immune-mediated diseases to a region on chromosome 10p15. We identified a model for multiple sclerosis containing two variants, neither of which was found through a stepwise search, and functionally linked both of these to the neighbouring candidate gene,IL2RA, in independent data. Our approach can be used to aid fine mapping of other disease-associated regions, which is critical for design of func-tional follow-up studies required to understand the mechanisms through which genetic variants influence disease.
Introduction
Genome-wide association studies have been very successful at identifying disease-associated variation by exploiting linkage disequilibrium (LD), meaning that only a subset of markers need be surveyed to detect association. However, this same LD, particularly when combined with the presence of multiple disease causal variants in relative proximity, makes disentangling the specific causal variants difficult. Mapping the likely causal variants in regions associated with complex traits as precisely as possible is becoming increasingly important for two reasons. Firstly, as detailed chromatin annotations become available, more precise maps of probable causal variants will allow researchers to fully exploit these resources through integrative analy-ses targeted at identifying the specific genes, molecules and cells underlying disease association [1]. Secondly, the functional studies which are ultimately required to confirm causal mecha-nisms are laborious and need to focus, from the outset, on the smallest yet most complete set of plausible causal variants.
It is widely recognised that the most associated single nucleotide polymorphism (SNP) in a region is not necessarily the causal variant [2], yet attempts at fine mapping disease signals typ-ically proceed by successive conditioning on the most associated SNPs, a form of stepwise re-gression that may produce incorrect results, particularly when causal variants are correlated, i.e. in linkage disequilibrium (LD) [3]. Bayesian methods have been used for fine mapping
2011-253), the Wellcome Trust [091157] and the National Institute for Health Research Cambridge Biomedical Centre. The research leading to these results has received funding from the European Union’s 7th Framework Programme (FP7/2007-2013) under grant agreement no.241447 (NAIMIT). The Cambridge Institute for Medical Research (CIMR) is in receipt of a Wellcome Trust Strategic Award [100140]. CW is supported by the Wellcome Trust [089989]. We acknowledge the National Institute for Health Research Cambridge Biomedical Research Centre for funding. We acknowledge use of DNA from The UK Blood Services collection of Common Controls (UKBS-CC collection), which is funded by the Wellcome Trust grant 076113/C/04/Z and by the USA National Institute for Health Research program grant to the National Health Service Blood and Transplant (RP-PG-0310-1002). We acknowledge the use of DNA from the British 1958 Birth Cohort collection, which is funded by the UK Medical Research Council grant G0000934 and the Wellcome Trust grant 068545/Z/02. This research utilized resources provided by the Type 1 Diabetes Genetics Consortium, a collaborative clinical study sponsored by the National Institute of Diabetes and Digestive and Kidney Diseases, the National Institute of Allergy and Infectious Diseases, the National Human Genome Research Institute, the National Institute of Child Health and Human Development and the JDRF and is supported by the USA National Institutes of Health grant U01-DK062418. Funders’websites: Wellcome Trusthttp://www.wellcome.ac.uk; Medical Research Councilhttp://www.mrc.ac.uk; JDRFhttps:// www.jdrf.org.uk/; European Union’s 7th Framework Programmehttp://cordis.europa.eu/fp7/health/home_ en.html; National Institutes of Healthhttp://www.nih. gov/; National Institute for Health Researchhttp:// www.nihr.ac.uk/. The funders had no role in study design, data collection and analysis, decision to publish, or preparation of the manuscript.
association signals in dense and imputed genotyping data and generating credible sets of vari-ants that are likely to contain the causal variant, analogous to credible intervals for odds ratios [4]. However, these approaches typically make the simplifying assumption that exactly one causal variant exists at any individual region [4] because accounting for multiple causal vari-ants leads to exponential increase in the number of models that need to be considered with the number of causal variants considered. Bayesian methods that summarise evidence across SNPs in a region to assess either enrichment of signals in chromatin states [5] or colocalisation be-tween association signals for different traits [6] make a similar single causal variant assump-tion. As stepwise approaches often obtain evidence for additional, independent association signals in a region [7–10], this assumption is unrealistic. One exception is BimBam [11] which can fit multi SNP models, but considers all possible models up to a specified maximum number of causal SNPs. As the number of potential models grows exponentially, BimBam is limited to regions with relatively few SNPs for computational reasons.
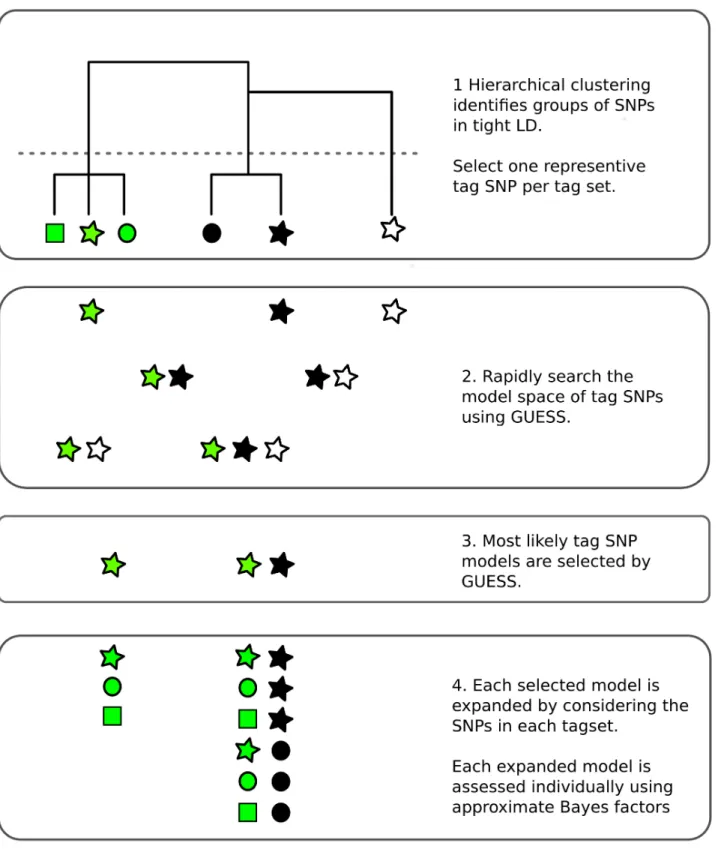
Monte Carlo methods can avoid limitations on the number of causal variants by sampling the model space rather than visiting all possible models. Here we adapt a Bayesian evolutionary stochastic search algorithm, GUESS [12,13], to the fine mapping problem. This method, and its fast computational implementation, is tailored to efficiently explore the multimodal space created by multiple SNP models. However, the very dense SNP map that is required for fine mapping leads to extreme LD, which presents two specific challenges for GUESS. The first is that SNPs in extremely tight LD can cause numerical instability in model fitting, so we use minimal tagging to explore the model space and then expand all the tag models initially select-ed by GUESS (Fig 1). Second, posterior support is diluted across SNPs in tight LD, potentially preventing direct inference on the importance of individual SNPs. We therefore use posterior model probabilities and patterns of LD to define sets of SNPs which have strong joint posterior support for the hypothesis that one member of the set is causal for the trait. These are analo-gous to the credible sets generated in the Bayesian fine mapping framework which assumes a single causal variant per region [4], but allow for multiple causal variants.
Our adaptions around GUESS are available in an R package, GUESSFM (https://github. com/chr1swallace/GUESSFM). We used GUESSFM to fine map the association of multiple sclerosis (MS) and type 1 diabetes (T1D) to an established susceptibility region for immune-mediated diseases on chromosome 10p15 (S1 Fig), which contains the candidate causal gene
IL2RA.IL2RAencodes a subunit CD25 (IL-2RA) of the interleukin 2 (IL-2) receptor that is es-sential for the high affinity binding of IL-2 [14]. The region has provided some prime examples of evolving genetic research. Initially associated with T1D susceptibility using a candidate gene and tag SNP approach [15], further studies revealed association to other autoimmune diseases, including MS [16] and rheumatoid arthritis [17], and demonstrated that multiple genetic markers were needed to explain the T1D association [18]. Genotype to phenotype studies have demonstrated that disease-associated variants in the region also associate withIL2RAmRNA expression and CD25 protein expression on the surface of naive and memory CD4+T cells [19–21] and sensitivity of memory CD4+T and activated T regulatory cells to IL-2 [22].
Results
Fig 1. Overview of the fine mapping tailored stochastic search strategy in GUESSFM.1. SNPs are clustered based on genotype data. Tagging is used to remove cases of extreme LD (r2>0.99) by selecting one SNP from each cluster (“tag set”), that which is in highest averager2with all other SNPs. 2. All possible models that can be formed from the tag SNPs may be considered by GUESS. Here, all seven possible models are considered but, in practice, with larger numbers of tags than shown here, GUESS employs a stochastic search strategy to consider only a subset of models, prioritising those with greatest statistical support. 3. GUESS selects the most likely models amongst those it has visited. Here, it selects two of the seven, but in larger data sets we retain the 30,000 most likely. 4. Each of these selected models is expanded by considering all possible substitutions of tags by other members of their tag set. Each expanded model is then assessed again individually, using an approximate Bayes factor [14].
the 1000 Genomes Project data. This gave a total of 667 SNPs and small indels with minor al-lele frequency>0.005 in controls for analysis after genotype quality control.
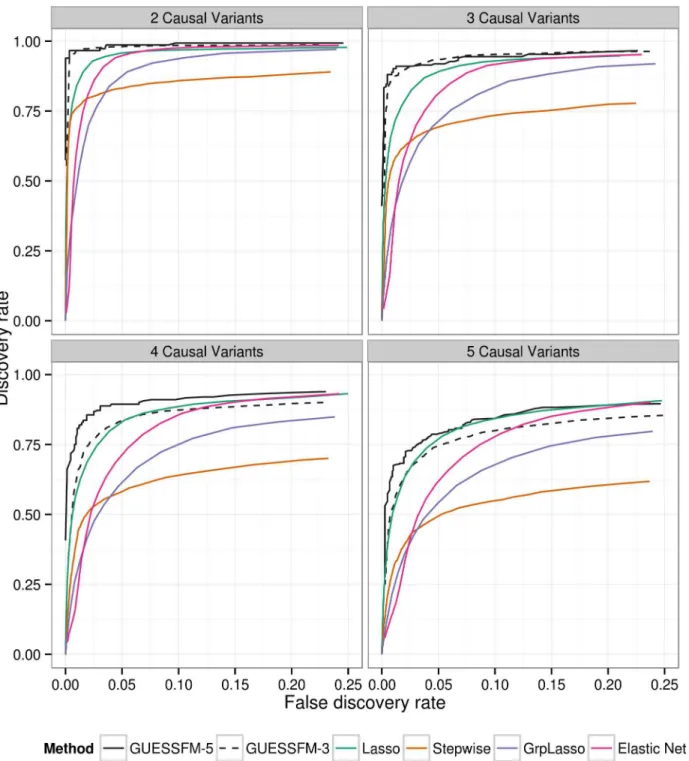
To allow for the effects of LD, traditional conditional regression is often supplemented by identifying subsets of SNPs with some minimum LD (e.g.r2>0.8) with individual SNPs select-ed by a forward stepwise procselect-edure, within which it is suggestselect-ed the causal variant may lie. We compared our proposed approach to traditional conditional regression by simulating pheno-types conditional on multiple“causal variants”selected randomly from within these genetic data, and confirmed that the proposed approach both recovered a higher proportion of the true effects and simultaneously detected fewer false positive results (Fig 2). GUESSFM requires specification of thea prioriexpected number of causal variants in a region,nexp. We considered either settingnexp= 3 ornexp= 5, and found the performance decreased whennexpwas less than the true value, but not when it was greater than the true value, suggesting that for recovery of the correct causal variants it is better to setnexphigher rather than lower. We also considered three regularised regression approaches: the lasso, the elastic net and the group lasso. The ROC curves of those methods (for decreasing penalties) are intermediate to the stepwise and sto-chastic GUESSFM search approaches (Fig 2). However, at traditional optimization thresholds (minimising the ten fold cross validation), regularized regression approaches were extremely anti-conservative, with a very high false discovery rate, compared to stepwise (stopping at
p<10−8orp
<10−6) or GUESSFM for suitable thresholds on posterior probabilities (S2 Table). Picking a regularisation parameter according to the number of predictors included (three or five) produced a more competitive false discovery rate, but discovery rates were still lower than with GUESSFM (S2 Table).
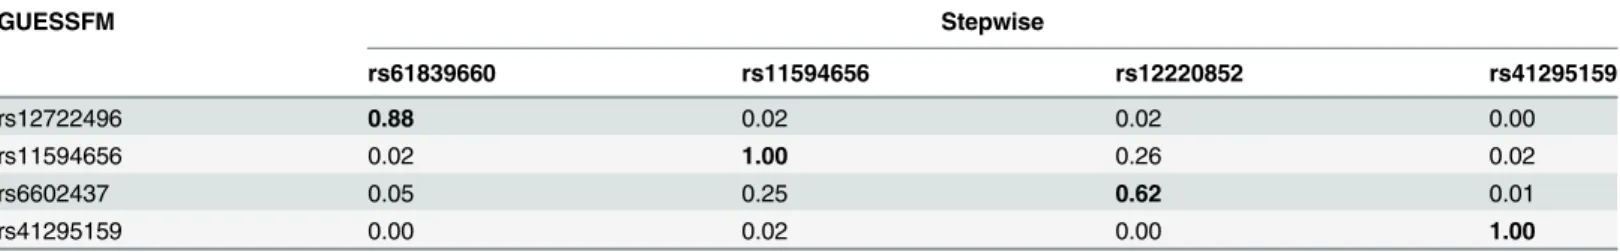
We applied our approach to the MS and T1D data sets. Posterior support for the number of SNPs required to model the association is strongly peaked, favouring a two-SNP model in MS and a four SNP model in T1D (S2 Fig). We summarised inference for SNPs over multiple mod-els by considering the support for a SNP group according to the sum of posterior probabilities (PP) over all models containing a SNP from that group. We term this the group marginal pos-terior probability of inclusion (gMPPI), which can be understood as the probability that one SNP in the group is causal for the trait of interest. For T1D, there is high confidence (gMPPI>0.8) for four SNP groups that we denote according to their order inS3 Fig: A (in-dexed by rs12722496), C (rs11594656), E (rs6602437) and F (rs41295159). As the T1D data have previously been analysed using stepwise regression [23], we compared our results to those found by forward stepwise analysis of the same data (Table 1). We saw a direct correspondence in terms of LD (r2>0.6) between the SNPs identified by the two approaches (Table 2). Howev-er, models found by GUESSFM had larger log likelihoods for a given number of SNPs, indicat-ing that these models offered a better explanation of T1D-associated genetic variation in the region.
In contrast, for MS, there were no SNP groups with high gMPPI. We instead saw two dis-tinct models, which together accounted for>80% of the posterior support amongst the 514,476 visited models: either model M1, consisting of SNP groups A (indexed by rs12722496) and D (rs56382813), or model M2 consisting only of SNP group B (rs2104286). SNPs from M1 and M2 were rarely selected together (total PP = 0.039 across the visited models). rs2104286 was reported as the single associated SNP in the region in the original MS ImmunoChip analy-sis after forward stepwise regression [7] (Table 1). rs2104286 is in low to moderate LD with both of the M1 index SNPs (r2’0.3,Table 3).
Fig 2. Comparison of of several multivariate methods for fine mapping using simulated data.We simulated quantitative phenotype data with between two and five causal variants using genotype data from the T1D dataset for theIL2RAregion. The simulated data sets were analysed using forward stepwise regression, GUESSFM, the lasso, the group lasso and the elastic net. GUESSFM produces credible sets for each variant chosen using the snp.picker algorithm described in Materials and Methods. We defined pseudo“credible sets”for the other approaches as the set of SNPs withr2>0.8 with a selected SNP. We calculated the discovery rate (the proportion of causal variants within at least one credible set, y axis) and false discovery rate (proportion of detected variants whose credible sets did not contain any causal variant, x axis) at different thresholds for the stepwisepvalue, the group marginal posterior probability of inclusion (gMPPI) for GUESSFM and the regularization parameter(s) across simulated datasets (seeMethodsfor details). GUESSFM-3 and GUESSFM-5 refer to GUESSFM run with a prior expectation of three or five causal variants per region, respectively. Results are averaged over 1000 replicates.
Table 1. Comparison of results from stochastic GUESSFM and stepwise searches.pvalues are shown for the stepwise search and compare the listed model to the model above (or the null model, for single SNPs). Bayesian Information Criterion (BIC) is shown for stepwise models and index models found through GUESSFM search.
Model p BIC
T1D Stepwise
rs61839660 <2 × 10⁻¹⁶ -140.10
rs61839660+rs11594656 7.64 × 10⁻¹² -177.61
rs61839660+rs11594656+rs12220852 1.40 × 10⁻⁹ -204.35
rs61839660+rs11594656+rs12220852+rs41295159 1.39 × 10⁻⁷ -218.83
T1D GUESSFM
rs12722496+rs11594656+rs6602437 – -207.00
rs12722496+rs11594656+rs6602437+rs41295159 – -234.95
MS Stepwise
rs2104286 <2 × 10⁻¹⁶ -97.25
rs2104286+rs11256593 0.00001437106213 -105.85
MS GUESSFM
rs2104286 (“M2”) – -97.25
rs12722496+rs56382813 (“M1”) – -111.18
doi:10.1371/journal.pgen.1005272.t001
Table 2. LD (r2) between SNPs in selected models for T1D using stochastic GUESSFM and stepwise searches.Each GUESSFM search signal has a correspondng SNP found by conditional stepwise regression in moderate to strong LD.
GUESSFM Stepwise
rs61839660 rs11594656 rs12220852 rs41295159
rs12722496 0.88 0.02 0.02 0.00
rs11594656 0.02 1.00 0.26 0.02
rs6602437 0.05 0.25 0.62 0.01
rs41295159 0.00 0.02 0.00 1.00
doi:10.1371/journal.pgen.1005272.t002
Table 3. LD (r2) between SNPs in selected models for MS using stochastic GUESSFM and stepwise searches.For the preferred M1 model for MS, there is only weak to moderate LD between SNPs chosen by GUESSFM and conditional approaches.
GUESSFM Stepwise
rs2104286 rs11256593
M2: rs2104286 1.00 0.33
M1: rs12722496 0.33 0.08
M1: rs56382813 0.31 0.29
formed by the M1 SNPs to a model consisting of only rs2104286 was significant
(p= 2.64 × 10⁻⁶). However, the posterior support favours model M1 over M2 only by a factor of 1.7 and this is dependent on our prior expectation for the number of causal variants: had we expected only a single causal variant in the region, we would have favoured M2 by a factor of 1.7, with M1 being favoured only with a prior expectation of 1.8 or more causal variants (S4 Fig). Under any reasonable prior, the posterior support for the two models is so close that we cannot choose between them on statistical evidence alone: we must consider them as plausible alternative explanations for MS association in the region. Note that the M1 SNPs were not within the credible set created under the single causal variant assumption, which consists of rs2104286 alone [7].
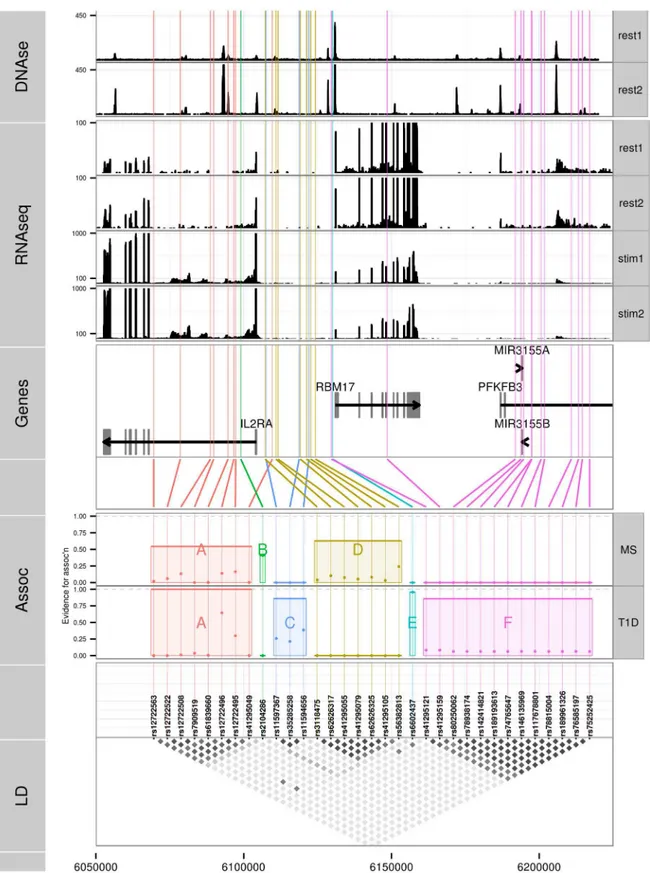
We selected all high confidence SNP groups for more detailed exploration (Fig 3). The T1D signals are located in (1) intron 1 ofIL2RA—SNP group A, (2) intergenic betweenIL2RAand
RBM17—C, (3) 5’ofRBM17—E, and (4) 5’ofRBM17to intron 2 ofPFKFB3—F. Under the model M1 for MS, SNP group A was also associated with MS, with the same alleles protective for both (Table 5) whilst the second M1 signal (SNP group D) physically overlapped, but was not in LD with, SNPs from group C. Under the model M2, the sole-MS associated SNP (B) is located in intron 1 ofIL2RA, neighbouring the T1D-associated SNP group A, but there was only weak LD between A and B (r2= 0.3).
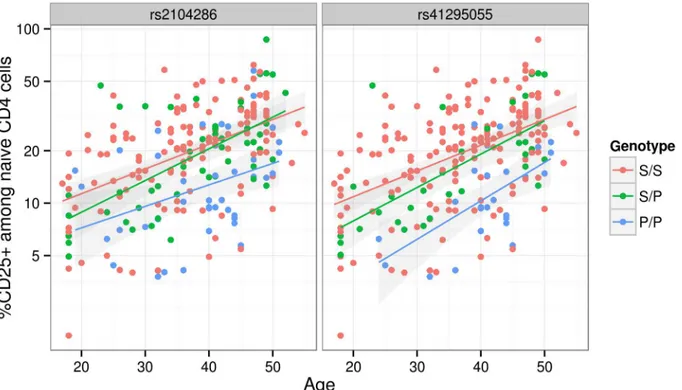
Since we were unable to distinguish between the competing M1 and M2 models for MS using SNP-disease association data alone, we sought corroborating evidence to support SNPs in either model using CD25 flow cytometric expression data. The M2 SNP rs2104286 has been associated with the age-dependent proportion of naïve T cells that express CD25 on their cell surface and rs12722495 (within SNP group A, located in intron 1 ofIL2RA) with the total ex-pression of CD25 on memory T cells [19,20]. rs12722495 has also been associated withIL2RA
mRNA expression in T cells, both resting [19] and activated by 48 hour culture with anti-CD3 +CD28 [21]. We selected a single tag SNP from each of the credible sets and examined which could best explain CD25 protein expression phenotypes using previously published data from 179 samples [19], plus an additional 30 samples. Both phenotypes were best explained by a sin-gle SNP: rs12722495 from group A again showed the strongest association with intensity of CD25 expression on memory T cells (p= 5.50 × 10⁻¹⁰,S5 Fig). For the proportion of naive CD4+cells that express CD25, the M1 SNP rs41295055 from group D, whose association with CD25 expression was not previously tested, was preferred to the M2 SNP rs2104286
(p= 3.45 × 10⁻⁸versus p= 2.56 × 10⁻⁶,ΔBIC = 8.43, which is interpreted as
“strong”evidence in favour of rs41295055 [24];Fig 4), supporting the hypothesis that rs2104286 is not itself func-tional, but merely tags other functional variants which are causal for MS. The A and D SNP groups coincide with regions inIL2RAthat contain DNase I sensitivity sites indicating open chromatin available to bind transcription factors under appropriate conditions (Fig 3). In
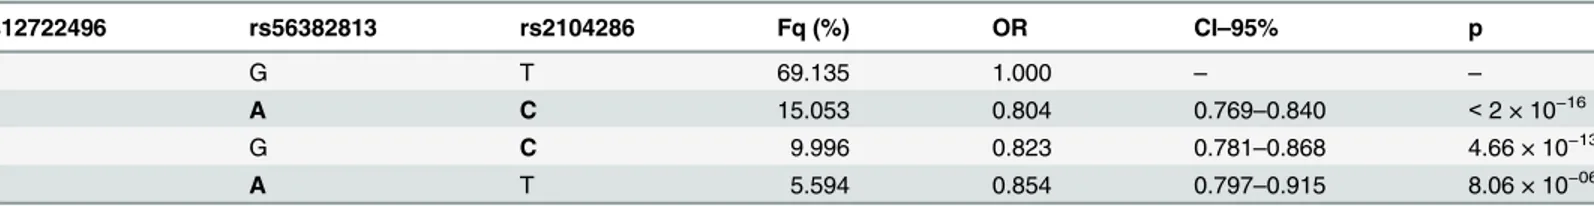
Table 4. Haplotype analysis of MS association using the index SNPs for the one and two SNP models selected.Minor alleles are indicated by bold font. Fq = haplotype frequency.
rs12722496 rs56382813 rs2104286 Fq (%) OR CI–95% p
A G T 69.135 1.000 – –
A A C 15.053 0.804 0.769–0.840 <2 × 10⁻¹⁶
G G C 9.996 0.823 0.781–0.868 4.66 × 10⁻¹³
A A T 5.594 0.854 0.797–0.915 8.06 × 10−06
(“rest1”and“rest2”) and anti-CD3/CD28 stimulated (“stim1”and“stim2”) CD4+T cells; y axes were truncated to allow visualization of intronic read counts. Note the different limits for resting and stimulated cells, which show greater transcription of all protein coding genes in the region.DNase: DNase hypersensitivity measured in CD4 cells by the Roadmap consortium. Replicate 1 (“rest1”) is RO_01689; replicate 2 (“rest2”) is RO_01736; y axes were truncated again to improve visualization.
doi:10.1371/journal.pgen.1005272.g003
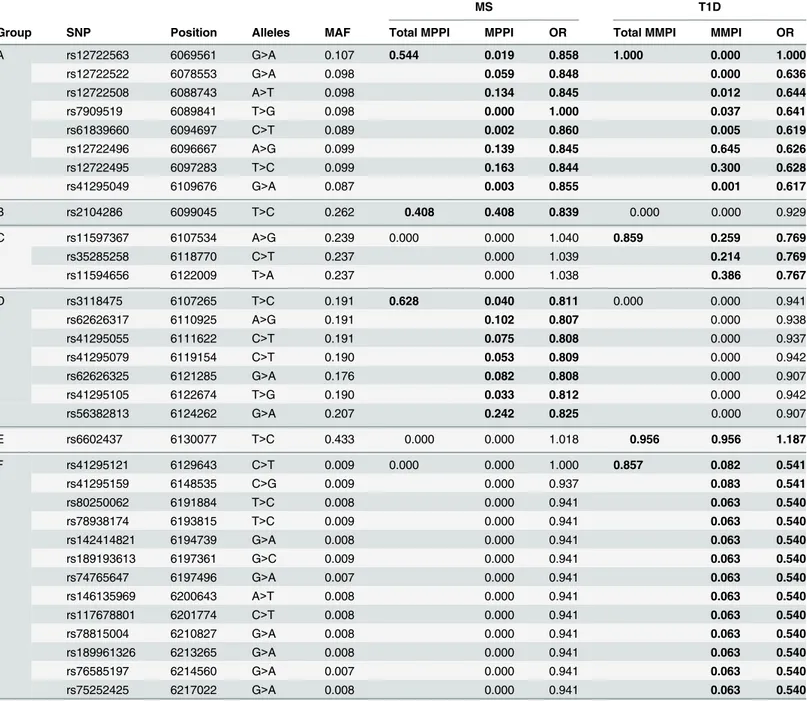
Table 5. SNPs selected by GUESSFM mapping of MS and T1D associations.SNP groups are labelled A-F for reference. Position is according to hg19; MAF = minor allele frequency in UK controls, OR = odds ratio for minor allele, MPPI = marginal posterior probability of inclusion. SNP groups are divided by horizontal lines, and the group MPPI (gMPPI) is the posterior probability of inclusion of any SNP in the group. We highlight in bold the SNP sets with some support for association with either MS or T1D. The MS model“M1”consists of groups A and D, the model“M2”consists of group B.
MS T1D
Group SNP Position Alleles MAF Total MPPI MPPI OR Total MMPI MMPI OR
A rs12722563 6069561 G>A 0.107 0.544 0.019 0.858 1.000 0.000 1.000
rs12722522 6078553 G>A 0.098 0.059 0.848 0.000 0.636
rs12722508 6088743 A>T 0.098 0.134 0.845 0.012 0.644
rs7909519 6089841 T>G 0.098 0.000 1.000 0.037 0.641
rs61839660 6094697 C>T 0.089 0.002 0.860 0.005 0.619
rs12722496 6096667 A>G 0.099 0.139 0.845 0.645 0.626
rs12722495 6097283 T>C 0.099 0.163 0.844 0.300 0.628
rs41295049 6109676 G>A 0.087 0.003 0.855 0.001 0.617
B rs2104286 6099045 T>C 0.262 0.408 0.408 0.839 0.000 0.000 0.929
C rs11597367 6107534 A>G 0.239 0.000 0.000 1.040 0.859 0.259 0.769
rs35285258 6118770 C>T 0.237 0.000 1.039 0.214 0.769
rs11594656 6122009 T>A 0.237 0.000 1.038 0.386 0.767
D rs3118475 6107265 T>C 0.191 0.628 0.040 0.811 0.000 0.000 0.941
rs62626317 6110925 A>G 0.191 0.102 0.807 0.000 0.938
rs41295055 6111622 C>T 0.191 0.075 0.808 0.000 0.937
rs41295079 6119154 C>T 0.190 0.053 0.809 0.000 0.942
rs62626325 6121285 G>A 0.176 0.082 0.808 0.000 0.907
rs41295105 6122674 T>G 0.190 0.033 0.812 0.000 0.942
rs56382813 6124262 G>A 0.207 0.242 0.825 0.000 0.907
E rs6602437 6130077 T>C 0.433 0.000 0.000 1.018 0.956 0.956 1.187
F rs41295121 6129643 C>T 0.009 0.000 0.000 1.000 0.857 0.082 0.541
rs41295159 6148535 C>G 0.009 0.000 0.937 0.083 0.541
rs80250062 6191884 T>C 0.008 0.000 0.941 0.063 0.540
rs78938174 6193815 T>C 0.009 0.000 0.941 0.063 0.540
rs142414821 6194739 G>A 0.008 0.000 0.941 0.063 0.540
rs189193613 6197361 G>C 0.009 0.000 0.941 0.063 0.540
rs74765647 6197496 G>A 0.007 0.000 0.941 0.063 0.540
rs146135969 6200643 A>T 0.008 0.000 0.941 0.063 0.540
rs117678801 6201774 C>T 0.008 0.000 0.941 0.063 0.540
rs78815004 6210827 G>A 0.008 0.000 0.941 0.063 0.540
rs189961326 6213265 G>A 0.008 0.000 0.941 0.063 0.540
rs76585197 6214560 G>A 0.007 0.000 0.941 0.063 0.540
rs75252425 6217022 G>A 0.008 0.000 0.941 0.063 0.540
addition, the existence of RNA-seq reads from resting and stimulated CD4+T cells within in-tron 1, where group A SNPs lie (Fig 3), support the regulatory nature of this region [25].
Discussion
The 10p15 region contains at least five apparently distinct associations to the immune-mediat-ed diseases, T1D and MS. Our results are the first to support a four SNP model in T1D, which most likely reflects a combination of increased sample sizes and the increased variant density available due to ImmunoChip and imputation, as this model was supported by both stepwise regression and GUESSFM. A previous comparative study of MS and T1D susceptibility in this region using conditional analysis of tag SNPs identified three groups of SNPs [26]: their group I matches our group A, their group II our group C, and their group III our group B. The results showed that the minor allele of SNPs in all these groups was protective for T1D, but that group I (A) was not associated with MS and that group II (C) was susceptible for MS. Our results, based on larger sample sizes and more extensive variant coverage, suggest that the minor allele of SNPs in group A, shared between T1D and MS, are associated with the same protective effect for both diseases. This emphasises the need for surveying the most complete set of variants pos-sible in order to make cross disease comparisons.
Variants in this region have previously been linked to several aspects of IL-2R signalling in T1D and MS patients [27] and the MS-associated variants we identify (whether under the M1
Fig 4. The proportion of naive CD4+T cells that express CD25 (log scale) increases with age.The MS protective allele for the M2 SNP rs41295055: C>T associates with fewer CD4+T cells expressing CD25 across all ages (p= 3.45 × 10⁻⁸), and is statistically preferred to the previously reported M1 SNP, rs2104286:T>C (p= 2.56 × 10⁻⁶;ΔBIC = 8.43). S and P are used to represent the (common) MS-susceptible and (rare) MS-protective alleles respectively at
each SNP. These SNPs are in limited LD (r2= 0.3).
or M2 models) all showed some evidence of association with expression of CD25 on the surface of T cells, linkingIL2RAin a primary way into the etiology of this disease. For T1D, we were only able to link theIL2RAintron 1 signal, shared with MS under the M1 model, to CD25 ex-pression on memory T cells. Neither the intergenic T1D SNP group (C), despite physical over-lap with the MS associated SNP group D, indexed by rs41295055, nor the sets nearRBM17and
PFKFB3(E and F) have yet been linked toIL2RAexpression. These signals could relate to CD25 expression on other cell subsets or under specific conditions. The cell-specific regulation ofIL2RAexpression and its role in modulating the immune system are both complex and only partially understood. For example, in addition to T cells,IL2RAis also expressed on many other cell types, especially under inflammatory conditions [28]. We have data on only a subset of IL-2R phenotypes that have been previously reported, and previous studies have genotyped only a subset of the disease associated SNPs described in this paper. Further genotyping of large samples with IL-2R related phenotypes is warranted to properly assess any other potential effects of the disease signals we identify on IL-2R signalling. Alternatively, it may be that other genes in the region, which have not been as well studied asIL2RA, are also causal for T1D, ei-ther directly or through interaction withIL2RA. For example,PFKFB3, an inducible 6-phos-phofructo-2-kinase/fructose-2, 6-bisphosphatase isoform, allows rapid responses to energy requirements and insufficiency can lead to apoptosis and an inability to undergo autophagy in CD4+ T cells in RA [29].PFKFB3has also been implicated in regulating insulin secretion in pancreatic beta cells [30], which could explain the T1D specific signals across this gene. All three genes,IL2RA,PFKFB3andRBM17are upregulated in CD4+T cells uponex vivo activa-tion (S3 Table) and two candidate SNPs, from groups E and F, sit between two DNase I sites close to theRBM17promoter. Furthermore, gene regulation can extend over 100 kb [31] and further studies will be needed to confirm the gene(s) through which these other SNPs influence T1D risk.
Two or more independent signals are commonly observed in fine mapped autoimmune dis-ease regions using stepwise regression [7–10]. Despite long established doubts regarding the validity of stepwise regression [3], its use has continued to dominate in GWAS because of the number of SNPs measured simultaneously. Stepwise regression addresses the questions:‘which is the single variant that can best explain the maximum trait variance?’and, conditional on this single variant,‘do any other variants explain additional trait variance?’This is not equivalent to asking what set of variants best jointly explain trait variance. Often, as we have observed for T1D, stepwise regression may be expected to identify the same signals as a stochastic search ap-proach. However, our analyses demonstrate that different results may be produced by stepwise and full multi-variant search approaches in some cases. In particular, we highlight and prefer a two SNP model for MS association to theIL2RAregion, one of the SNPs shared with T1D (group A, indexed by rs12722495) and associated with CD25 expression on memory T cells, the other (group D, indexed by rs41295055) a better predictor for CD25 expression on the sur-face of naive CD4+T cells than the SNP identified by stepwise regression (group C, rs2104286).
efficiency, but also because its g-prior formulation is specifically designed to deal with highly correlated predictors, a beneficial feature for fine mapping.
Applying the regularised regression approaches to our simulated data showed that the ROC curve for lasso with decreasing penalty out-performed stepwise analysis, but optimising the regularization parameter by minimising the cross validation error led to very high false discov-ery rates, suggesting that in this context this criterion is highly anti-conservative. Previous stud-ies have also indicated that while regularised regression has strengths in terms of prediction, it may have weaknesses in terms of model selection [37], particularly for correlated predictors [38]. Elastic net [39] and the group lasso [40] have been proposed as regularised approaches tailored to correlated predictors, but in our hands did not outperform the simple lasso plus construction of a set of plausible SNPs according tor2>0.8. We considered that the informa-tion supplied to GUESSFM as a prior expected number of causal variants could be included equivalently in a regularised approach by setting the regularisation parameter according to the number of predictors selected. Although this produced a more competitive false discovery rate, discovery rates remained lower than with GUESSFM (S2 Table).
Our multidimensional analysis strategy, tailored to the high genotyping coverage (and, hence, high LD) required for fine mapping causal variants can provide a more complete picture of the likely causal variants in a region. Any fine mapping study is limited by the set of variants included for study. While we attempted to survey the fullest possible set of SNPs and small indels by using dense genotyping data, plus imputation to the 1000 Genomes Project data, we cannot be sure we included all variants that might affect gene function without sequencing of cases and controls [41]. Further, larger indels, VNTRs and microsatellites remain particularly difficult to genotype with accuracy yet may contribute to disease. Therefore, it is important to bear in mind that all claims that a particular variant is causal are conditional on the true causal variants being accurately genotyped and included in the study.
It is well known that functional biological interactions may exist between variants [42], and therefore the possibility of statistical interactions needs to be considered in fine mapping stud-ies. However, the need to fit interaction terms depends on the evolutionary history of the re-gion. In theIL2RAregion, there has been very little historical recombination (S1 Fig) andD0 between markers is nearly always 1, also indicating a lack of recombination [43]. As a conse-quence, only three of the possible four haplotypes that may be formed from any pair of SNPs are observed, and statistical interaction parameters are inestimable. This also implies that there is a one to one transformation between a haplotype model and a model expressing the log odds of disease as a linear function of single SNP effects [44], as we have employed. Thus, for the
IL2RAregion, we may neglect statistical interactions without making any assumptions about the existence of biological interactions. For our method to be applied to regions in whichD0< 1, it would need extension to include statistical interaction terms. One simple approach, if the number of SNPs is not to large, would be to generate additional variables representing interac-tions between SNPs withD0<1, but extending GUESS to fit interaction terms is another direc-tion for further research.
genome sequencing, and thus with more complete coverage of potential causal variants, could be better explained by a single SNP [47]. This suggests, perhaps, that statistical interactions be-tween SNPs will prove rare. However, if biological interactions bebe-tween variants separated by LD do exist, and the interaction depends on the phase of the variants, i.e., the diplotype risk dif-fers from the two locus genotype risk, haplotype methods will again be required to infer likely causal variants.
One way to understand the means through which the effects of a disease-associated variant are mediated is to perform functional assays to examine its effects on a gene’s function [48] or to identify potentially intermediate phenotypes with which it is also associated [19]. Improved identification of likely causal variants should lead to more powerful and reliable follow-up studies, an important factor when many of these experiments require fresh primary cells and laborious wet lab protocols. Similarly, comparison with summary results from eQTL studies would be facilitated by the application of multi modal search strategies to the eQTL data set to ensure the effects of genetic variation are mapped as accurately as possible [49]. Even with large samples, and careful fine-mapping analyses, the causal candidacy of SNPs in high LD can-not be resolved through statistical association alone. Functional studies designed to directly ad-dress the confounding induced by linkage disequilibrium, such as allele-specific expression using rare haplotypes that distinguish SNPs in the same tag group, may be helpful in refining further the likely causal variants.
Informative approaches to understanding disease etiology have recently been developed based on looking for enrichment of the cell-specific chromatin marks localising to likely causal variants, and these are being used to highlight disease relevant cells [23,50]. Here, again, more accurate identification of causal variants will lead to more powerful and precise comparisons, and our approach, which is associated to a more accurate estimation of posterior probabilities for the SNPs in the considered region, should be readily adaptable to the growing set of meth-ods that aim to examine enrichment [5] or colocalisation [6] by model averaging over the pos-terior probabilities that a SNP is causal.
Materials and Methods
Definition of target region
For fine mapping, we require dense coverage of genetic polymorphisms in the region. We tar-geted the ImmunoChip fine mapping region centred onIL2RA, namely chr10:6030000-6220000 (hg19). This region is bounded by recombination hot spots (S1 Fig).
Genotype data
Genotype data for this region comes from the MS [7] and the T1D [23] ImmunoChip studies. Quality control measures were applied to SNPs and samples as previously described [7]. As MS samples were derived from multiple international cohorts and we found allele frequencies for SNPs in the region varied between cohorts, we manually inspected plots of the first five princi-pal components formed from ancestry informative markers [7] and additionally excluded sam-ples lying outside the main cluster in each cohort.
Imputation
Adapted
“
shotgun
”
GUESS analysis
Tagging. Although GUESS is designed to work with correlated variables, the extreme, and occasionally perfect, LD in very dense genotyping data can lead to unstable results. We found, through a process of trial and error, that tagging so that no two SNPs remained withr2>0.99 retained good convergence of the stochastic GUESS algorithm. This reduced the number of SNPs from 667 to 443 (T1D) and 453 (MS). For each SNP that was removed, we noted its
indexSNP, the remaining SNP which had the highestr2with it. We call a set of SNPs sharing a single index SNP atagset; the number and size of tagsets is shown inS6 Fig.
GUESS analysis. We ran GUESS in parallel on each disease using the index SNPs defined above. For MS, which included internationally derived samples, we included country of origin as a categorical covariate. Monitoring plots for each GUESS run, generated by R2GUESS [52] (http://cran.r-project.org/web/packages/R2GUESS), are shown inS7andS8Figs. We saved the top 30,000 models visited for each disease and for each saved model, we generated an expanded set of models, by adding each model that could be formed by replacing any index SNP with any of the SNP(s) in its tagset (Fig 1). This expanded the set of models under consideration,M, ten
fold, to 514,476. For each trait, we derived a posterior weight for each model inM. To be
pre-cise, we generated approximate Bayes factors for each model,m2M, for each trait, using the
Bayesian Information Criterion (BIC) approximation:
BICm¼ 2logðBFmÞ
where
BICm¼ 2ðlogðLmÞ logðL0ÞÞ þ ðkm k0ÞlogðnÞ;
Lmandkmrepresent the logistic likelihood of the data and the number of parameters under modelm,nis the number of samples and 0 represents the null model. Finally we combined these Bayes factors with priors for each model,πm, to derive a posterior probability for each
model
PPm/BFmpm:
Choice of priors
Priors could conceivably be generated on the basis of individual SNP content, for example, to prioritise those overlapping genomic annotations of particular interest. Such an approach has been adopted in a hierarchical framework, albeit with the single causal variant assumption [5]. For simplicity, and because we were interested to discover likely causal variants without prede-fining their likely mechanism, our model priors were determined only by the number of SNPs contained in a model,Nm. A natural prior is then binomial or beta binomial. Given that, for a fixed expected value, a beta binomial puts larger weight on implausibly large models, we chose to use a binomial model, and, given published data on T1D, set the expected number of SNPs at three. ForNSNPs in the target region, this means the prior for a model containingNmSNPs is
pm¼ N Nm
qnð1 qÞN Nm
whereqis set so the expected value of the binomial distribution was 3, ieq¼3 N. Priors and posteriors for the number of causal SNPs are shown inS2 Fig.
likely to be diluted across such sets of variants. To group such SNPs, we used the marginal pos-terior probabilities of inclusion (MPPI) for each SNP, and applied the following algorithm:
1. Pick the index SNP with maximum MPPI
2. Order remaining SNPs by decreasingr2with index SNP
3. Exclude SNPs which co-occur in models with the index SNP (joint MPPI>0.02)
4. Step away from the index SNP in order of decreasingr2, adding SNPs to its group until MPPI<0.001 for two SNPs in a row (NB, these SNPs will not be added to the SNP group), or untilr2<0.5
5. Remove this set of SNPs and return to step 1 until no SNP remains with MPPI>0.01.
We summarize the support for any group of SNPs by the gMPPI, the sum of the posterior probabilities over all models containing a SNP in that group. The complete algorithm is avail-able in the function snp.picker from the R package GUESSFM (https://github.com/
chr1swallace/GUESSFM).
Model averaged effect estimates. We produced effect estimates for each SNPias
bi ¼X
m2M
Iði2mÞbðmÞ
i PðmÞ
wherebðimÞis the estimated effect of SNPiin modelm,I(i2m) is an indicator function taking the value 1 if SNPiis included in modelm, and 0 otherwise, andP(m) is the posterior probabil-ity ofm2M.
Simulation analysis
We used simulated data to compare the performance of our proposed method, traditional step-wise regression, the lasso [53] and the elastic net [39]. For each simulation, we selected a ran-dom subset of 2,000 T1D control samples genotyped in theIL2RAregion and a random set of between two and five“causal variants”from amongst the SNPs with MAF>0.01. We simulat-ed a Gaussian phenotype for which the causal variants actsimulat-ed in an additive manner to jointly explain 10% of the phenotypic variance. We conducted a total of 1,000 simulations for each scenario.
The data were analysed in parallel using the four different methods. We performed forward stepwise regression, and selected index SNPs at a givenpvalue threshold,α, as those SNPs
se-lected at any stage of the stepwise process withp<α. For each index SNP, we created pseudo
“credible sets”as the set of SNPs withr2>0.8 with the selected index SNPs. Note, by this defi-nition, simulated causal SNPs may appear in more than one SNP group. We calculated the false discovery rate as the proportion of SNP groups which did not contain a causal variant, and we calculated the discovery rate as the proportion of causal variants found in at least one selected SNP group.
We used thesnp.pickerfunction from GUESSFM (http://github.com/chr1swallace/ GUESSFM) with default settings to define credible sets for causal SNPs. By definition of the al-gorithm, SNPs may only be members of at most one SNP group. We selected SNP groups ac-cording to varying thresholds for the gMPPI, and calculated false discovery and discovery rates as above.
For lasso and elastic net, we used the R package glmnet [54], and optimised the regularisa-tion parameterλby minimising the ten fold cross validation error using thecv.glmnet()
chose the pair of values (α,λ) which minimised the ten fold cross validation error overall. To
examine the path of elastic net solutions, we fixedαat this value and variedλ. We used the R
packagegglasso[55] to implement the grouped lasso, predefining groups of variables as those withr2>0.8 with each other using heirarchical clustering. We also considered the dis-covery and false disdis-covery rates with the first three or first five predictors selected, as something analagous to the prior information given to GUESSFM about our expectation of the number of causal variants.
Association with cell surface expression of CD25
Naive CD4+T cells from 209 donors were gated as previously described [19,56]. Association with index SNPs from disease-associated groups was assessed through linear regression. All possible one, two and three SNP models were considered, and the model with the minimum BIC reported. Expression was log transformed to reduce right skew of the phenotype.
DNase hypersensitivity data
We downloaded DNase I hypersensitivity for CD4+T cells from the Roadmap Consortium [57] fromhttp://vizhub.wustl.edu/VizHub/hg19, accessed 19 September.
RNA seq gene expression data
We measured gene expression in the studied region in two pooled samples (n = 3 and n = 4 in-dividuals / pool) comparing unstimulated and stimulated CD4+T cells. For each individual, 250,000 CD4+T cells (93–99% pure, RosetteSep Human CD4+T Cell Enrichment Cocktail, StemCell Technologies) were stimulated with anti-CD3/CD28 T-activator beads (Dynabeads Life Technologies) at a ratio of 0.3 beads / cell for four hours at 37°C in X-VIVO-15 (Lonza) + 1% AB serum (Lonza) and penicillin/ streptomycin (Life Technologies). Unstimulated CD4+ T cells were cultured in medium alone for four hours. Cells were harvested directly into Qiagen lysis buffer (Qiagen) and stored at -80°C until RNA isolation.
RNA was isolated using RNeasy micro kit including gDNA depletion (Qiagen). RNA integ-rity and concentration was evaluated using the Bioanalyzer platform (Agilent), with all samples showing an RNA integrity score (RIN)>9.8. 750 ng of total RNA were used for the prepara-tion of cDNA libraries using the Illumina TruSeq (Illumina) platform with a low-cycle-number PCR protocol, and was followed by transcriptome sequencing on an Illumina HiSeq 2000. This yielded four libraries with*38 million 100 bp paired-end reads each.
We trimmed raw reads to remove primer and adapter contamination, which affected 2% of our sequences, using HTSeq [58]. Reads were aligned to the reference genome Ensembl GRCh37.p13 using STAR [59]. Removal of low quality and unpaired reads, indexing,IL2RA re-gion extraction, and depth counting were performed using SAMtools [60]. We employed HTSeq and DESeq2 [61] to carry out a differential expression analysis between the two condi-tions based on normalised read counts. We only considered paired-end reads that featured a total and unambiguous overlap with genomic sequence assigned to genes, around 73% of the initial raw sequences. Mapped read counts at each position in each sample are inS4 Table.
Consortium collection sites obtained approvals for all subject collections and written consent and/or assent was obtained from all participants or their surrogates in the study.
Supporting Information
S1 Fig. Manhattan plots for MS and T1D on chromosome 10:6,000,000-6,300,000 (hg19).
Bottom track shows HapMap recombination rates and the blue bar indicates the region tar-geted for fine mapping.
(TIFF)
S2 Fig. Prior and posterior probabilities across number of SNPs in underlying candidate causal models.For posteriors, this is the sum of posterior probabilities over all models visited by GUESS which contain the number of SNPs shown.
(TIFF)
S3 Fig. Patterns of inclusion of SNP groups in T1D and MS.Total filled bar height is propor-tional to gMPPI for the group indexed by the SNP shown on the x axis. Only the most probable SNP groups (gMPPI>0.1) are labelled;“other”denotes SNPs outside these more probable SNP groups. Black fill indicates high confidence SNP groups (A-F) that were taken forward for further analysis. Groups indexed by rs17173494 and rs11256593 were considered to have too little support for either disease for association to be declared with confidence. For MS, we see two competing models: M1 indexed by A (rs12722496) and D (rs56382813), and M2, indexed by B (rs2104286).
(TIFF)
S4 Fig. Sensitivity analysis showing the effect of varying the prior expectation of the num-ber of causal variants on the relative posterior support for model M1 over M2 for MS.The relative posterior support is calculated as the posterior probability of all models within the M1 group divided by the posterior probability of all models within the M2 group for a given prior expectation. For a prior expectation of three, this is the ratio of bar heights for M1 over M2 from S4 Fig.
(TIFF)
S5 Fig. Normalised mean fluorescence intensity of CD25 dye on memory CD4+T cells in-creases with copies of the (minor) T1D-protective (P) allele at rs12722495:T>C compared to the susceptible (S) allele,p= 5.50 × 10⁻¹⁰.
(TIFF)
S6 Fig. Size of SNP groups after tagging atr2>0.99. (TIFF)
S7 Fig. GUESS monitoring plots for T1D.The three chains are indicated by different colours. (TIFF)
S8 Fig. GUESS monitoring plots for MS.The three chains are indicated by different colours. (TIFF)
S1 Table. Samples with ImmunoChip genotyping data used in the fine mapping analysis.
(PDF)
causal variants within at least one credible set, y axis) and false discovery rate (proportion of detected variants whose credible sets did not contain any causal variant, x axis) at different thresholds for the stepwisepvalue (<10−6or
<10−8), the group marginal posterior probability of inclusion (gMPPI>0.5 or>0.9) for GUESSFM and the regularization parameterλ(chosen
to minimise the ten-fold cross validation error, or at the largest value that selected exactly three or five predictors) across simulated datasets.
(PDF)
S3 Table. Differential expression analysis of genes in the region considered in this paper.
All genes with measurable expression (reads>20) in the studied samples are shown. Normal-ized read counts are shown for the two replicates of resting and stimulated CD4+T cells. (PDF)
S4 Table. Mapped read counts in each sample in the target region from four RNA seq sam-ples, as described in Methods.
(GZ)
Acknowledgments
We thank all the T1D and MS patients and control subjects for participating in this study. We thank the members of each disease consortium who initiated and sustained the cross-disease ImmunoChip Project; Jeffrey Barrett for assistance with ImmunoChip SNP selection and for ImmunoChip related correspondence; Jennifer Stone for co-ordinating the ImmunoChip de-sign and production at Illumina; Lorna Witty at the Wellcome Trust Centre for Human Genet-ics, Oxford for help in optimising cDNA library prep protocols and for performing the RNA sequencing. We thank the International Multiple Sclerosis Genetics Consortium (IMSGC) for sharing their ImmunoChip data. We thank David Dunger, Barry Widmer, and the British Soci-ety for Paediatric Endocrinology and Diabetes for the TID case collection.
We acknowledge use of DNA and RNA samples from the National Institute for Health Re-search (NIHR) Cambridge BioResource. We thank volunteers for their support and participa-tion in the Cambridge BioResource and members of the Cambridge BioResource Scientific Advisory Board and Management Committee for their support of our study. Access to Cam-bridge BioResource volunteers and their data and samples is governed by the CamCam-bridge BioR-esource SAB. Documents describing access arrangements and contact details are available at http://www.cambridgebioresource.org.uk/.
Author Contributions
Conceived and designed the experiments: CW SR JAT LWS. Performed the experiments: CW MLP RCF AJC. Analyzed the data: CW AJC NP MLP OSB JDC ARG SR JAT. Contributed re-agents/materials/analysis tools: SSR SOG SJS MB. Wrote the paper: CW AJC ARG SR JAT LSW. Genotyping: DJS. Prepared data: JDC HG NMW.
References
1. Thurman RE, Rynes E, Humbert R, Vierstra J, Maurano MT, et al. (2012) The accessible chromatin landscape of the human genome. Nature 489: 75–82. doi:10.1038/nature11232PMID:22955617 2. McCarthy MI, Hirschhorn JN (2008) Genome-wide association studies: potential next steps on a
genet-ic journey. Hum Mol Genet 17: R156–R165. doi:10.1093/hmg/ddn289PMID:18852205
4. Wellcome Trust Case Control Consortium, Maller JB, McVean G, Byrnes J, Vukcevic D, et al. (2012) Bayesian refinement of association signals for 14 loci in 3 common diseases. Nat Genet 44: 1294– 1301. doi:10.1038/ng.2435PMID:23104008
5. Pickrell JK (2014) Joint analysis of functional genomic data and genome-wide association studies of 18 human traits. Am J Hum Genet 94: 559–573. doi:10.1016/j.ajhg.2014.03.004PMID:24702953 6. Giambartolomei C, Vukcevic D, Schadt EE, Franke L, Hingorani AD, et al. (2014) Bayesian test for
colocalisation between pairs of genetic association studies using summary statistics. PLoS Genet 10: e1004383. doi:10.1371/journal.pgen.1004383PMID:24830394
7. International Multiple Sclerosis Genetics Consortium (IMSGC) (2013) Analysis of immune-related loci identifies 48 new susceptibility variants for multiple sclerosis. Nat Genet 45: 1353–1360. doi:10.1038/ ng.2770PMID:24076602
8. Trynka G, Hunt KA, Bockett NA, Romanos J, Mistry V, et al. (2011) Dense genotyping identifies and lo-calizes multiple common and rare variant association signals in celiac disease. Nat Genet 43: 1193– 1201. doi:10.1038/ng.998PMID:22057235
9. Eyre S, Bowes J, Diogo D, Lee A, Barton A, et al. (2012) High-density genetic mapping identifies new susceptibility loci for rheumatoid arthritis. Nat Genet 44: 1336–1340. doi:10.1038/ng.2462PMID: 23143596
10. Hinks A, Cobb J, Marion MC, Prahalad S, Sudman M, et al. (2013) Dense genotyping of immune-relat-ed disease regions identifies 14 new susceptibility loci for juvenile idiopathic arthritis. Nat Genet 45: 664–669. doi:10.1038/ng.2614PMID:23603761
11. Servin B, Stephens M (2007) Imputation-based analysis of association studies: candidate regions and quantitative traits. PLoS Genet 3: e114. doi:10.1371/journal.pgen.0030114PMID:17676998 12. Bottolo L, Richardson S (2010) Evolutionary stochastic search for bayesian model exploration.
Bayes-ian Analysis 5: 583–618. doi:10.1214/10-BA523
13. Bottolo L, Chadeau-Hyam M, Hastie DI, Zeller T, Liquet B, et al. (2013) GUESS-ing polygenic associa-tions with multiple phenotypes using a GPU-based evolutionary stochastic search algorithm. PLoS Genet 9: e1003657. doi:10.1371/journal.pgen.1003657PMID:23950726
14. Malek TR, Castro I (2010) Interleukin-2 receptor signaling: at the interface between tolerance and im-munity. Immunity 33: 153–165. doi:10.1016/j.immuni.2010.08.004PMID:20732639
15. Vella A, Cooper JD, Lowe CE, Walker N, Nutland S, et al. (2005) Localization of a type 1 diabetes locus in theIL2RA/CD25feng region by use of tag single-nucleotide polymorphisms. Am J Hum Genet 76: 773–779. doi:10.1086/429843PMID:15776395
16. International Multiple Sclerosis Genetics Consortium (IMSGC) (2007) Risk alleles for multiple sclerosis identified by a genomewide study. N Engl J Med 357: 851–862. doi:10.1056/NEJMoa073493PMID: 17660530
17. Barton A, Thomson W, Ke X, Eyre S, Hinks A, et al. (2008) Rheumatoid arthritis susceptibility loci at chromosomes 10p15, 12q13 and 22q13. Nat Genet 40: 1156–1159. doi:10.1038/ng.218PMID: 18794857
18. Lowe CE, Cooper JD, Brusko T, Walker NM, Smyth DJ, et al. (2007) Large-scale genetic fine mapping and genotype-phenotype associations implicate polymorphism in theIL2RAregion in type 1 diabetes. Nat Genet 39: 1074–1082. doi:10.1038/ng2102PMID:17676041
19. Dendrou CA, Plagnol V, Fung E, Yang JHM, Downes K, et al. (2009) Cell-specific protein phenotypes for the autoimmune locusIL2RAusing a genotype-selectable human bioresource. Nat Genet 41: 1011–1015. doi:10.1038/ng.434PMID:19701192
20. Orrù V, Steri M, Sole G, Sidore C, Virdis F, et al. (2013) Genetic variants regulating immune cell levels in health and disease. Cell 155: 242–256. doi:10.1016/j.cell.2013.08.041PMID:24074872
21. Ye CJ, Feng T, Kwon HK, Raj T, Wilson MT, et al. (2014) Intersection of population variation and auto-immunity genetics in human T cell activation. Science 345: 1254665. doi:10.1126/science.1254665 PMID:25214635
22. Garg G, Tyler JR, Yang JHM, Cutler AJ, Downes K, et al. (2012) Type 1 diabetes-associatedIL2RA var-iation lowers IL-2 signaling and contributes to diminished CD4+CD25+regulatory T cell function. J Immunol 188: 4644–4653. doi:10.4049/jimmunol.1100272PMID:22461703
23. Onengut-Gumuscu S, Chen WM, Burren O, Cooper NJ, Quinlan AR, et al. (in press) Fine mapping of type 1 diabetes susceptibility loci and evidence for colocalization of causal variants with lymphoid gene enhancers. Nat Genet.
25. Mousavi K, Zare H, Dell’orso S, Grontved L, Gutierrez-Cruz G, et al. (2013) eRNAs promote transcrip-tion by establishing chromatin accessibility at defined genomic loci. Mol Cell 51: 606–617. doi:10. 1016/j.molcel.2013.07.022PMID:23993744
26. Maier LM, Lowe CE, Cooper J, Downes K, Anderson DE, et al. (2009)IL2RAgenetic heterogeneity in multiple sclerosis and type 1 diabetes susceptibility and soluble interleukin-2 receptor production. PLoS Genet 5: e1000322. doi:10.1371/journal.pgen.1000322PMID:19119414
27. Cerosaletti K, Schneider A, Schwedhelm K, Frank I, Tatum M, et al. (2013) Multiple autoimmune-asso-ciated variants confer decreased IL-2R signaling in CD4+CD25(hi)T cells of type 1 diabetic and multiple
sclerosis patients. PLoS One 8: e83811. doi:10.1371/journal.pone.0083811PMID:24376757 28. Dendrou CA, Wicker LS (2008) The IL-2/CD25 pathway determines susceptibility to T1D in humans
and NOD mice. J Clin Immunol 28: 685–696. doi:10.1007/s10875-008-9237-9PMID:18780166 29. Yang Z, Fujii H, Mohan SV, Goronzy JJ, Weyand CM (2013) Phosphofructokinase deficiency impairs
ATP generation, autophagy, and redox balance in rheumatoid arthritis T cells. J Exp Med 210: 2119– 2134. doi:10.1084/jem.20130252PMID:24043759
30. Arden C, Hampson LJ, Huang GC, Shaw JAM, Aldibbiat A, et al. (2008) A role for PFK-2/FBPase-2, as distinct from fructose 2,6-bisphosphate, in regulation of insulin secretion in pancreatic beta-cells. Bio-chem J 411: 41–51. doi:10.1042/BJ20070962PMID:18039179
31. Davison LJ, Wallace C, Cooper JD, Cope NF, Wilson NK, et al. (2012) Long-range dna looping and gene expression analyses identifyDEXIas an autoimmune disease candidate gene. Hum Mol Genet 21: 322–333. doi:10.1093/hmg/ddr468PMID:21989056
32. Carbonetto P, Stephens M (2013) Integrated enrichment analysis of variants and pathways in genome-wide association studies indicates central role for IL-2 signaling genes in type 1 diabetes, and cytokine signaling genes in Crohn’s disease. PLoS Genet 9: e1003770. doi:10.1371/journal.pgen.1003770 PMID:24098138
33. Hoggart CJ, Whittaker JC, De Iorio M, Balding DJ (2008) Simultaneous analysis of all SNPs in ge-nome-wide and re-sequencing association studies. PLoS Genet 4: e1000130. doi:10.1371/journal. pgen.1000130PMID:18654633
34. Wu TT, Chen YF, Hastie T, Sobel E, Lange K (2009) Genome-wide association analysis by lasso pe-nalized logistic regression. Bioinformatics 25: 714–721. doi:10.1093/bioinformatics/btp041PMID: 19176549
35. Ayers KL, Cordell HJ (2010) SNP selection in genome-wide and candidate gene studies via penalized logistic regression. Genet Epidemiol 34: 879–891. doi:10.1002/gepi.20543PMID:21104890 36. Guan Y, Stephens M (2011) Bayesian variable selection regression for genome-wide association
stud-ies and other large-scale problems. Ann Appl Stat 5: 1780–1815. doi:10.1214/11-AOAS455 37. Leng C, Lin Y, Wahba G (2006) A note on the lasso and related procedures in model selection. Stat
Sin.
38. Zhao P, Yu B (2006) On model selection consistency of lasso. J Mach Learn Res 7: 2541–2563. 39. Zou H, Hastie T (2005) Regularization and variable selection via the elastic net. J R Statist Soc B 67:
301–320. doi:10.1111/j.1467-9868.2005.00503.x
40. Yuan M, Lin Y (2006) Model selection and estimation in regression with grouped variables. J R Stat Soc Series B Stat Methodol 68: 49–67. doi:10.1111/j.1467-9868.2005.00532.x
41. Xiong HY, Alipanahi B, Lee LJ, Bretschneider H, Merico D, et al. (2015) RNA splicing. the human splic-ing code reveals new insights into the genetic determinants of disease. Science 347: 1254806. 42. Chen H, Wilkins LM, Aziz N, Cannings C, Wyllie DH, et al. (2006) Single nucleotide polymorphisms in
the human interleukin-1b gene affect transcription according to haplotype context. Hum Mol Genet 15: 519–529. doi:10.1093/hmg/ddi469PMID:16399797
43. Lewontin RC (1964) The interaction of selection and linkage. i. general considerations; heterotic mod-els. Genetics 49: 49–67. PMID:17248194
44. Chapman JM, Cooper JD, Todd JA, Clayton DG (2003) Detecting disease associations due to linkage disequilibrium using haplotype tags: A class of tests and the determinants of statistical power. Hum Hered 56: 18–31. doi:10.1159/000073729PMID:14614235
45. Morris AP (2006) A flexible bayesian framework for modeling haplotype association with disease, allow-ing for dominance effects of the underlyallow-ing causative variants. Am J Hum Genet 79: 679–694. doi:10. 1086/508264PMID:16960804
47. Wood AR, Tuke MA, Nalls MA, Hernandez DG, Bandinelli S, et al. (2014) Another explanation for ap-parent epistasis. Nature 514: E3–5. doi:10.1038/nature13691PMID:25279928
48. Downes K, Pekalski M, Angus KL, Hardy M, Nutland S, et al. (2010) Reduced expression of IFIH1 is protective for type 1 diabetes. PLoS ONE 5: e12646. doi:10.1371/journal.pone.0012646PMID: 20844740
49. Bottolo L, Petretto E, Blankenberg S, Cambien F, Cook SA, et al. (2011) Bayesian detection of expres-sion quantitative trait loci hot spots. Genetics 189: 1449–1459. doi:10.1534/genetics.111.131425 PMID:21926303
50. Okada Y, Wu D, Trynka G, Raj T, Terao C, et al. (2014) Genetics of rheumatoid arthritis contributes to biology and drug discovery. Nature 506: 376–381. doi:10.1038/nature12873PMID:24390342 51. Howie BN, Donnelly P, Marchini J (2009) A flexible and accurate genotype imputation method for the
next generation of genome-wide association studies. PLoS Genet 5: e1000529. doi:10.1371/journal. pgen.1000529PMID:19543373
52. Liquet B, Bottolo L, Campanella G, Richardson S, Chadeau-Hyam M (in press) R2GUESS: GPU-based R package for Bayesian variable selection regression of multivariate responses. J Stat Softw. 53. Tibshirani R (1996) Optimal reinsertion:regression shrinkage and selection via the lasso. J R Statist
Soc B 58: 267–288.
54. Friedman JH, Hastie T, Tibshirani R (2010) Regularization paths for generalized linear models via coor-dinate descent. Journal of Statistical Software 33: 1–22. PMID:20808728
55. Yang Y, Zou H (2014) A fast unified algorithm for solving group-lasso penalize learning problems. Stat Comput: 1–13. doi:10.1080/00949655.2014.975226
56. Pekalski ML, Ferreira RC, Coulson RMR, Cutler AJ, Guo H, et al. (2013) Postthymic expansion in human CD4 naive T cells defined by expression of functional high-affinity IL-2 receptors. J Immunol 190: 2554–2566. doi:10.4049/jimmunol.1202914PMID:23418630
57. Romanoski CE, Glass CK, Stunnenberg HG, Wilson L, Almouzni G (2015) Epigenomics: Roadmap for regulation. Nature 518: 314–316. doi:10.1038/518314aPMID:25693562
58. Anders S, Pyl PT, Huber W (2014) HTSeq—a Python framework to work with high-throughput sequenc-ing data. bioRxiv: 10.1101/002824.
59. Dobin A, Davis CA, Schlesinger F, Drenkow J, Zaleski C, et al. (2013) STAR: ultrafast universal RNA-seq aligner. Bioinformatics 29: 15–21. doi:10.1093/bioinformatics/bts635PMID:23104886 60. Li H, Handsaker B, Wysoker A, Fennell T, Ruan J, et al. (2009) The sequence alignment/map format
and SAMtools. Bioinformatics 25: 2078–2079. doi:10.1093/bioinformatics/btp352PMID:19505943 61. Love MI, Huber W, Anders S (2014) Moderated estimation of fold change and dispersion for RNA-Seq