ISSN 1549-3636
© 2010 Science Publications
Corresponding Author: Chabane Boubakir, Lamel Laboratory, Department of Electronic, Jijel University, BP 98, Ouled Aissa, JIJEL, Algeria
700
Speech Enhancement Using Minimum Mean-Square Error Amplitude Estimators
Under Normal and Generalized Gamma Distribution
1,2
Chabane Boubakir and
2Daoud Berkani
1Lamel Laboratory, Department of Electronic, Jijel University,
BP 98, Ouled Aissa, JIJEL, Algeria
2
Departments of Signal and Communications, National Polytechnic School,
10 Avenue Hassen Badi, BP 182, El-Harrach, 16200, Algeria
Abstract: Problem statement: In this study, DFT-based speech enhancement via Minimum Mean-Square Error (MMSE) amplitude estimators was considered. Approach: Several variants of the basic approach (MMSE-STSA) have been proposed over the years to address certain shortcomings, chiefly the quality of the remnant noise and its trade-off with speech distortion. In this study, we presented a comparative study between the MMLSA and the estimators based on the Gamma model, followed by an implementation in Matlab of these algorithms and an objective evaluation using a corpus of speech. Results: We obtained the best values of various parameters used by different estimators.
Conclusion: Objective evaluation confirm superiority in noise suppression and quality of the enhanced speech by the estimators derived under the generalized Gamma distribution than the estimators derived under the normal distribution, in stationary environments.
Key words: Speech enhancement, DFT-based speech enhancement, MMSE estimators, Gamma
distribution
INTRODUCTION
The interest in the field of speech enhancement emerges from the increased usage of digital speech processing applications like mobile telephony, digital hearing aids and human-machine communication systems in our daily life. The trend to make these applications mobile increases the variety of potential sources for quality degradation. Speech enhancement methods can be used to increase the quality of these speech processing devices and make them more robust under noisy conditions. The large group of speech enhancement methods meant to improve certain quality aspects of these devices. In this study we will focus on single-microphone additive noise reduction and aim at methods that study in the Discrete Fourier Transform (DFT) domain.
The traditional hypothesis for speech enhancement in the DFT domain is that the distribution of the complex speech DFT coefficients is Gaussian (Ephraim and Malah, 1984; 1985). Therefore, the spectral amplitude distribution is modeled by a Rayleigh distribution. Actually, super-Gaussian models of the
DFT coefficients are used, because they lead to estimators with improved performance than those based on a Gaussian model. Martin (2005) derived complex-DFT estimators under Laplacian and Gamma speech assumptions. Lotter and Vary (2005) proposed a MAP amplitude estimator for a generalized Gamma amplitude distribution.
MMSE estimators of the complex DFT coefficients, assuming a two-sided generalized Gamma distribution, have been derived in (Jensen et al., 2006). MMSE estimators for the amplitudes, assuming a one-sided generalized Gamma distribution, are treated in (Andrianakis and White, 2006) and (Hendriks et al., 2006). For all these estimators, the decision-directed method is commonly used (Ephraim and Malah, 1984).
MATERIALS AND METHODS
MMSE spectral estimation:
Modeling noise DFT magnitudes and assumptions:
Assume that we observe a noisy speech signal y(t) that is a sum of a speech and noise signal x(t) and d(t), which are uncorrelated. Their representation in the Short Time Fourier Transform (STFT) domain is given by:
Y(k,l)=X(k, l)+D(k,l) (1)
where, Y(k, 1) and D(k, 1) are the samples of the noisy speech, the clean speech and the noise signal’s STFT correspondingly. The index k corresponds to the frequency bins and the index l to the time frames of the STFT. Since DFT coefficients from different time frames and frequency indices are assumed to be independent, the indices k and l will be omitted for simplicity. We can write X = AejΦ and Y = AejΦ, where random variables A and R represent the clean and noisy amplitude and Φ and Θ the corresponding phases values.
In this study we focus on MMSE estimation of the clean amplitude A. The MMSE estimate of A is the expectation of the clean amplitude conditional on the noisy amplitude r(E{A/r}). With Bayes formula we can express the MMSE estimate as:
{ }
( ) ( )
( ) ( )
R A A
0
R A A
0
af r a f a da ˆ
A E A r
f r a f a da
∞
∞
= =
∫
∫
(2)
The estimation of the clean amplitude A requires some assumptions about the distribution of the speech and the noise. The speech has usually been assumed Gaussian, e.g., (Ephraim and Malah, 1984; 1985), but in recent times estimators based on super-Gaussian speech assumptions such as Laplacian or Gamma distributions have been derived (Lotter and Vary, 2004). A similar development has been seen for the noise assumptions; most commonly the noise is assumed Gaussian, but estimators exist which suppose the noise to obey a super-Gaussian distribution (Lotter and Vary, 2004).
With the zero-mean Gaussian distribution assumption of the noise DFT coefficients, fR/A(r/a) can
be written as (McAulay and Malpass, 1980):
( )
2 2R A 2 2 0 2
D D D
2r r a 2ar
f r a = exp− + I
σ σ σ (3)
Where:
Io = The 0th order modified Bessel function
of the first kind
{ }
22 D E D
σ = = The noise spectral variance
Gaussian based short-time spectral amplitude estimator: In this case, the DFT coefficients of both the speech and the noise are assumed to be an independent Gaussian random variables. Moreover, the speech signal might not be present at all times and at all frequencies. We therefore consider a two following hypotheses Hk0and
k 1
H :
k 0
H = Speech absent in kth DFT bin, Yk=Dk
k 1
H = Speech present in kth DFT bin, Yk=Xk+Dk
Hence, the probability density function can be given as:
(
k)
( )
( )
k2k 0
d d
Y 1
P Y / H exp
k k
−
=
πλ λ (4)
(
k)
(
( )
( )
)
( )
k2( )
1k
x d x d
Y 1
P Y / H exp
k k k k
−
=
π λ + λ λ + λ (5)
where,
( )
{
2 k}
x k E Xk / H1λ = and λd
( )
k =E D{ }
k2 arethe variance of the spectral component of speech and noise.
Let Ck be some function of the short-time spectral
amplitude Ak of the clean speech in the kth bin (e.g.,
2
k k k
A , log A , A ). The MMSE estimator Cˆkof Ckis
given by (McAulay and Malpass, 1980):
{
} (
)
{
} (
)
k
k
k k
1 1
k k k
k k
0 0
k k
C E C / Y , H P H / Y E C / Y , H P H / Y
= +
(6)
where,
{ }
and P . / .( )
denote conditional expectations and conditional probabilities, respectively.Since
{
k}
0 k k
E C / Y , H =0, we have:
{
}
(
k)
k 1
k 1
k k k
C =E C / Y , H P H / Y (7)
Thus, GMM
( )
k =P H / Y(
1k k)
is the702 Based on the results reported in (Ephraim and Malah, 1985; Malah et al., 1999), the Multiplicatively-Modified Log-Spectral Amplitude (MM-LSA) estimator (corresponding to Ck = logAk) outperformed
the traditional MMSE-STSA estimator (Ephraim and Malah, 1984) with and without incorporating speech presence uncertainty indicated as MMSE-SPU and MMSE respectively (Ck = Ak).
The MM-LSA estimator is (Malah et al., 1999):
( )
( )
MM
MMLSA LSA k
ˆ
A =G k G k R (8)
Under the Gaussian assumptions on the speech and noise, the gain function GLSA(k) is derived in (Ephraim
and Malah, 1985) to be:
(
)
kk k k t LSA k 1 e
G , exp dt
1 2 t
∞
ν −
ξ
ξ γ =
+ ξ
∫
(9)Where:
{ }
{ }
{ }
k k k k 2 k k 2 k k k k 2 k k 2 k 1 R E D 1 q E X E D ξ ν = γ+ ξ γ = η ξ = − η =
with ηk is called the a priori SNR, γk is the a posteriori
SNR and qk is the a prior probability of speech absence
in the k-th bin.
The gain modification GMM(k) is the soft-decision
modification of the optimal estimator under the signal presence hypothesis and is given by (Ephraim and Malah, 1984; Malah et al., 1999):
( )
( )
( )
MM k G k 1 k Λ =+ Λ (10)
where the likelihood ratio Λ(k) is defined as:
( )
( )
( )
1k(
(
k 1k)
)
(
k)
(
(
k 1k)
)
k k k
k
0 k 0 k 0
P H P Y / H 1 q P Y / H
k . .
q
P H P Y / H P Y / H
−
Λ = =
and, qk denotes the a priori probability of speech
absence in the kth bin. By using 4 and 5, we get:
( ) (
)
( )
( )
k k
k k k k/ 1 qk
1 q exp k
q 1 ξ =η −
− ν
Λ =
+ ξ (11)
Gamma based short-time spectral amplitude estimator.
In the Gamma based MMSE estimators of the speech DFT magnitudes; we assume that the speech DFT magnitudes are distributed according to a one-sided generalized Gamma prior density of the form:
A
1
f (a) a exp( a ), a 0 ( )
ν
γν− γ
γβ
= −β ≥
Γ ν (12)
where Γ is the Gamma function and the random variable A represents the DFT magnitudes, with the constraints on the parameters β>0, γ>0, ν>0.
The Gamma based MMSE amplitude estimators for the cases γ = 1 and γ = 2 have been derived in (Andrianakis and White, 2006; Hendriks et al., 2006; Erkelens et al., 2007). We will use the case γ = 2, as the related estimator can be derived without any approximations and the maximum achievable performance for both cases is about the same.
Inserting Eq. 12 with γ = 2 and Eq. 3 into 2 gives: 2 2 2 0 2 2 D D (2) 0 2
2 1 2
0
2 2
D D
0
a 2ar
a exp a I da
ˆ A
a 2ar
a exp a I da
∞ ν
∞ ν−
− − β
σ σ
=
− − β
σ σ
∫
∫
(13)where, the superscript (2) indicates that the parameter γ = 2. Using (Gradshteyn and Ryzhik, 2000), the integrals can be solved for ν>0. After inserting the relation between β and the second moment
{ }
, which for this case is 2X
β = ν σ , with 2
{ }
X2 k
E X
σ = , the
estimator is (Hendriks et al., 2006):
( )
(
)
( )
kk( )
( )
k k2 ( ,0)
k ( O.5,0) M Q 0.5 Q ˆ A r M Q −ν −ν+
Γ ν + =
Γ ν γ (14)
where, Qk= γ ηk k/ (ν + ηk), Mν µ, is recognized as the
Whittaker function, or in terms of confluent hypergeometric function 1 1F a; b; x
(
)
(Gradshteyn and Ryzhik, 2000):( )
(
)
( )
(
)
(
)
2 k 1 1 k
k
k 1 1 k
Γ ν+ 0.5 Q F ν+ 0.5;1; Q
A = r
γ
The special case ν = 1 is the traditional MMSE-STSA estimator derived in (Ephraim and Malah, 1984).
The decision-directed estimator of the a priori SNR:
In order to evaluate the above gain functions, we must
first estimate the noise power
spectrumλd
( )
k =E D{ }
k2 . This is often done duringperiods of speech absence as determined by a Voice Activity Detector (VAD), by using a noise-estimation algorithm like the minimum statistics approach (Martin, 1994; 2001), or by using a real noise in comparative studies.
The a posteriori SNR estimator γk is the ratio of the
squared input amplitude 2 k
R and the estimated noise spectrum.
In (Ephraim and Malah, 1984; 1985; Cape, 1994), a decision-directed approach for the a priori SNR estimation is proposed:
( )
2(
(
) (
)
) ( )
k min
d
ˆ A k, l 1
ˆ l max 1 k,l 1 ,
k,l 1
−
η = α + − α γ − η
λ −
(16)
where the smoothing factor 0≤α≤1, a value of α = 0.98 was used in the implementation and the lower limit ηmin
recommended by (Cape, 1994), is the same to the use of the spectral floor in the basic spectral subtraction method (Berouti et al., 1979). A lower limit of at least-15 dB is recommended.
Implementation and performance evaluation: For the experiment, the Noizeus database (Hu and Loizou, 2007) was used which consists of 30 IRS-filtered speech signals sampled at 8 kHz, contaminated by various additive noise sources. The frame size is 256 samples, with an overlap of 50%. The data window used was a Hanning window. The enhanced signal was combined using the overlap and add approach. The a priori probability of speech absence, qk, was set to
qk = 0.3 in (7). The noise variance was estimated from
0.64 seconds of noise only, preceding speech activity. Matlab implementations available from, (Borrowes, 2003) have been used to evaluate the confluent hypergeometric functions.
To measure quality of the enhanced signal, we have used the segmental SNR, the Log-Likelihood Ratio measure (LLR) (Hansen and Pellom, 1998) and the Perceptual Evaluation of Speech Quality (PESQ) (Rix et al., 2001). All the measures show high correlation with subjective quality.
The LLR measure for each 20-ms speech frame is given by:
(
)
T d j d ,
LLR d j T
j j j
a R a d a a = log
a R a
(17)
Where:
aφ and ad = The Linear Prediction (LP) coefficient vectors for the clean and processed speech frame respectively
Rφ = The autocorrelation of the clean speech
frame
LLR = A spectral distance measure which mainly models the mismatch between the formants of the original and enhanced signals
The mean LLR value was obtained by averaging the individual frame LLR values across the sentence. The highest 5% of the LLR measures values were discarded, as suggested in (Hansen and Pellom, 1998), to exclude unrealistically high spectral distance values. The lower LLR measures for an enhanced speech, the better are its perceived quality.
Since the correlation of SNR with subjective quality is so poor. Instead, we choose the frame-based segmental SNR by averaging frame level SNR estimates and is defined by (Hansen and Pellom, 1998):
( )
( )
( )
Nm N 12 M 1
t Nm
seg 10 Nm N 1 2
m 0
d t Nm
s n 10
SNR log
M
s n s n
+ − φ −
= + − =
φ =
=
−
∑
∑
∑
(18)where, M denotes the number of frames. The lower and upper thresholds are selected to be -10 dB and +35 dB, respectively.
The perceptual evaluation of speech quality (Rix et al., 2001), predicts the subjective quality of speech signals with high correlation between subjective and objective results and expresses the quality in a score from 1.0 (worst) up to 4.5 (best).
RESULTS AND DISCUSSION
We evaluate the two estimators (MM-LSA and the Gamma based estimator). For a proper choice of ν, we evaluated the estimator for a wide range of values between 0.01 and 2.5. Figure 1 and 2 shows plots of SNR segmental and PESQ versus for γ = 2, at 0 and 5 dB SNR, in the case of white noise and babble noise, respectively.
704 Fig. 1: SNR segmental and PESQ performance
Fig. 2: SNR segmental and PESQ performance versus ν for Babble noise
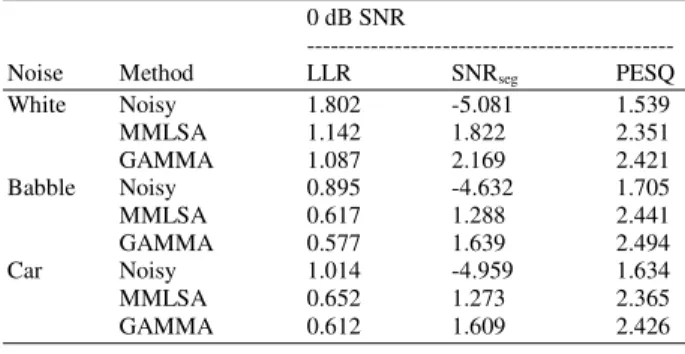
The quality of speech enhanced by the Gamma estimator was compared against the quality of speech produced by the other MMSE STSA estimators. Table 1 and 2 summarize the objective results for noisy speech, for enhanced speech with MM-LSA estimator and for enhanced speech with Gamma based estimator.
From the results in Table 1 and 2, it can be seen that the Gamma based estimator had higher preference scores compared to the MM-LSA estimator for all noise at 0 and 5dB SNR. Further, the enhanced speech from the Gamma estimator sounds less musical than that obtained from the other estimator. This was due to the fact that the Gamma priors fit better to measured speech DFT distributions than the Gaussian priors.
Table 1: Objective quality scores for various algorithms under white, babble and car noise, SNR = 5 dB
5 dB SNR
---
Noise Method LLR SNRseg PESQ
White Noisy 1.545 -2.327 1.799
MMLSA 0.945 4.204 2.706
GAMMA 0.891 4.609 2.775
Babble Noisy 0.715 -1.783 2.006
MMLSA 0.478 3.661 2.791
GAMMA 0.437 4.059 2.851
Car Noisy 0.795 -2.173 1.891
MMLSA 0.511 3.589 2.703
GAMMA 0.469 3.977 2.763
Table 2: Objective quality scores for various algorithms under white, babble and car noise, SNR = 0 dB
0 dB SNR
---
Noise Method LLR SNRseg PESQ
White Noisy 1.802 -5.081 1.539
MMLSA 1.142 1.822 2.351
GAMMA 1.087 2.169 2.421
Babble Noisy 0.895 -4.632 1.705
MMLSA 0.617 1.288 2.441
GAMMA 0.577 1.639 2.494
Car Noisy 1.014 -4.959 1.634
MMLSA 0.652 1.273 2.365
GAMMA 0.612 1.609 2.426
CONCLUSION
This study considered DFT based techniques for single channel speech enhancement. We show an increase in the quality of the enhanced speech with different noise types. Results, in terms of objective measures and listening test, indicated that the Gamma based estimator yielded better performance than the MM-LSA estimator based on a Gaussian model.
In the future, we plan to evaluate its possible application in preprocessing for new communication systems and hearing aid system.
REFERENCES
Andrianakis, I. and P.R. White, 2006. MMSE speech spectral amplitude estimators with chi and gamma speech priors. Proc. ICASSP, 3: 1068-1071. Berouti, M., R. Schwartz and J. Makhoul, 1979.
Enhancement of speech corrupted by acoustic noise. Proceeding of the ICASSP, Apr. 1979, Bolt Beranek and Newman Inc., Cambridge MA., pp: 208-211.
Borrowes, B., 2003. Matlab routines for computation of special functions.
http://ceta.mit.edu/ceta/comp_spec_func/
Ephraim, Y. and D. Malah, 1984. Speech enhancement using a minimum mean-square error short-time spectral amplitude estimator. IEEE Trans. Acous. Speech Signal Proc., 32: 1109-1121.
Ephraim, Y. and D. Malah, 1985. Speech enhancement using a minimum mean-square error log-spectral amplitude estimator. IEEE Trans. Acoust. Speech Signal Proc., 33: 443-445.
Erkelens, J.S., J. Jensen and R. Heusdens, 2007. Improved speech spectral variance estimation under the generalized gamma distribution. Proceeding of the SPS-DARTS, 3rd Annual IEEE Benelux/DSP Valley Signal Processing Symposium, (VSPS’07), IEEE, USA., pp: 43-46. Gradshteyn, I. and I. Ryzhik, 2000. Table of Integrals,
Series and Products. 6th Edn., ISBN: 0-12-294757-6, pp: 1163.
Hansen, J. and B. Pellom, 1998. An effective quality evaluation protocol for speech enhancement algorithm. Proceeding of the International Conference on Spoken Language Processing, Dec. 1998, Sydney, Australia, pp: 2819-2822. http://home.iitk.ac.in/~rhegde/ee627_2009/bhatti3. pdf
Hendriks, R.C., J.S. Erkelens, J. Jensen and R. Heusdens, 2006. Minimum mean-square error amplitude estimators for speech enhancement under the generalized gamma distribution. Proceeding of the IWAENC, Sept. 12-14, Paris, pp: 1-4. http://www.iwaenc.org/proceedings/2006/pdf/A35. pdf
Hu, Y. and P.C. Loizou, 2007. Subjective evaluation and comparison of speech enhancement algorithms. Speech Commun., 49: 588-601. http://www.utdallas.edu/~loizou/speech/noiseus/ Jensen, J., R.C. Hendriks, J.S. Erkelens and R. Heusdens,
2006. MMSE estimation of complex-valued discrete Fourier coefficients with generalized gamma priors. Proceeding of the Interspeech, Sept. 2006, pp: 257-260.
Lotter, T. and P. Vary, 2004. Noise reduction by joint maximum a posteriori spectral amplitude and phase estimation with super-Gaussian speech modeling. Proceeding of the 12th European Signal Processing Conference, (ESPC’04), Vienna, Austria, pp: 1457-1460. Lotter, T. and P. Vary, 2005. Speech enhancement by
map spectral amplitude estimation using a super-Gaussian speech model. EURASIP J. Applied Signal Proc., 2005: 1110-1126. DOI: 10.1155/ASP.2005.1110
Malah, D., R. Cox and A. Accardi, 1999. Tracking speech presence uncertainty to improve speech enhancement in non stationary noise environments. Proceeding of the IEEE International Conference on Acoustics, Speech and Signal Processing, Mar. 15-19, IEEE Xplore Press, Phoenix, Ariz, pp: 789-792. DOI: 10.1109/ICASSP.1999.759789 Martin, R., 1994. Spectral subtraction based on
minimum statistics. Proceeding of the European Signal Processing Conference (EUSIPCO’94), pp: 1182-1185.
Martin, R., 2001. Noise power spectral density estimation based on optimal smoothing and minimum statistics. IEEE Trans. Speech Audio Process., 9: 504 -512.
Martin, R., 2005. Speech enhancement based on minimum mean-square error estimation and super-Gaussian priors. IEEE Trans. Speech Audio
Process., 13: 845-856. DOI:
10.1109/TSA.2005.851927
McAulay, R.J. and M.L. Malpass, 1980. Speech enhancement using a soft-decision noise suppression filter. IEEE Trans. Acoust. Speech Signal Proc., 28: 137-145.
Rix, A., J. Beerends, M. Hollier and A. Hekstra, 2001. Perceptual Evaluation Of Speech Quality (PESQ)-a new method for speech quality assessment of telephone networks and codecs. Proc. IEEE
ICASP, 2: 749-752. DOI: