http://www.uem.br/acta ISSN printed: 1679-9275 ISSN on-line: 1807-8621
Doi: 10.4025/actasciagron.v36i1.17697
Scaling the number of plants per plot and number of plots per
genotype of yellow passion fruit plants
Lindolfo Storck¹*, Alessandro Dal’Col Lúcio2, Willian Krause3, Dejânia Vieira de Araújo3 and Celice Alexandre Silva3
1
Programa de Pós-graduação em Agronomia, Universidade Tecnológica Federal do Paraná, Via do Conhecimento, Km 1, 85503-390, Pato Branco, Paraná, Brazil. 2
Departamento de Fitotecnia, Universidade Federal de Santa Maria, Santa Maria, Rio Grande do Sul, Brazil. 3
Universidade do Estado de Mato Grosso, Tangará da Serra, Mato Grosso, Brazil. *Author for correspondence. E-mail: lindolfostorck@gmail.com
ABSTRACT. There is a demand for research on yellow passion fruit plants (Passiflora edulis Sims) used for juice production. Thus, the present study aimed to determine the number of plants per experimental plot and the number of plots per genotype for different properties of passion fruit. The data used were obtained from an experiment (Tangará da Serra, Mato Grosso State, Brazil) that assessed 13 fruit properties in eight genotypes of yellow passion fruit plants, with 10 replicates and 10 plants per plot. For each of the 80 experimental plots, the optimum plot size (Xo) was estimated by the method of maximum curvature of the coefficient of variation model. The number of replicates for each genotype and the means were estimated through the use of 10 plants per plot, combined with Xo plants per plot. The optimum plot size for the assessment of properties in yellow passion fruits independent of genotype is less than five plants, as the number of replicates is a function of the desired magnitude of accuracy. The number of plants per experiment is lower when using Xo plants per plot.
Keywords:Passiflora edulis Sims, yellow passion fruit, experimental design, accuracy.
Dimensionamento do número de plantas por parcela e do número de parcelas por
genótipo de maracujazeiro-amarelo
RESUMO. Existe demanda de pesquisa para o maracujazeiro-amarelo (Passiflora edulis Sims), usado para a produção de sucos. Assim, o objetivo foi dimensionar o número de plantas por parcela experimental e o número de parcelas por genótipo para diferentes caracteres de frutos de maracujá. Foram usados os dados de um experimento (Tangará da Serra, Estado do Mato Grosso) de avaliação de 13 caracteres de frutos em oito genótipos de maracujazeiro-amarelo, 10 repetições e 10 plantas por parcela. Para cada uma das 80 parcelas experimentais, foi estimado o tamanho ótimo de parcela (Xo) por meio do método da curvatura máxima do modelo do coeficiente de variação. Foi estimado o número de repetições, para cada genótipo e na média, mediante o uso das 10 plantas por parcela e, também, considerando o uso das Xo plantas por parcela. O tamanho ótimo da parcela, para avaliar caracteres em frutos de maracujá-amarelo, independe do genótipo e é menor do que cinco plantas. Para a maioria dos caracteres é preferível usar menos de cinco plantas por parcela, sendo o número de repetições uma função da magnitude de precisão desejada. O número de plantas por experimento é menor ao se usar Xo plantas por parcela.
Palavras-chave:Passiflora edulis Sims, maracujá-amarelo, planejamento experimental, precisão.
Introduction
The fruits of the yellow passion fruit plant (Passiflora edulis Sims) are used for juice production that is intended for both local consumption and export. However, the cultivation of this plant demands intense labor and is considered an agricultural activity that encourages settlement.
With a growing demand for passion fruit, there is an increasing need for research focused on its cultivation to optimize production material and service costs. Research on such factors the genetics (CROCHEMORE et al., 2003; FERREIRA et al.,
2010; GANGA et al., 2004; GONÇALVES et al., 2007; REIS et al., 2011), plant nutrition and pest control (JUNQUEIRA et al., 2003; PIRES et al., 2009) are suggested for the improvement of both the productivity and product quality. In these cases, the techniques of field trials are important tools for the reliability qualification of the results. Reliable research results are obtained when experiments are planned, executed and analyzed properly.
culture and property assessed. There are several methods to estimate the optimum plot size (HATHEWAY; WILLIAMS, 1958; KOCH; RIGNEY, 1951; LIN; BINNS, 1984; MEIER; LESSMAN, 1971). A recent method, called the method of maximum curvature of the coefficient of variation model, was proposed by Paranaíba et al. (2009). This method is more practical than several others and can be applied in trials with fewer basic units of data collection. Furthermore, the use of the resampling method for determining the number of replicates for a given accuracy (STORCK et al., 2012) is valid for any property, with different probability distributions.
The lack of information of the scale of yellow passion fruit experiments has led researchers (DINIZ et al., 2011; FERREIRA et al., 2010; FREITAS et al., 2011; KRAUSE et al., 2012; OLIVEIRA et al., 2011; ROSADO et al., 2012; SILVA et al., 2012) to use variable values, from two to four replicates and from three to ten plants per plot, which are not based on a pre-established error estimation. Therefore, unjustified variation in determining the plot size is observed, and thus the experimental accuracy may be inappropriate for the inferences presented in the reports, even with significant differences among the treatments.
The present study aimed to measure the number of plants per plot and the number of plots per genotype for different properties of yellow passion fruit plants.
Material and methods
Experimental data
The cultivation of passion fruit plants was conducted in the experimental field of the University of Mato Grosso (UNEMAT), located in the municipality of Tangará da Serra, Mato Grosso State, Brazil. The site is located on highway MT - 358, km 7, at 320 m elevation, 14º39' latitude and 57º25' longitude. The soil is classified as a clayey, dystrophic Red Latosol (EMBRAPA, 1999), and the soil relief is flat to gently rolling. The mean annual rainfall is 1,800 mm, with a dry season from May to September, and the region mean temperature is 24.4ºC (NIED et al., 2006; VELA, 2006). The conduction system was a vertical trellising, with a smooth wire at a height of two meters from the ground and a pole every six meters in each row. The spacing was three meters between rows and between plants in each row. The irrigation in the pits was performed using drippers.
The experiment consisted of eight passion fruit plant genotypes in randomized block design, with 10 replicates. The experimental plots consisted of 10
plants, with spacing of three meters between the plants and three meters between the rows.
The seeds were sown on May 22, 2010, and the seedlings were transplanted to the final pits on August 1, 2010. Fertilization was performed in the pit with 300 g gypsum, 300 g lime and 150 g monoammonium phosphate (MAP).
Among the different properties, we evaluated the number of days to flowering (DFlor), number of fruits per plant (NF), fruit weight per plant (FW, kg), mean weight per fruit (MWPF, kg), fruit mean diameter (FD, mm), fruit mean length (FL, mm), mean peel thickness (PT, mm), pulp percentage (PP), pulp color (PC; scale: 1 = yellow bleached, 2 = light yellow, 3 = yellow, 4 = gold, 5 = light orange and 6 = orange), total soluble solids (TSS, °Brix), citric acid pH (pH), acidity (CA, gram of citric acid per 100 mL of juice) and TSS/CA ratio. Five fruits from each plant were evaluated for the FL, FD, PT and PP properties. For the FW property, assessments were performed weekly for 12 months (from March 2011 to February 2012). The physical properties were evaluated in the laboratory from March to May of 2011, and the physico-chemical properties of PC, SST, pH and CA were also assessed in the laboratory from February to March of 2012 by removing a sample of approximately 50 mL of juice, with at least two fruits per sample at 70% maturity.
An analysis of variance was performed for each of the properties, with sampling in the experimental plot and a hypothesis test for the variation among the genotypes and plots. The software SAEG was used for this analysis (SAEG, 2007).
Determination of the number of plants per plot
For each of the 80 experimental plots (8 genotypes x 10 replicates) and for each of the 14 properties, using the results related to the 10 plants, the mean (m) and variance (s2) among the 10 plants were estimated. The first-order spatial autocorrelation coefficient (ˆ) was also estimated using the numbering sequence of the plants in the plot, as follows: DiXiX and
10
1 i
2 i 10
2
i DiDi1/ D
ˆ
, where, Xi is equal to the value of the property observed in the plant i. The optimal size of the plots (Xo, number of grouped plants) was estimated by the method of maximum curvature of the coefficient of variation model (MCCVM) by the expression
2 2
1/3m s ) ˆ 1 ( 2 ) m / 10 (
Xo (PARANAÍBA et al., 2009).
among the properties by the estimation method, the mean optimum plot size (Xo) was obtained from the mean of 2,000 resamples from 80 observations, that is, by bootstrap resampling (FERREIRA, 2009).
For each property, the determination of the number of experimental plots required to estimate Xo was performed by the resampling of the 80 Xo values (STORCK et al., 2012). Thus, by varying the k number = 2, 3, ..., 80 experimental plots, we generated J = 2,000 samples with replacement values (mean k plots) and calculated the mean for each resample. These 2,000 means, obtained with resamples of k = 2, 3, ..., 80 plots, were arranged to identify the quantile 0.025 (Q025(k)) and the quantile 0.975 (Q975(k)). The amplitude (Ampl(k)) of the bootstrap confidence interval with resamples of k size, with 5% error, is Ampl(k) = Q975(k) - Q025(k). The k value, which corresponds to an Ampl(k) equal to one (one plant = estimation error), is the sufficient number of plots, with a 5% probability of error.
Determination of the number of replicates per genotype
The appropriate number of replications for each genotype and for each property were estimated by considering an amplitude of the confidence interval at 95% (CI 95%) that was equivalent to 10% and 20% of the mean (D = 10% and D = 20%), with the use of 10 plants per plot and the use of Xo plants per plot.
Considering that, in general, the means of the different properties do not follow a known probability distribution or at least are not the same for all properties, we adopted the bootstrap resampling method as the standard (CONFALONIERI et al., 2007; EFRON, 1979; FERREIRA, 2009; STORCK et al., 2012) to estimate the number of replicates.
Initially, using the estimated means of 10 plants for each k = 2, 3, ..., 10 plots per genotype, we generated J = 2,000 samples with replacement values (mean k plots) and calculated the mean of each resample. These 2,000 means, obtained with resamples of k = 2, 3, ..., 10 plots, were arranged to identify the quantile 0.025 (Q025(k)) and the quantile 0.975 (Q975(k)). The amplitude (Ampl(k)) of the bootstrap confidence interval with resamples of size k, with a 5% error, is Ampl(k) = Q975(k) - Q025(k). The k value that corresponds to an Ampl(k) equal to the mean D% is the number of replicates sufficient for the accuracy established with a 5% probability of error.
Once the experiment has been scaled with the use of Xo plants per plot (with replacement), the
results of the means of each plot will depend on which plants will comprise each of the 10 plots of a given genotype. Therefore, the procedure to determine the number of replicates (k) for an Ampl(k) of 10% and 20% of the mean was repeated 10 times to obtain the mean k value.
To calculate the optimum plot size and the number of replicates per bootstrap simulation, a specific application developed in Pascal language was used.
Results and discussion
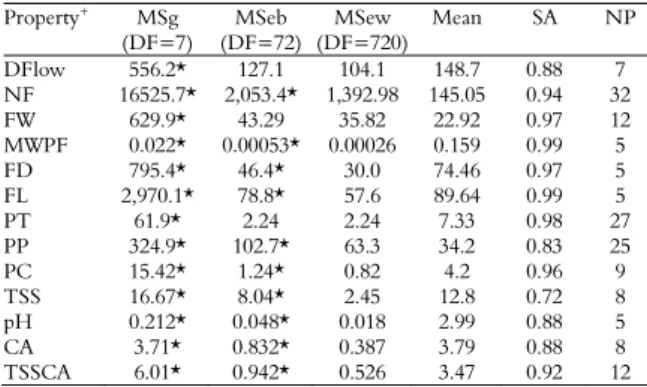
The variability among the genotypes was significant (p value < 0.05) for all properties (Table 1), and the selective accuracy (SA) was considered very high (SA > 0.90) for 8 of the 13 (61%) properties and high for the other five properties, according to the criteria of Resende and Duarte (2007). Thus, it can be concluded that the experiment had adequate accuracy for all of the properties evaluated. However, the variability between the experimental plots was also significant for 10 of the 13 properties. According to Barbin (2003), this occurrence recommends an increase in the number of replicates, possibly increasing the plot size. These are general considerations and are not based on establishing the magnitude of the estimation error with a given significance level, thus failing to meet the assumptions. Therefore, the most appropriate procedure is to establish the optimum plot size, an appropriate method and the number of replicates for this plot size, aiming at a pre-established estimation error according to the methodology used.
Table 1. Mean square of the genotype (MSg), mean square error between the plots (MSeb), mean square error within plots (MSew) and their degrees of freedom (DF), mean, selective accuracy (SA) and number of plots required (NP) to estimate the optimum plot size, with an estimation error equal to a plant (95% confidence level), for different properties of yellow passion fruit plants in Tangará da Serra, Mato Grosso State.
Property+ MSg
(DF=7) MSeb (DF=72)
MSew (DF=720)
Mean SA NP
DFlow 556.2* 127.1 104.1 148.7 0.88 7
NF 16525.7* 2,053.4* 1,392.98 145.05 0.94 32
FW 629.9* 43.29 35.82 22.92 0.97 12
MWPF 0.022* 0.00053* 0.00026 0.159 0.99 5
FD 795.4* 46.4* 30.0 74.46 0.97 5
FL 2,970.1* 78.8* 57.6 89.64 0.99 5
PT 61.9* 2.24 2.24 7.33 0.98 27
PP 324.9* 102.7* 63.3 34.2 0.83 25
PC 15.42* 1.24* 0.82 4.2 0.96 9
TSS 16.67* 8.04* 2.45 12.8 0.72 8
pH 0.212* 0.048* 0.018 2.99 0.88 5
CA 3.71* 0.832* 0.387 3.79 0.88 8
TSSCA 6.01* 0.942* 0.526 3.47 0.92 12
*significant by the F test at a 5% probability of error; +properties: Dflow - number of
For the 80 plots, the mean bootstrap for the optimum plot size (Xo) varied from one to five plants across the different properties (Tables 2 or 3). However, it is not necessary to use all 80 of the plots to estimate Xo with an estimation error equal to a plant. A subset of these plots (NP) can be used, as shown in Table 1. It was observed that 10 of the 13 evaluated properties (77%) was sufficient to estimate the Xo in less than 12 plots (15% of the experimental area) and that 25 to 32 plots are needed for the remaining properties. To conserve human and material resources, the possibility of partial data collection from an experimental area to estimate the optimum plot size has been reported (STORCK, 2011) for the culture of potato.
For the most important property of this study, the fruit weight per plant (FW), the optimum plot size (Xo) was equal to five plants, and it was necessary to evaluate the Xo value for only 12 of the experimental plots. Furthermore, through the
variance analysis of the Xo values in the 80 plots, no variation was found in relation to the genotypes or among the blocks. With this, the result of Xo can be generalized for different genotypes and environments of this culture, and the same behavior occurred for the other properties in this study.
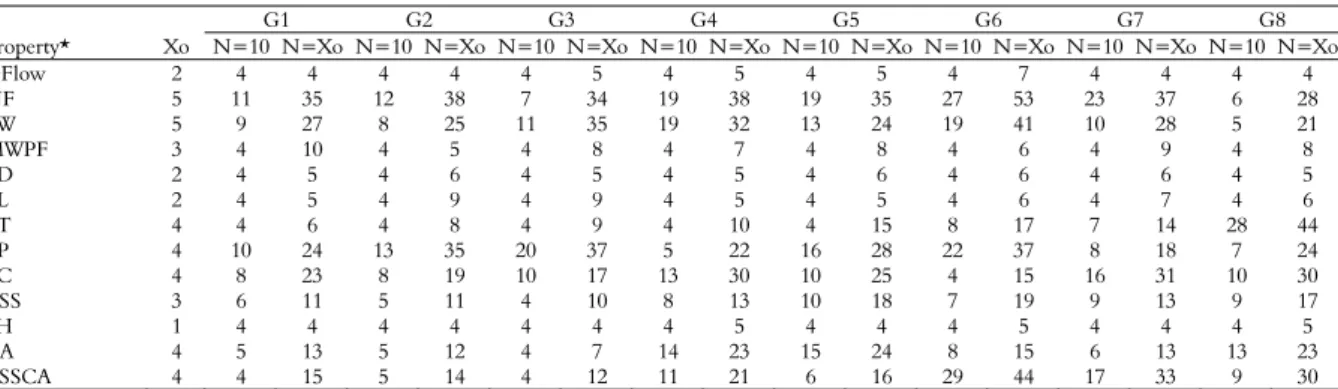
The number of replicates required for an estimation error (amplitude of the confidence interval at 95%) equal to 20% of the mean (D = 20%) is shown in Table 2 for the scenario in which the data for N = 10 plants per plot and for the scenario in which the data for N = Xo plants per plot were used. Using the data for 10 plants in each plot, the number of replicates of different genotypes varied from 3 to 5 for the FW property. However, when using N = Xo plants per plot, the number of replicates varied from 6 to 11. Thus, when reducing the plot size, a large number of replicates is necessary, and there should be an important offset to allow the resizing of the experimental design.
Table 2. Optimum plot size (Xo, number of plants) and number of replicates required for an amplitude of 20% of the mean, with N = 10 and N = Xo plants per plot, for different properties of eight genotypes (G1 to G8) of yellow passion fruit plants in Tangará da Serra, Mato Grosso State.
G1 G2 G3 G4 G5 G6 G7 G8
Property * Xo N=10 N=Xo N=10 N=Xo N=10 N=Xo N=10 N=Xo N=10 N=Xo N=10 N=Xo N=10 N=Xo N=10 N=Xo
DFlow 2 3 3 3 3 3 3 3 3 3 3 3 3 3 3 3 3
NF 5 3 9 3 10 3 9 6 10 5 10 7 15 6 10 3 7
FW 5 3 8 3 7 3 9 5 8 3 7 5 11 3 8 3 6
MWPF 3 3 3 3 3 3 3 3 3 3 3 3 3 3 3 3 3
FD 2 3 3 3 3 3 3 3 3 3 3 3 3 3 3 3 3
FL 2 3 3 3 3 3 3 3 3 3 3 3 3 3 3 3 3
PT 4 3 3 3 3 3 3 3 3 3 5 3 5 3 4 7 21
PP 4 3 7 4 9 6 10 3 6 4 7 6 11 3 5 3 6
PC 4 3 6 3 6 3 5 4 8 3 7 3 4 4 8 3 8
TSS 3 3 3 3 4 3 3 3 4 3 5 3 5 3 4 3 5
pH 1 3 3 3 3 3 3 3 3 3 3 3 3 3 3 3 3
CA 4 3 4 3 4 3 3 4 6 4 6 3 4 3 4 4 6
TSSCA 4 3 4 3 4 3 4 3 6 3 5 7 12 5 9 3 8
*properties: Dflow - number of days to flowering; NF - number of fruits per plant; FW - fruit weight per plant (kg); MWPF - mean weight per fruit (kg); FD - mean fruit diameter (mm); FL - mean fruit length (mm); PT - mean peel thickness (mm); PP - pulp percentage; PC - pulp color (scale: 1 = bad, ..., 5 = good); TSS - total soluble solids (°Brix); citric acid pH; CA - acidity; SSTCA - SST/CA ratio.
Table 3. Optimum plot size (Xo, number of plants) and number of replicates required for an amplitude of 10% of the mean, with N = 10 and N = Xo plants per plot, for different properties of eight genotypes (G1 to G8) of yellow passion fruit plants in Tangará da Serra, Mato Grosso State.
G1 G2 G3 G4 G5 G6 G7 G8
Property* Xo N=10 N=Xo N=10 N=Xo N=10 N=Xo N=10 N=Xo N=10 N=Xo N=10 N=Xo N=10 N=Xo N=10 N=Xo
DFlow 2 4 4 4 4 4 5 4 5 4 5 4 7 4 4 4 4
NF 5 11 35 12 38 7 34 19 38 19 35 27 53 23 37 6 28
FW 5 9 27 8 25 11 35 19 32 13 24 19 41 10 28 5 21
MWPF 3 4 10 4 5 4 8 4 7 4 8 4 6 4 9 4 8
FD 2 4 5 4 6 4 5 4 5 4 6 4 6 4 6 4 5
FL 2 4 5 4 9 4 9 4 5 4 5 4 6 4 7 4 6
PT 4 4 6 4 8 4 9 4 10 4 15 8 17 7 14 28 44
PP 4 10 24 13 35 20 37 5 22 16 28 22 37 8 18 7 24
PC 4 8 23 8 19 10 17 13 30 10 25 4 15 16 31 10 30
TSS 3 6 11 5 11 4 10 8 13 10 18 7 19 9 13 9 17
pH 1 4 4 4 4 4 4 4 5 4 4 4 5 4 4 4 5
CA 4 5 13 5 12 4 7 14 23 15 24 8 15 6 13 13 23
TSSCA 4 4 15 5 14 4 12 11 21 6 16 29 44 17 33 9 30
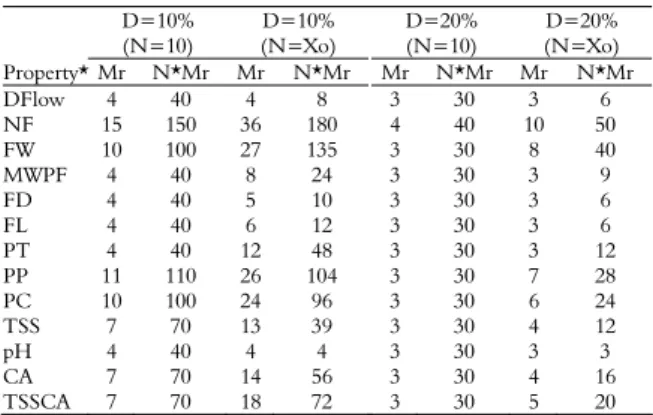
Using the mean (among the eight genotypes) of the replicate number (Mr) for the two scenarios (N = 10 and N = Xo), the number of plants per genotype can be estimated (N*Mr). Scenarios with fewer numbers of plants per genotype help to conserve labor and material while maintaining the same accuracy. Thus, for D = 20% (Table 4), the use of Xo plants is advantageous for the majority of properties (11/13 = 85%). However, for the scenario of D = 10% accuracy, this advantage was observed for 9 of the 13 properties (69%).
Table 4. Mean number of replicates (Mr) and number of plants (N*Mr) per genotype for different settings (accuracy of D=10% and 20% of mean) and yellow passion fruit properties.
D=10% (N=10)
D=10% (N=Xo)
D=20% (N=10)
D=20% (N=Xo)
Property* Mr N*Mr Mr N*Mr Mr N*Mr Mr N*Mr
DFlow 4 40 4 8 3 30 3 6
NF 15 150 36 180 4 40 10 50
FW 10 100 27 135 3 30 8 40
MWPF 4 40 8 24 3 30 3 9
FD 4 40 5 10 3 30 3 6
FL 4 40 6 12 3 30 3 6
PT 4 40 12 48 3 30 3 12
PP 11 110 26 104 3 30 7 28
PC 10 100 24 96 3 30 6 24
TSS 7 70 13 39 3 30 4 12
pH 4 40 4 4 3 30 3 3
CA 7 70 14 56 3 30 4 16
TSSCA 7 70 18 72 3 30 5 20
* properties: Dflor - number of days to flowering; NF - number of fruits per plant; FW - fruit weight per plant (kg); MWPF - mean weight per fruit (kg); FD - mean fruit diameter (mm) ; CF - mean fruit length (mm), PT - mean peel thickness (mm); PP - pulp percentage; PC - pulp color (scale: 1 = bad, ..., 5 = good); SST - total soluble solids (°Brix); citric acid pH; CA - acidity, SSTCA - SST/CA ratio.
The interpretation procedure for the different scenarios shows that the number of replicates depends on the plot size while maintaining a fixed estimation error (10 or 20% of the mean). This fact favors the possibility of scaling the experiment with respect to a predetermined accuracy. Taking into consideration that the results are independent of the probability distribution of the different properties in the analysis procedure adopted (resampling), the conclusions can be generalized.
According to the literature on the culture of passion fruit plants, there is great variability in defining the number of replicates and the size of the plot, and typical values are used by researchers due to a lack of specific research results. For example, Silva et al. (2012) evaluated 144 complete full-sib families in two replicates and three plants per plot. In an experiment of 111 full-sib families to estimate the gain selection, Krause et al. (2012) used four plants per plot and three replicates., and Rosado et al. (2012) used three replicates and plots of four plants to assess the production of 26 complete full-sib families. Oliveira et al. (2011) studied the correlation between the properties of 17 germplasm
accessions using plots of 10 plants and two replicates, and Freitas et al. (2011) evaluated 38 genotypes in four replicates and 10 plants, whereas three replicates of three plants were used for the evaluation of organic and mineral fertilizer (DINIZ et al., 2011). Therefore, unjustified variations in determining plot size were observed. Even with significance among the treatments, the experimental accuracy can be inappropriate for the inferences presented in such publications.
Establishing an accuracy of 10% (D = 10%) or an amplitude of 10% of the mean of a genotype is equivalent to establishing a semi-amplitude equal to 5% of the mean. Thus, the difference between the two mean genotype larger than 5% of the mean is significant. By establishing magnitudes of accuracy (D = 20% or D = 10%) in the present study, we are presented with feasible situations compared to the accuracy levels achieved in cereal culture (e.g., corn, soybeans, wheat).
Conclusion
To assess properties in yellow passion fruit independent of the genotype, the optimum plot size is less than five plants. However, it is preferable to use less than five plants per plot for most of the properties of yellow passion fruit for which the number of replicates is a function of the desired accuracy magnitude. In addition, the total number of plants per experiment is lower when using the optimal number of plants per plot.
Acknowledgements
The authors would like to thank the Mato Grosso State Research Foundation (Fundação de Amparo a Pesquisa do Estado de Mato Grosso - FAPEMAT) and the National Council of Technological and Scientific Development (Conselho Nacional de Desenvolvimento Científico e Tecnológico –CNPq) for granting the scholarship.
References
BARBIN, D. Planejamento e análise estatística de experimentos agronômicos. Arapongas: Midas, 2003. CONFALONIERI, R.; ACUTIS, M.; BELLOCCHI, G.; GENOVESE, G. Resampling-based software for estimating optimal sample size. Environmental Modeling and Software, v. 22, p. 1796-1800, 2007. CROCHEMORE, M. L.; MOLINARI, H. B.; STENZEL, N. M. C. Caracterização agromorfológica do maracujazeiro (Passiflora spp.). Revista Brasileira de Fruticultura, v. 25, n. 1, p. 5-10, 2003.
e uréia no crescimento e produção de biomassa do maracujazeiro-amarelo. Revista Ciência Agronômica, v. 42, n. 3, p. 597-604, 2011.
EFRON, B. Bootstrap method: another look at the jackknife. The Annals of Statistics, v. 7, n. 1, p. 1-26, 1979.
EMBRAPA-Empresa Brasileira de Pesquisa Agropecuaria.
Sistema brasileiro de classificação de solos. Brasília: SPI, 1999.
FERREIRA, D. F. Estatística básica. 2. ed. Lavras: UFLA, 2009.
FERREIRA, F. M.; NEVES, L. G.; BRUCKNER, C. H.; VIANA, A. P.; CRUZ, C. D.; BARELLI, M. A. A. Formação de supercaracteres para seleção de famílias de maracujazeiro amarelo. Acta Scientiarum. Agronomy, v. 32, n. 2, p. 247-254, 2010.
FREITAS, J. P. X.; OLIVEIRA, E. J.; CRUZ NETO, A. J.; SANTOS, L. R. Avaliação de recursos genéticos de maracujazeiro-amarelo. Pesquisa Agropecuária Brasileira, v. 46, n. 9, p. 1013-1020, 2011.
GANGA, R. M. D.; RUGGIERO, C.; LEMOS, E. G. M.; GRILI, G. V. G.; GONÇALVES, M. M.; CHADAS, E. A.; WICKERT, E. Diversidade genética em maracujazeiro-amarelo utilizando marcadores moleculares fAFLP. Revista Brasileira de Fruticultura, v. 26, n. 3, p. 494-498, 2004. GONÇALVES, G. M.; VIANA, A. P.; BEZERRA NETO, F. V.; PEREIRA, M. G.; PEREIRA, T. N. S. Seleção e herdabilidade na predição de ganhos genéticos em maracujá-amarelo. Pesquisa Agropecuária Brasileira, v. 42, n. 2, p. 193-198, 2007.
HATHEWAY, W. H.; WILLIAMS, E. J. Efficient estimation of the relationship between plot size and the variability of crop yields. Biometrics, v. 14, n. 2, p. 207-222, 1958. JUNQUEIRA, N. T. V.; ANJOS, J. R. N.; SILVA, A. P. O.; CHAVE, R. C.; GOMES, A. C. Reação às doenças e produtividade de onze cultivares de maracujá-azedo cultivadas sem agrotóxicos. Pesquisa Agropecuária Brasileira, v. 38, n. 8, p. 1005-1010, 2003.
KOCH, E. J.; RIGNEY, H. J. A method of estimating optimum plot size from experimental data. Agronomy Journal, v. 43, n. 1, p. 17-21, 1951.
KRAUSE, W.; SOUZA, R. S.; NEVES, L. G.; CARVALHO, M. L. S.; VIANA, A. P.; FALEIRO, F. G. Ganho de seleção no melhoramento genético intrapopulacional do maracujazeiro‑amarelo. Pesquisa Agropecuária Brasileira, v. 47, n. 1, p. 51-57, 2012. LIN, C. S.; BINNS, M. R. Working rules for determining the plot size and numbers of plots per block in field experiments. Journal of Agricultural Science, v. 103, n. 1, p. 11-15, 1984.
MEIER, V. D.; LESSMAN, K. J. Estimation of optimum field plot shape and size testing yield in Crambe abyssinica
hordnt. Crop Science, v. 11, n. 5, p. 648-650, 1971. NIED, A. H.; VELA, R. H. N.; PINTO, J. P.; VENDRUSCOLO, M. C.; SÁVIO, L. Temperatura do ar na região de Tangará da Serra – MT para o
período de 2003 a 2006. Tangará da Serra: Unemat, 2006. (Boletim Técnico 02/2006).
OLIVEIRA, E. J.; SANTOS, V. S.; LIMA, D. S.; MACHADO, M. D.; LUCENA, R. S.; MOTTA, T. B. N. Estimativas de correlações genotípicas e fenotípicas em germoplasma de maracujazeiro. Bragantia, v. 70, n. 2, p. 255-261, 2011.
PARANAÍBA, P. F.; FERREIRA, D. F.; MORAIS, A. R. Tamanho ótimo de parcelas experimentais: Proposição de métodos de estimação. Revista Brasileira de Biometria, v. 27, n. 2, p. 255-268, 2009.
PIRES, A. A.; MONNERAT, P. H.; PINHO, L. G. R.; ZAMPIROLLI, P. D.; ROSA, R. C. C.; MUNIZ, R. A. Efeito da adubação alternativa sobre os componentes de produção do maracujazeiro-amarelo. Acta Scientiarum. Agronomy, v. 31, n. 4, p. 655-660, 2009.
REIS, R. V.; OLIVEIRA, E. J.; VIANA, A. P.; PEREIRA, T. N. S.; PEREIRA, M. G.; SILVA, M. G. M. Diversidade genética em seleção recorrente de maracujazeiro-amarelo detectada por marcadores microssatélites. Pesquisa Agropecuária Brasileira, v. 46, n. 1, p. 51-57, 2011. RESENDE, M. D. V.; DUARTE, J. B. Precisão e controle de qualidade em experimentos de avaliação de cultivares.
Pesquisa Agropecuária Tropical, v. 37, n. 3, p. 182-194, 2007.
ROSADO, L. D. S.; SANTOS, C. E. M.; BRUCKNER, C. H.; NUNES, E. S.; CRUZ, C. D. Simultaneous selection in progenies of yellow passion fruit using selection indices.
Revista Ceres, v. 59, n. 1, p. 95-101, 2012.
SAEG-Sistema para Análises Estatísticas, Versão 9.1. Viçosa: Fundação Arthur Bernardes, UFV, 2007.
SILVA, M. G. M.; VIANA, A. P.; AMARAL JÚNIOR, A. T.; GONÇALVES, L. S. A.; REIS, R. V. Biometria aplicada ao melhoramento intrapopulacional do maracujazeiro amarelo. Revista Ciência Agronômica, v. 43, n. 3, p. 493-499, 2012.
STORCK, L. Partial collection of data on potato yield for experimental planning. Field Crops Research, v. 121, n. 2, p. 286-290, 2011.
STORCK, L.; FIORIN, R. A.; CARGNELUTTI FILHO, A.; GUEDES, J. V. C. A sampling procedure for quantifying mites in soybeans. Experimental and Applied Acarology, v. 57, n. 2, p. 117-126, 2012.
VELA, R. H. N.; NIED, A. H.; PINTO, J. P.; VENDRUSCOLO, M. C.; SÁVIO, L. Níveis de precipitação pluviométrica em Tangará da Serra-MT nos anos de 2003 a 2006.Tangará da Serra: Unemat, 2006. (Boletim Técnico nº 001/2006).
Received on June 26, 2012. Accepted on September 1, 2012.