Received April 17, 2008 and accepted November 27, 2008. Corresponding author: danieldenoronha@bol.com.br
Selection of models of lactation curves to use in milk production simulation
systems
1
Daniel de Noronha Figueiredo Vieira da Cunha
2, José Carlos Pereira
3, Fabyano Fonseca e
Silva
4, Oriel Fajardo de Campos
5, José Luis Braga
6, Janaina Azevedo Martuscello
21Financiado pelo CNPq e pela FAPEMIG.
2Pós-doutorando em Zootecnia – UFV/Departamento de Zootecnia. 3UFV/Departamento de Zootecnia.
4UFV/Departamento de Estatística. 5PESAGRO-RJ.
6UFV/Departamento de Informática.
ABSTRACT - The objective of this study was to select models of lactation curves with a better adjustment to the observed data in models of milk production simulation systems. A data base on 6,459 recordings of daily milk production was used. These data were obtained from monthly and fortnightly controls of milk between 2004 and 2007, from 472 lactations of animals from ten different milking cow herd farms. Based on rolling averages of milk production (MP-L/day) per cow, the ten herd farms were divided into low (L < 15), medium (15 <M < 20) and high (H > 20). Data were also divided according to the lactation numbers in first, second, third or greater. Eight lactation curve models commonly used in literature were compared. The models were individually adjusted for each lactation. The goodness of fit used for comparison of those models was the coefficient of determination, mean square error, mean square prediction error and the Bayesian information criterion. The values for the goodness of fit obtained in each model were compared by using 95% probability confidence interval. Wilmink (1987) model showed a better adjustment for cows of the first lactation numbers, whereas the Wood (1967) model showed a better adjustment for cows of the third or greater lactations numbers for the low milk production groups. Wood model showed a better adjustment for all the lactation numbers for the medium milk production group. Dijkstra (1997) model showed a better adjustment for all lactation numbers for the high milk production group. Despite of being more recent, the model by Pollott (2000), mechanist based and with a higher number of parameters, showed a good convergence for the used data.
Key Words: dairy cattle, modeling, non-linear model
Seleção de funções de curvas de lactação para uso em modelos de
simulação de sistemas de produção de leite
RESUMO - Objetivou-se neste estudo selecionar funções de curva de lactação visando utilizá-las em modelos de simulação de sistemas de produção de leite. A base de dados foi composta de 6.459 medidas de produção diária de leite, tomadas a partir de controles leiteiros mensais e quinzenais entre os anos de 2004 e 2007, provenientes de 472 lactações completas de 10 propriedades. As propriedades foram classificadas de acordo com a produção de leite por vaca (PL/dia), em baixa (PL<15), média (PL<20) e alta (PL>20). Os dados também foram divididos de acordo com as ordens de lactação, em primeira, segunda e terceira ou maiores ordens de lactação. Foram comparados oito modelos de curvas de lactação comumente citados na literatura, ajustados individualmente para cada lactação. As estatísticas utilizadas para comparar os ajustes dos modelos foram o coeficiente de determinação, o quadrado médio do erro, o quadrado médio do erro de predição e o critério bayesiano de informação. Os valores para as estatísticas de ajuste obtidos em cada modelo foram comparados utilizando intervalo de confiança e considerando 95% de probabilidade. Para as propriedades classificadas no grupo de baixa produção de leite, o modelo de Wilmink (1987) apresentou melhor ajuste para lactações de primeira ordem, enquanto o modelo de Wood (1967) apresentou melhor ajuste para lactações de segunda e terceira ou maior ordem. Para propriedades classificadas no grupo de média produção individual de leite, o modelo de Wood apresentou melhor ajuste em todas as ordens de lactação. Para propriedades classificadas no grupo de alta produção de leite por vaca o modelo de Dijkstra (1997) apresentou melhor ajuste para todas as ordens de lactação. O modelo de Pollott (2000), embora mais recente, de base mecanicista e com maior número de parâmetros, apresentou baixa convergência aos dados utilizados.
Palavras-chave: gado de leite, modelagem, modelo não-linear
Introduction
The term lactation curve refers to a graphic
representation of the ratios between milk production and
lactation time starting at calving (Papajcsik & Bodero,
1988). Equations that describe milk production in time can
be very useful in genetic breeding programs, herd
nutritional management, decision taking on the culling
cows and milk production simulation systems.
The lactation curve is also important because its wide
characterization of the animal production throughout
lactation allows to estimate the peak yield, lactation
persistency and days in milk (Ferreira & Bearzoti, 2003).
The first attempts to mathematically represent the
lactation curve were made by Brody et al. (1923) and
Brody et al. (1924). However, only after the development
of the model by Wood (1967) did the use of lactation curve
models become more popular. Since then, many researchers
have attempted to develop lactation curve models from
empirical conceptions (Cobby & LeDu, 1978; Wilmink,
1987) or mechanist conceptions (Rook et al., 1993;
Dijkstra et al., 1997; Pollott, 2000).
The objective of this study was to select models of
lactation curves for analysis of milk production data to be
used in milk production simulation systems.
Material and Methods
A database on 6,459 recordings of daily milk production
(MP) was used. These data were obtained from monthly and
fortnightly milk records from 2004 to 2007, from 472 complete
lactations from ten different milking cow herd farms in the
region of Viçosa, Minas Gerais, Brazil. All the farms are
assisted by the
Programa de Desenvolvimento da Pecuária
de Leite (PDPL - RV)
an agreement between Universidade
Federal de Viçosa and Dairy Partner of America.
Based on rolling average milk production (MP), the ten
herd farms were divided into low (MP < 15.0), medium
(15.0 < MP < 20.0) and high (MP > 20.0). Except for herd
farms 4 and 8, in which the cows were corn silage fed
throughout the year, the other farms use the pasture
production system, with bulk supplementation in the dry
season of the year. All animals in the ten herd farms were
either crossbred Holstein × Zebu (HZ) or purebred (PB)
Holstein animals. The animals in the herd farms classified as
low, medium and high milk production were predominantly
crossbred 1/2 HZ and 15/16 HZ; crossbred 3/4 HZ and PB
and crossbred 7/8 HZ to 31/32 HZ, respectively.
After classification, the data were ranked according to
the lactation number, into first, second, third or greater, as
reported by Val-Arreola et al. (2004) and Dematawewa et al.
(2007). This procedure resulted in the formation of nine
subgroups: L1 = low production and 1st lactation number;
L2 = low production and 2nd lactation number; L3 = low
production and 3rd or greater lactation number; M1 =
medium production and 1st lactation number; M2 = medium
production and 2nd lactation number; M3 = medium
production and 3rd or greater lactation number; H1 = high
production and 1st lactation number; H2 = high production
and 2nd lactation number; and H3 = medium production and
3rd or greater lactation number.
Eight lactation curve models were compared and they
ranged in the number of parameters and from empirical to
mechanistic models (Table 1).
1Yt = milk production per cow (L/day), t = days in milk, a, b, c, d, g, h = (all > 0) = parameters that define the scale or shape of curves.
Author Lactation curve model1
Brody et al. (1923) (B23)
Brody et al. (1924) (B24)
Wood (1967) (WD)
Cobby & Le Du (1978) (CB)
Wilmink (1987) (WL)
Rook et al. (1993) (RK)
Dijkstra et al. (1993) (DJ)
Pollott (2000) (PO)
The parameters of the models were adjusted considering
the set of information from each subgroup, using the
interactive Gauss-Newton method modified for nonlinear
regression, Proc NLIN procedure of SAS 9.0. After obtaining
the fitted parameters, the following were estimated for each
model:
peak yield (PY)
, the peak day (Pday) and the 305
days corrected milk production (305MP). The calculations
were made by using interactive methods in the STELLA 8.0
simulation program. The program uses stocks, flows and
auxiliary variables to calculate the total accumulated value
(305MP), the maximum point (Pday) and the value at the
maximum point (PLP) of the lactation curve models.
The model was individually adjusted for each lactation
within each subgroup, and the goodness of fit of the model
parameters were calculated using the Proc MODEL
procedure of SAS 9.0. The goodness of fit used to compare
those models were the determination coefficient (R2), mean
square error (MSE), mean square prediction error (MSPE)
and the Bayesian information criterion (BIC). The values for
the goodness of fit obtained in each model were compared
by using the 95% probability confidence interval.
It was considered non-converged each lactation
curve model that completed 100 interactions without
reaching the reduction of the sum-of-squares error (SSE)
or whose parameters converged to unreal values. In each
subgroup, the percentage of convergence in each
lactation curve model was calculated. When the
convergence percentage for a certain lactation curve
model was less than 50%, the model was considered of
low convergence and discarded.
Results and Discussion
The production per cow ranged from 10.50 to 14.70
and from 16.14 to 19.26 L/day in five low milk production
milk farm (L) and four medium milk production herd
farms (M), respectively (Table 2). In the single herd farm
of high production (H), the production was 22.91 L/day.
Within each group ranked by milk production (L, M, H),
the production mean of the cows ranked three or greater
(L3, M3 and H3) was higher than the cows of the second
lactation number (L2, M2 and H2) which was greater than
the first lactation number (L1, M1 and H1) (Table 3). By
comparing milk production (L/day) among the groups, the
production from the L3 subgroup, order of the greatest
production in the L group, was smaller than that of M1,
order of the smallest production in the M group. Furthermore,
the production of the M3 subgroup, order of the greatest
production in the M group, was smaller than that of H1, the
order of the smallest production in the H group.
The lactation curve models by Cobby & Le Du (1978)
estimated peak day values considerably closer to the
beginning of lactation than the models by Wilmink (1987),
Wood (1967), Rook et al. (1993) and by Dijkstra et al.
(1993), in all the lactation numbers (Table 4). Considering
the model by Brody et al. (1924), there was no need to show
the peak yield and peak day values in the tables, because
this model cannot represent increase in production at the
beginning of lactation, and the estimate of maximum milk
production was at the intercept, whose value corresponds
to the
a
parameter. Although this characteristic did not
permit the model to describe lactation curves peculiar to
herd farms specialized for milk production, Thornley &
France (2007) considered that that model can be adequately
fitted for low milk production crossbred animals reared in
tropical conditions.
The models by Rook et al. (1993), Dijkstra et al. (1993)
and Pollott (2000) were excluded from the analysis of low
milk production herd farms because they showed less than
50% convergence for the data (Table 5). The model by
Pollott (2000) did not converge in any of lactations in the L1
and L2 subgroups. It is possible that those more recent
Herd farm1 Classification Number of records Number of lactations Milk production (L/day)
Mean SE CV (%)
1 Low production 2 2 4 2 2 13.63 5.76 42.26
2 Low production 2 5 4 2 5 13.02 5.27 40.48
3 Low production 2 7 9 2 7 10.79 4.02 37.26
4 High production 2 3 6 1 1 1 9 22.91 6.80 29.68
5 Medium production 4 4 1 4 6 16.84 6.56 38.95
6 Medium production 9 2 9 7 5 16.14 6.33 39.22
7 Low production 6 4 1 5 2 14.70 6.25 42.52
8 Medium production 6 7 5 4 2 19.26 6.49 33.70
9 Medium production 3 1 5 3 3 17.30 7.69 44.45
1 0 Low production 3 4 0 3 1 10.50 4.17 39.71
1SE = standard error, CV = coefficient of variation. L = low milk production, M = medium milk production and H = high milk production.
Table 3 - Descriptive statistics and data classification according to milk production mean and the lactation number of the cows
Subgroup Number of farms Number of lactations Number of records Milk production (L/day)
Mean SD CV (%)
L1 5 4 8 5 3 8 10.85 4.16 38.34
L2 5 3 9 4 3 9 12.91 5.26 40.74
L3 5 7 0 7 6 1 14.24 6.29 44.17
M 1 4 4 4 5 8 0 15.26 5.30 34.73
M 2 4 4 4 5 5 4 17.18 6.44 37.49
M 3 4 1 0 5 1 2 2 6 18.35 7.23 39.40
H1 1 3 8 7 6 5 20.12 5.06 25.15
H2 1 3 5 6 9 7 24.10 6.68 27.71
H3 1 4 7 8 9 9 24.36 7.44 30.54
SD = standard deviation, CV = coefficient of variation, L1 = low milk production (MP) and 1st lactation number (LN), L2 = low MP and 2nd LN, L3 = low MP and 3rd or
greater LN, M1 = medium MP and 1st LN, M2 = medium MP and 2nd LN, M3 = medium MP and 3rd or greater LN, H1 = high MP and 1st LN, H2 = high MP and 2nd LN,
H3 = high MP and 3rd or greater LN.
Lactation curve model
Item Brody et al. Brody et al. Wood Wood Cobby & Wilmink Dijkstra et al. Pollott
(1923) (1924) (1967) Le Du (1978) (1987) (1993) (2000)
Low milk production of first lactation number1,2
a 16.0542 16.3021 12.2475 15.5048 15.7877 17.9360 11.9983
(0.3328) (0.3500) (0.9437) (0.2751) (0.3233) (0.9908) (1.3889)
b 0.0026 0.00268 0.0883 0.0286 4.3153 2.9630 0.0287
(0.0001) (0.0001) (0.0235) (0.0015) (2.0928) (2.4726) (0.0214)
c 0.7266 0.00356 1.2269 0.1358 4.6875 0.0806
(0.2000) (0.0003) (0.4516) (0.0980) (5.7217) (0.0415)
d 0.0298 0.00308 0.00294
(0.0016) (0.0002) (0.0002)
PMP (L) 15.9 0 8 14.887 15.328 14.915 15.100 15.199
Pday (days) 8 2 5 5 2 2 2 5 2 8
305MP (L) 3,369.08 3,369.80 3,378.73 3,381.13 3,388.26 3,377.10 3,373.44
Low milk production of second lactation number2
a 19.7619 20.2924 12.5271 19.2158 20.3934 93.7135 16.2192
(0.4540) (0.4985) (1.1133) (0.3633) (0.6978) (226.7) (0.8821)
b 0.00287 0.00302 0.1489 0.0392 4.9003 364.3 0.00869
(0.0002) (0.0002) (0.0272) (0.0019) (1.3045) (1238.7) (0.0018)
c 0.4781 0.00453 0.9501 0.0406 75.2338 0.0114
(0.1073) (0.0003) (0.3386) (0.0222) (41.681) (0.0069)
d 0.0444 0.00635 0.00522
(0.0032) (0.0028) (0.0013)
PY (L) 19.524 18.157 18.9 1 7 17.660 17.476 17.413
Pday (days) 1 1 3 3 7 3 7 4 4 4 5
305MP (L) 4,002.31 3,997.21 4,007.08 4,012.18 4,022.95 4,011.92 4,011.92
Low milk production of third lactation number1,2
a 22.0234 22.2922 15.1210 21.1723 21.8090 29.4555 17.2275 30.7481
(0.4338) (0.4492) (1.1291) (0.3497) (0.4741) (3.934) (1.1761) (10.4822)
b 0.00298 0.00305 0.1242 0.0435 5.3695 14.5470 0.0139 0.4424
(0.0001) (0.0001) (0.0230) (0.0019) (1.8332) (12.642) (0.006) (9.7721)
c 0.9941 0.00439 1.2511 0.0809 18.9091 0.0343 1.0535
(0.2705) (0.0003) (0.3997) (0.0469) (14.1736) (0.0135) (5.4354)
d 0.0464 0.00413 0.00382 0.3612
(0.0024) (0.0004) (0.0003) (0.2017)
g 0.00475
(0.00143)
h 1.7039
(97.9319)
PY (L) 21.831 20.227 20.914 19.952 20.077 20.016 19.380
Pday (days) 6 2 8 5 2 8 3 4 3 8 7
305MP (L) 4,396.87 4,397.24 4,404.04 4,411.23 4,415.11 4,397.87 4,393.34 4,310.40
1 Values in parenthesis = standard deviation.
models, with a mechanist basis, did not adjust properly to
lactations data of cows with low milk production, whose
lactation curves do not present evident milk production
peaks. Problems of convergence have been previously
reported for the models by Rook et al. (1923), (Pérochon et
al., 1996, Vargas et al., 2000) and Pollott (2000),Val-Arreola
et al., (2000), but not for the model by Dijkstra et al. (1993).
There was no difference (P>0.05) in the L1 subgroup
among the four lactation curve models that presented
convergence greater than 50% neither for any of the
goodness of fit measurements. In absolute values, the
model by Brody et al. (1923) showed a low adjustment in all
the goodness of fit measurements. Although the model by
Brody et al. (1923) presented greater coefficient of
determination, the model by Wilmink (1987) was selected to
represent the lactations in the L1 subgroup because it
presented, in absolute values, the best goodness of fit for
the mean square error, mean square prediction error and
Bayesian information criterion goodness of fit
measurements
.
The Wilmink (1987) model is a modification of the model
by Cobby & Le Du (1978) where
a
is associated to the
production level,
b
is related to milk production before
lactation peak,
d
represents the decrease in production after
the lactation peak and
c
is associated to the peak day.
Although the Wilmink (1987) model has a one more
parameter than the model by Wood (1967), the value obtained
with
a
–
b
corresponds exactly to milk production at the
beginning of lactation, and variations in the value of the
parameter of
a
scale do not produce alterations in the shape
of the curve. The same is not true for the model by Wood
(1967), therefore in this case, it cannot be considered
precisely as
a
parameter of scale.
Regarded to the L2 subgroup, from the five lactation
curve models that presented convergence greater than
50%, the model by Brody et al. (1923) showed an adjustment
Lactation curve modelBrody et al. Brody et al. Wood Cobby & Wilmink Rook et al. Dijkstra et al. Pollott
Item (1923) (1924) (1967) Le Du (1978) (1987) (1993) (1993) (2000)
Low milk production of first lactation number1,2
Coefficient of 0.742b 0.846ab 0.818ab 0.804ab 0.819ab 0.908a 0.859ab
determination (0.203) (0.115) (0.186) (0.200) (0.185) (0.059) (0.148)
Mean square 2.914a 2.339ab 2.291ab 1.818ab 2.235ab 1.258b 1.535ab
error (2.185) (1.974) (1.786) (1.297) (1.797) (0.683) (1.295)
Mean square 2.383a 1.706ab 1.668ab 1.356b 1.635ab 0.868b 1.051b
prediction error (1.763) (1.393) (1.275) (0.991) (1.296) (0.526) (0.913)
Bayesian 45.891 46.125 44.864 44.836 45.136 47.667 46.040
information criterion (10.72) (11.166) (12.76) (13.106) (12.532) (12.981) (15.864)
Convergence percentage 93.8 62.5 66.7 47.9 60.4 10.4 29.2
Low milk production of second lactation number2
Coefficient of 0.720c 0.829 bc 0.862b 0.834 bc 0.857bc 0.868abc 0.953a
determination (0.237) (0.181) (0.146) (0.189) (0.152) (0.149) (0.035)
Mean square error 7.411a 4.177ab 3.456b 3.656ab 3.424ab 2.889ab 2.083b
(8.604) (3.721) (2.989) (2.766) (2.960) (2.883) (2.433) Mean square prediction 5.412a 3.098ab 2.581ab 2.718ab 2.562ab 1.848b 1.341b
error (6.196) (2.853) (2.298) (2.124) (2.275) (1.969) (1.627)
Bayesian information 55.324 51.173 49.635 50.602 49.930 46.072 43.595
criterion (15.966) (16.255) (16.571) (16.338) (16.401) (14.954) (16.068)
Convergence percentage 1 0 0 69.2 71.8 53.8 59.0 28.2 28.2
Low milk production of third or greater lactation number1,2
Coefficient of 0.787c 0.862bc 0.891b 0.864bc 0.874b 0.939a 0.900ab 0.952a
determination (0.197) (0.126) (0.111) (0.132) (0.127) (0.0400) (0.142) (0.036)
Mean square error 6.570a 4.135ab 3.412bc 3.955abc 3.895bc 2.084cd 3.248bc 2.374bc
(6.643) (3.696) (3.246) (3.56) (3.46) (1.802) (3.768) (2.017)
Mean square prediction 4.770a 3.013ab 2.484bc 2.894ab 2.840b 1.308cd 2.152bcd 1.010d
error (4.825) (2.747) (2.409) (2.663) (2.572) (1.25) (2.561) (0.917)
Bayesian information 53.272a 49.212ab 46.826ab 49.722ab 49.400ab 43.337b 49.389ab 47.284ab
criterion (15.161) (14.298) (13.938) (14.331) (13.676) (12.8) (17.523) (12.652)
Convergence percentage 1 0 0 75.7 87.1 58.6 68.6 30.0 34.3 17.1
Table 5 - Model adjustment statistics for the data of low milk production herd farms
1 Values in parenthesis = standard deviation.
2 C% = convergence percentage; BIC = Bayesian information criterion; R2 = coefficient of determination; MSE = mean square error; MSPE = mean square prediction error;
lower (P<0.05) than the one by Wood (1967) according to
the determination coefficient and mean square error
goodness of fit measurements. The other models did not
differ (P>0.05) in any of the goodness of fit measurements.
Although, in numerical terms, the model by Wilmink (1987)
showed a better
adjustment
than the others for the mean
square error and mean square prediction error goodness of
fit measurements, the model by Wood (1967) was selected
to represent the L2 subgroup because it showed a better
adjustment for the coefficient of determination and Bayesian
information criterion goodness of fit measurements, in
addition to have presented a higher percentage of
convergence than the model by Wilmink (1987).
The model by Wood (1967) had a greater advantage of
producing a good fit measurement with only three
parameters. Concerned to milk production simulation
systems, this means a computer resource saving through
the use of a fewer number of constants, although
nowadays, computer resources do not present a very
limiting factor. However, some criticisms have been
made regarding to the difficulty of precise biological
interpretation of the parameters and the tendency to
under- and overestimate milk production in the middle
and at the end of the lactation, respectively (Cobby & Le
Du, 1978; Rook et al., 1993). Perhaps the most undesirable
characteristic of this model was the nil of the intercept
model. Nevertheless, for the use in milk production
simulation systems, such as those by Rotz et al. (1999),
Rotz et al. (2005), Rennó et al. (2008a, b, c), in which the
time interval used in each interaction is greater than one
day, this may not present serious problems.
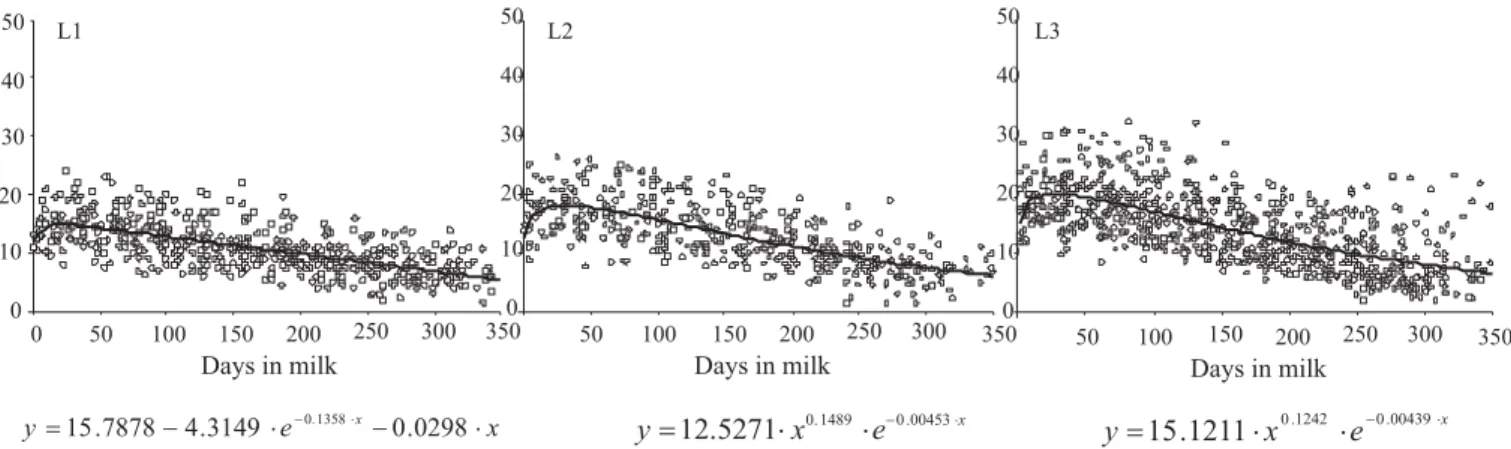
In the L3 subgroup, considering the five lactation curve
models that showed convergence greater than 50%, the
models by Wood (1967) and Wilmink (1987) showed a better
adjustment (P<0.05) than that one by Brody et al. (1923) for
the determination coefficient, mean square error and mean
square prediction error, but not for the Bayesian information
criterion goodness of fit measurement. The fact that the
model by Brody et al. (1923) has only two parameters helped
to improve its adjustment by the Bayesian information criterion
goodness of fit measurement. The other models did not
present differences (P>0.05) for any of the goodness of fit
measurements. The model by Wood (1967) was selected to
represent the lactations in the L3 group because, in absolute
values, it presented the best adjustment in all the goodness
of fit measurements. Furthermore, except for the model by
Brody et al. (1923), the model by Wood (1967) showed better
convergence percentage than the others (Figure 1).
Although considered as low milk production, the
lactations of the animals in the L group presented
production peak after the beginning of lactation. Even
though Val-Arreola et al. (2004) observed good adjustment
of the model by Brody et al. (1923) for lactations of low milk
production animals in Mexico, and Thornley & France
(2007) considered it could be used for low milk production
crossbred animals reared in tropical conditions, the model
was shown not to be suitable to represent the lactations of
animals in group L in any of the lactation number.
Once more, the models by Brody et al. (1924) and by
Cobby & Le Du (1978) estimated peak day values
considerably closer to the ones at the beginning of
lactation (Table 6) than the models by Wilmink (1987),
Wood (1967), Rook et al. (1993) and Dijkstra et al. (1993),
in all the lactation numbers. For this group of farms, the
models by Rook et al. (1993), Dijkstra et al. (1993) and by
Pollott (2000) presented less than 50% convergence again
and were not considered in the comparison of the goodness
of fit measurements (Table 7).
The model by Wood (1967) presented the best
adjustment
for all the lactation numbers of the medium milk production
group (Figure 2). For the M1 subgroup, the model by
Wood (1967) showed a better
adjustment
for the
coefficient
of determination and Bayesian information criterion
goodness of fit measurements and greater percentage of
convergence than the model by Wilmink (1987). For the M2
and M3 subgroups, in numerical terms, the model by Wood
(1967) showed a better adjustment than the others for all the
goodness of fit measurements except Bayesian information
criterion in the M2 subgroup, for which the model by
Brody et al. (1924) showed the best adjustment.
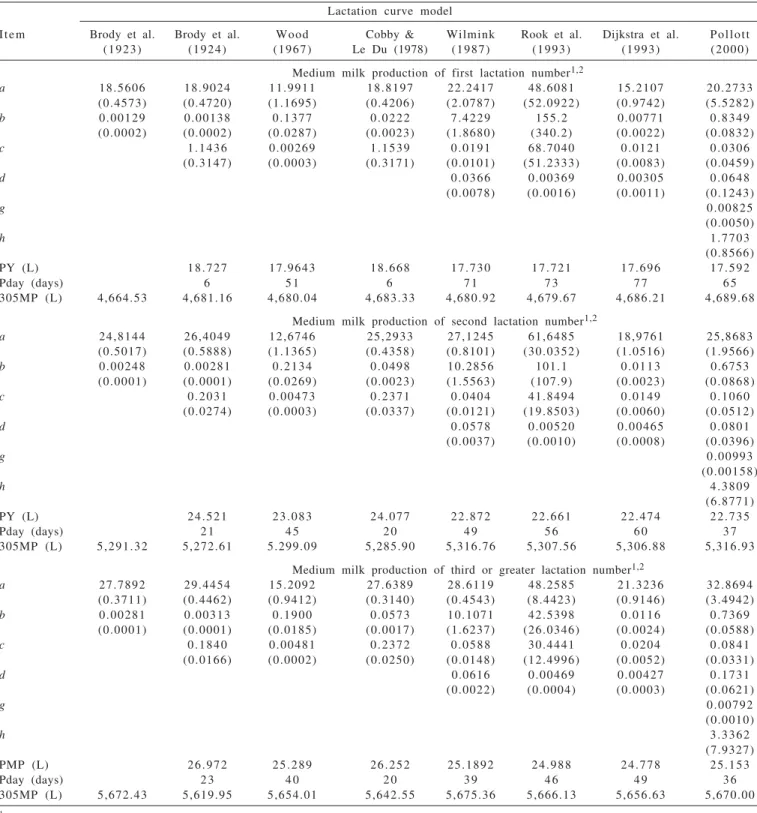
Lactation curve model
Item Brody et al. Brody et al. Wood Cobby & Wilmink Rook et al. Dijkstra et al. Pollott
(1923) (1924) (1967) Le Du (1978) (1987) (1993) (1993) (2000)
Medium milk production of first lactation number1,2
a 18.5606 18.9024 11.9911 18.8197 22.2417 48.6081 15.2107 20.2733
(0.4573) (0.4720) (1.1695) (0.4206) (2.0787) (52.0922) (0.9742) (5.5282)
b 0.00129 0.00138 0.1377 0.0222 7.4229 155.2 0.00771 0.8349
(0.0002) (0.0002) (0.0287) (0.0023) (1.8680) (340.2) (0.0022) (0.0832)
c 1.1436 0.00269 1.1539 0.0191 68.7040 0.0121 0.0306
(0.3147) (0.0003) (0.3171) (0.0101) (51.2333) (0.0083) (0.0459)
d 0.0366 0.00369 0.00305 0.0648
(0.0078) (0.0016) (0.0011) (0.1243)
g 0.00825
(0.0050)
h 1.7703
(0.8566)
PY (L) 18.727 17.9643 18.668 17.730 17.721 17.696 17.592
Pday (days) 6 5 1 6 7 1 7 3 7 7 6 5
305MP (L) 4,664.53 4,681.16 4,680.04 4,683.33 4,680.92 4,679.67 4,686.21 4,689.68
Medium milk production of second lactation number1,2
a 24,8144 26,4049 12,6746 25,2933 27,1245 61,6485 18,9761 25,8683
(0.5017) (0.5888) (1.1365) (0.4358) (0.8101) (30.0352) (1.0516) (1.9566)
b 0.00248 0.00281 0.2134 0.0498 10.2856 101.1 0.0113 0.6753
(0.0001) (0.0001) (0.0269) (0.0023) (1.5563) (107.9) (0.0023) (0.0868)
c 0.2031 0.00473 0.2371 0.0404 41.8494 0.0149 0.1060
(0.0274) (0.0003) (0.0337) (0.0121) (19.8503) (0.0060) (0.0512)
d 0.0578 0.00520 0.00465 0.0801
(0.0037) (0.0010) (0.0008) (0.0396)
g 0.00993
(0.00158)
h 4.3809
(6.8771)
PY (L) 24.521 23.083 24.077 22.872 22.661 22.474 22.735
Pday (days) 2 1 4 5 2 0 4 9 5 6 6 0 3 7
305MP (L) 5,291.32 5,272.61 5.299.09 5,285.90 5,316.76 5,307.56 5,306.88 5,316.93
Medium milk production of third or greater lactation number1,2
a 27.7892 29.4454 15.2092 27.6389 28.6119 48.2585 21.3236 32.8694
(0.3711) (0.4462) (0.9412) (0.3140) (0.4543) (8.4423) (0.9146) (3.4942)
b 0.00281 0.00313 0.1900 0.0573 10.1071 42.5398 0.0116 0.7369
(0.0001) (0.0001) (0.0185) (0.0017) (1.6237) (26.0346) (0.0024) (0.0588)
c 0.1840 0.00481 0.2372 0.0588 30.4441 0.0204 0.0841
(0.0166) (0.0002) (0.0250) (0.0148) (12.4996) (0.0052) (0.0331)
d 0.0616 0.00469 0.00427 0.1731
(0.0022) (0.0004) (0.0003) (0.0621)
g 0.00792
(0.0010)
h 3.3362
(7.9327)
PMP (L) 26.972 25.289 26.252 25.1892 24.988 24.778 25.153
Pday (days) 2 3 4 0 2 0 3 9 4 6 4 9 3 6
305MP (L) 5,672.43 5,619.95 5,654.01 5,642.55 5,675.36 5,666.13 5,656.63 5,670.00
1 Values in parenthesis = standard deviation.
The model by Wood (1967) has been widely used in
several types of studies, such as for new models assessment
(Cobby & Le Du, 1978; Rook et al., 1993), genetic breeding
(Schneeberger, 1982; Grossman et al., 1984; Ferris et al., 1985;
Faro & Albuquerque, 2002), milk production simulation
systems (Rotz et al., 1999; Rotz et al., 2005; Rennó et al., 2008a;
Figure 2 - Lactation curves and lactation curve models selected, that best fit the data of the M1, M2 and M3 subgroups. M1 = medium milk production (MP) and first lactation order (LN); M2 = medium MP and second LN; M3 = medium MP and third or greater LN; y = milk production (L/day), x = days in milking.
Tabela 7 - Goodness of fit model for the data of the medium milk production herd farms
Lactation curve model
Item Brody et al. Brody et al. Wood Cobby & Wilmink Rook et al. Dijkstra et al. Pollott
(1923) (1924) (1967) Le Du (1978) (1987) (1993) (1993) (2000)
Medium milk production of first lactation number1,2
Coefficient of 0.513b 0.602ab 0.680ab 0.612ab 0.679ab 0.701ab 0.774a 0.809a
determination (0.325) (0.233) (0.255) (0.233) (0.258) (0.255) (0.218) (0.165)
Mean square error 6.396 5.676 3.914 5.453 3.787 3.244 3.215 2.719
(5.424) (5.111) (3.74) (4.915) (3.416) (3.830) (3.544) (2.727)
Mean square prediction 4.929a 4.511ab 3.063ab 4.347ab 2.971ab 2.293ab 2.374ab 1.580b
error (4.434) (4.24) (3.104) (4.076) (2.831) (2.997) (2.784) (1.568)
Bayesian information 64.040 65.998 57.715 66.083 57.883 55.426 59.727 68.000
criterion (23.667) (23.779) (23.877) (23.689) (24.587) (26.518) (26.332) (13.725)
Convergence percentage 88.6 59.1 86.4 56.8 84.1 36.4 45.5 15.9
Medium milk production of second lactation number1,2
Coefficient of 0.691c 0.851ab 0.856b 0.834ab 0.830ab 0.937a 0.913ab 0.896ab
determination (0.233) (0.114) (0.093) (0.167) (0.171) (0.054) (0.080) (0.106)
Mean square error 11.854a 4.994b 4.597b 4.824b 5.242b 2.693b 3.166b 4.694ab
(15.883) (4.409) (3.233) (3.715) (4.484) (2.440) (2.565) (4.638)
Mean square prediction 8.951a 3.701b 3.446b 3.631b 3.986ab 1.835b 2.250b 2.476b
error (12.627) (3.233) (2.456) (2.922) (3.642) (1.900) (1.950) (2.352)
Bayesian information 68.91 59.115 59.366 59.687 60.545 53.735 61.448 69.579
criterion (21.987) (16.863) (17.628) (19.435) (20.801) (18.382) (21.587) (19.104)
Convergence percentage 1 0 0 72.7 88.6 72.7 79.5 15.9 45.5 2 5
Medium milk production of third or greater lactation number1,2
Coefficient of 0.757d 0.856c 0.877bc 0.868c 0.867c 0.920ab 0.936a 0.933a
determination (0.170) (0.135) (0.134) (0.136) (0.137) (0.061) (0.054) (0.062)
Mean square error 11.094a 6.082b 5.396bc 5.412bc 5.587bc 3.794c 3.527bc 4.925bc
(9.926) (5.748) (5.970) (5.865) (6.540) (2.698) (5.151) (3.656)
Mean square prediction 8.058a 4.455b 3.930b 3.980b 4.090b 2.317c 2.195c 2.248c
error (7.167) (4.301) (4.416) (4.352) (4.816) (1.585) (2.640) (1.785)
Bayesian information 67.457a 58.217ab 55.760b 56.619b 56.231b 53.234b 54.635b 63.616ab criterion (18.625) (17.837) (16.176) (18.224) (17.176) (13.707) (16.243) (17.075)
Convergence percentage 99.0 89.5 93.3 88.6 85.7 27.6 45.7 37.1
1 Values in parenthesis = standard deviation. 2 C% = convergence percentage; BIC = Bayesian information criterion; R2 = coefficient of determination; MSE = mean square
error; MSPE = mean square prediction error.
Rennó et al., 2008b; Rennó et al., 2008c) and nutrition (Fox
et al., 2003), because of its recognized capability allied to its
simplicity.
Models by Brody et al. (1924) and by Cobby & Le Du
(1978) estimated, once more, peak day values remarkably
closer to the beginning of lactation than the ones by
Wilmink (1987), Wood (1967), Rook et al. (1993) and by
Dijkstra et al. (1993) in all the lactation numbers (Table 8).
The obtained results indicated the possibility that the
models by Brody et al. (1924) and Cobby & Le Du (1978)
have the characteristic of underestimating peak day.
Concerning to the high milk production group, the model
by Dijkstra et al. (1993) showed a better adjustment than
the others in all the lactation numbers. Models by Rook
et al. (1993) and Pollott (2000) were excluded from the
analysis because they presented less than 50%
convergence (Table 9).
For the H1 subgroup, from the six models that converged
in more than 50% of the lactations, the model by Brody et
al. (1924) showed a poorer adjustment (P>0.05) than the
others for the coefficient of determination,
mean square
error and mean square prediction
goodness of fit
measurements and a poorer adjustment (P>0.05) than the
model by Wood (1967), Cobby & Le Du (1978), Wilmink
(1987) and by Dijkstra et al. (1993) for the Bayesian
information criterion goodness of fit measurement. The
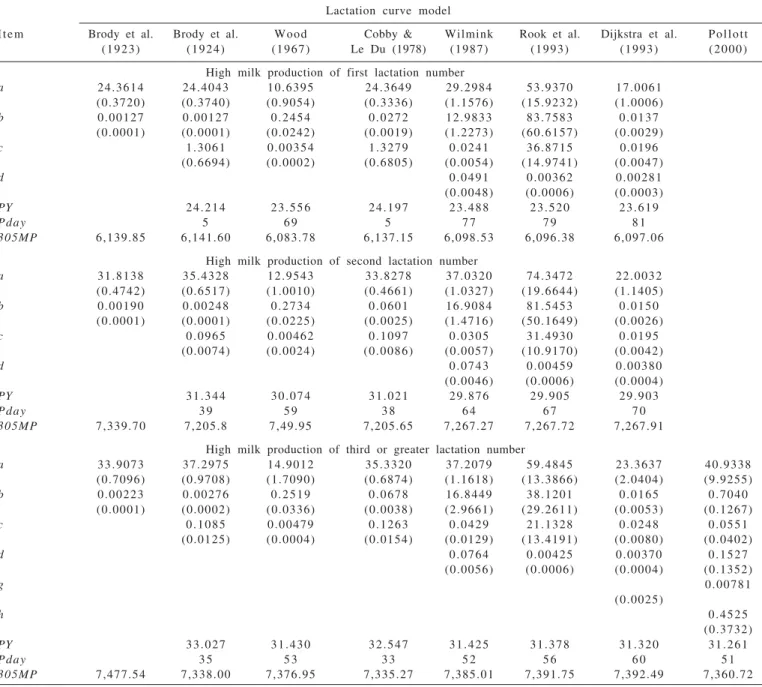
Lactation curve model
Item Brody et al. Brody et al. Wood Cobby & Wilmink Rook et al. Dijkstra et al. Pollott
(1923) (1924) (1967) Le Du (1978) (1987) (1993) (1993) (2000)
High milk production of first lactation number
a 24.3614 24.4043 10.6395 24.3649 29.2984 53.9370 17.0061
(0.3720) (0.3740) (0.9054) (0.3336) (1.1576) (15.9232) (1.0006)
b 0.00127 0.00127 0.2454 0.0272 12.9833 83.7583 0.0137
(0.0001) (0.0001) (0.0242) (0.0019) (1.2273) (60.6157) (0.0029)
c 1.3061 0.00354 1.3279 0.0241 36.8715 0.0196
(0.6694) (0.0002) (0.6805) (0.0054) (14.9741) (0.0047)
d 0.0491 0.00362 0.00281
(0.0048) (0.0006) (0.0003)
PY 24.214 23.55 6 24.197 23.488 23.520 23.619
P d a y 5 6 9 5 7 7 7 9 8 1
305MP 6,139.85 6,141.60 6,083.78 6,137.15 6,098.53 6,096.38 6,097.06
High milk production of second lactation number
a 31.8138 35.4328 12.9543 33.8278 37.0320 74.3472 22.0032
(0.4742) (0.6517) (1.0010) (0.4661) (1.0327) (19.6644) (1.1405)
b 0.00190 0.00248 0.2734 0.0601 16.9084 81.5453 0.0150
(0.0001) (0.0001) (0.0225) (0.0025) (1.4716) (50.1649) (0.0026)
c 0.0965 0.00462 0.1097 0.0305 31.4930 0.0195
(0.0074) (0.0024) (0.0086) (0.0057) (10.9170) (0.0042)
d 0.0743 0.00459 0.00380
(0.0046) (0.0006) (0.0004)
PY 31.3 4 4 30.074 31.021 29.876 29.905 29.903
P d a y 3 9 5 9 3 8 6 4 6 7 7 0
305MP 7,339.70 7,205.8 7,49.95 7,205.65 7,267.27 7,267.72 7,267.91
High milk production of third or greater lactation number
a 33.9073 37.2975 14.9012 35.3320 37.2079 59.4845 23.3637 40.9338
(0.7096) (0.9708) (1.7090) (0.6874) (1.1618) (13.3866) (2.0404) (9.9255)
b 0.00223 0.00276 0.2519 0.0678 16.8449 38.1201 0.0165 0.7040
(0.0001) (0.0002) (0.0336) (0.0038) (2.9661) (29.2611) (0.0053) (0.1267)
c 0.1085 0.00479 0.1263 0.0429 21.1328 0.0248 0.0551
(0.0125) (0.0004) (0.0154) (0.0129) (13.4191) (0.0080) (0.0402)
d 0.0764 0.00425 0.00370 0.1527
(0.0056) (0.0006) (0.0004) (0.1352)
g 0.00781
(0.0025)
h 0.4525
(0.3732)
PY 33.027 31.430 32.547 31.425 31.378 31.320 31.261
P d a y 3 5 5 3 3 3 5 2 5 6 6 0 5 1
305MP 7,477.54 7,338.00 7,376.95 7,335.27 7,385.01 7,391.75 7,392.49 7,360.72
Values in parenthesis = standard deviation.
model by Dijkstra et al. (1993) showed a better fit (P>0.05)
than the one by Brody et al. (1924) for the
mean square
error and mean square prediction error
goodness of fit
measurement and in absolute terms, presented a better fit
than the others for all the goodness of fit measurements
used.
In the H2 subgroup, the models by Wood (1967), Cobby
& Le Du (1978), Wilmink (1987) and by Dijkstra et al. (1993)
did not differ (P>0.05) in the adjustment of any of the
goodness of fit measurements, while the model by Brody et
al. (1924) showed a poorer adjustment (P>0.05) than the
others in all goodness of fit measurements. The model by
Dijkstra et al. (1993) showed a better adjustment than the
model by Brody et al. (1924) (P>0.05) in the R2s,
mean square
error and mean square prediction error
goodness of fit
measurements, but not in Bayesian information criterion.
The model by Brody et al. (1924) did not differ from the
models by Wood (1967), Cobby & Le Du (1978) and by
Wilmink (1987) (P>0.05) in the adjustment of any of the
goodness of fit measurements. Numerically, the model by
Dijkstra et al. (1993) showed a better adjustment than the
others in all the goodness of fit measurements.
In the H3 subgroup, from the six models that converged
in more than 50% of the lactations, the model by Brody et
al. (1924) showed a poor adjustment (P>0.05) in all the
goodness of fit measurements while the others did not differ
(P>0.05) for any of the goodness of fit measurements. In
absolute values the model by Dijkstra et al. (1993) showed
a better adjustment than the others in all the goodness of
fit measurements.
Val-Arreola et al. (2004) also observed the better adjustment
of the model by Dijkstra et al. (1993) over the models by Brody
et al. (1923), Wood (1967), Rook et al. (1993) and by Pollott
(2000) for lactations of animals on more technological farms.
The model by Dijkstra et al. (1993) showed a higher percentage
of convergence in the high production subgroups than the low
and medium production subgroups. This may have occurred
because of the smaller number of data per lactation in the low
and medium production subgroups compared to the high
production subgroups (10 vs 20 data, respectively).
Lactation curve modelItem Brody et al. Brody et al. Wood Cobby & Wilmink Rook et al. Dijkstra et al. Pollott
(1923) (1924) (1967) Le Du (1978) (1987) (1993) (1993) (2000)
High milk production of first lactation number1,2
Coefficient of 0.455c 0.671b 0.750ab 0.699ab 0.756ab 0.761ab 0.790a
determination (0.240) (0.140) (0.127) (0.140) (0.137) (0.113) (0.115)
Mean square error 9.710a 4.951b 3.909b 4.618b 3.789b 4.104b 3.335b
(7.240) (2.462) (2.314) (2.304) (2.362) (2.534) (2.418) Mean square prediction 8.293a 4.214b 3.328bc 3.937bc 3.228bc 3.288bc 2.690c
error (6.356) (2.106) (1.985) (1.996) (2.044) (2.001) (2.001)
Bayesian information 108.451a 95.444ab 90.536b 94.254b 89.670b 95.592ab 89.933b criterion (20.949) (16.071) (16.956) (18.030) (17.656) (15.267) (20.349)
Convergence percentage 92.1 84.2 97.4 89.5 97.4 39.5 78.9
High milk production of second lactation number1,2
Coefficient of 0.586c 0.758b 0.807ab 0.773ab 0.805ab 0.867a 0.863a
determination (0.234) (0.176) (0.118) (0.166) (0.116) (0.070) (0.093)
Mean square error 14.934a 7.704b 6.220bc 7.102bc 6.309bc 4.338bc 4.224c (9.080) (6.467) (4.672) (5.188) (4.025) (2.268) (2.573) Mean square prediction 12.676a 6.537b 5.278bc 6.028b 5.357bc 3.451bc 3.385c
error (7.696) (5.456) (3.938) (4.390) (3.416) (1.754) (2.077)
Bayesian information 115.622a 101.479b 97.819b 10.566b 98.664b 95.590b 95.012b criterion (17.806) (17.710) (16.918) (16.919) (17.120) (13.039) (16.610)
Convergence percentage 91.4 91.4 97.1 94.3 97.1 31.4 74.3
High milk production of third or greater lactation number1,2
Coefficient of 0.612b 0.773a 0.810a 0.795a 0.808a 0.812a 0.824a 0.874a
determination (0.227) (0.150) (0.149) (0.149) (0.148) (0.169) (0.162) (0.115)
Mean square error 18.425a 10.070b 8.225bc 8.760b 8.208bc 7.732bc 7.080bc 5.046c
(12.547) (7.878) (7.016) (6.806) (6.958) (9.591) (8.007) (2.528)
Mean square prediction 15.492a 8.480b 6.933b 7.371b 6.924b 6.101bc 5.603bc 3.437c
error (10.521) (6.660) (5.943) (5.763) (5.898) (7.582) (6.356) (1.671)
Bayesian information 114.466a 102.872b 99.080b 100.309b 99.609b 98.943b 98.813b 101.289b
criterion (16.105) (14.876) (14.978) (14.275) (14.614) (14.578) (15.375) (9.599)
Convergence percentage 97.9 93.6 93.6 95.7 89.4 40.4 61.7 38.3
1 Values in parenthesis = standard deviation. 2 C% = convergence percentage; BIC = Bayesian information criterion; R2 = coefficient of determination; MSE = mean square
error; MSPE = mean square prediction error.
Another reason that may have led to the lower
convergence of the model by Dijkstra et al. (1993) in low and
medium milk production subgroups was that the peak day
was closer to the beginning of lactation. The model by
Dijkstra et al. (1993) showed higher estimates of the peak
day than those of the other models, in all the subgroups. A
similar result was reported by Val-Arreola et al. (2004).
Therefore, it is possible that the model by Dijkstra et al.
(1993) is more suitable to represent lactations whose peak
day occurs on a day farther from the beginning of lactation
(Figure 3).
At first, the model by Dijkstra et al. (1993) has two
advantages over the model by Wood (1967), namely, the
precise biological meaning of the parameters and the
value of the intercept that is not nil. The model by
Dijkstra et al. (1993) was conceived under a mechanistic
basis similar to that of the model by Brody et al. (1924),
in which milk production is the function of the number of
producer cells present in the mammary gland parenchyma
during lactation, which is a result of the dynamic
relationship between the new cell differentiation and
differentiated cell death.
In the model by Dijkstra et al. (1993), the
a
parameter
represents the theoretical initial milk production and is
a
product of the number of differentiated parenchyma cells
and milk production per cell that is assumed as being
constant during lactation. The
b
parameter represents the
cell proliferation rate at birth; the
c
parameter the rate of
decrease in cell proliferation during lactation, and the d
parameter, the cell death rate during lactation.
Although the value of the
a
parameter in the model by
Dijkstra et al. (1993) represents exactly the initial milk
production, it cannot be precisely considered
a
parameter
of scale, unlike the parameter in the model by Wilmink (1987)
because modifications in its value produce alterations in
the shape of the lactation curve.
Figure 3 - Lactation curve and selected lactation curve models that showed a good adjustment for the data of the H1, H2 and H3 subgroups.H1 = high milk production (MP) and first lactation number (LN); H2 = high MP and second LN; and H3 = high MP and third or greater LN, y = milk production (L/day), x = days in milking.
Conclusions
In groups of herd farms of low milk production, the
model by Wilmink (1987) shows a better adjustment for
cows of the first lactations numbers, while the model by
Wood (1967) shows a better fit for cows of the second and
third or greater lactation numbers. The two lactation curve
models can be applied to milk production simulation
systems for cows of low milk production. The model by
Wood (1967) shows a better adjustment for cows of all the
lactation numbers of medium milk production group,
therefore it can be applied to milk production simulation
systems with cows with medium milk production. The
model by Dijkstra et al. (1993) shows a better adjustment
for cows of all lactation numbers in the high milk production
group, being able to be applied for milk production
simulation systems with cows of high milk production.
References
BRODY, S.; RAGSDALE, A.C.; TURNER, C.W. The rate of decline of milk secretion with the advance of the period of lactation. The Journal of General Physiology, v.5, p.442-444, 1 9 2 3 .
secretion following parturition. T h e J o u r n a l o f G e n e r a l Physiology, v.6, p.541-545, 1924.
COBBY, J.M.; LE DU, Y.L.P. On fitting curves to lactation data.
Animal Production, v.26, n.2, p.127-133, 1978.
DEMATAWEWA, C.M.B.; PEARSON, R.E.; VANRADEN, P.M. Modeling extended lactations of holsteins. Journal of Dairy Science, v.90, p.3924-3936, 2007.
DIJKSTRA, J.; FRANCE, J.; DHANOA. M.S. et al. A model describe growth patterns of the mammary gland during pregnancy and lactation. Journal of Dairy Science, v.80, p.2340-2354, 1997.
FARO, L.E.; ALBUQUERQUE, L.G. Comparação de alguns modelos matemáticos para o ajuste às curvas de lactação individuais de vacas da raça Caracu. Arquivos Brasileiros de Medicina Veterinária e Zootecnia, v.54, n.3, p.31-39, 2002. FERREIRA, E.B.; BEARZOTI, E. Comparação de métodos no ajustamento de curvas de lactação de bovinos por meio de simulação.
Ciência e Agrotecnologia, v.24, n.5, p.865-872, 2003. FERRIS, T.A.; MAO, I.L.; ANDERSON, C.R. Selecting for
lactation curve and milk yield in dairy cattle. Journal of Dairy Science, v.68, p.1438-1448, 1985.
FOX, D.G.; TILUTKI, T.P.; TEDESCHI, L.O. T h e n e t c a r b o h y d r a t e a n d p r o t e in system for evaluating herd n u t r i t i o n a n d n u t r i e n t e x c r e t i o n – C N C P S 5 . 0. Ithaca: The Cornell University, 2003. 202p.
GROSSMAN, M.; KOOPS, W.J. Multiphasic analysis of lactation curves in dairy cattle. Journal of Dairy Science, v.71, n.6, p.1598-1608, 1988.
HIGH PERFORMANCE SYSTEMS, INC. STELLA. A n introduction to systems thinking. New Hampshire: High Performance Systems, 2001. 165p.
PAPAJCSIK, I.A.; BODERO, J. Modeling lactation curves of friesian cow in a subtropical climate. Animal Production, v.47, n.2, p. 201-207, 1988.
POLLOTT, G.E. A biological approach to lactation curve analysis for milk yield. J o u r n a l o f D a i r y S c i e n c e, v.83, n.11, p.2448-2458, 2000.
RENNÓ, F.P.; PEREIRA, J.C.; LEITE, C.A.M. et al. Eficiência bioeconômica de estratégias de alimentação em sistemas de
produção de leite. 1. Produção por animal e por área. Revista Brasileira de Zootecnia, v.37, n.4, p.743-753, 2008a. RENNÓ, F.P.; PEREIRA, J.C.; LEITE, C.A.M. et al. Avaliação
bioeconômica de estratégias de alimentação em sistemas de produção de leite. 2. Metodologia alternativa: nível de utilização de capital. Revista Brasileira de Zootecnia, v.37, n.4, p.754-764, 2008b.
RENNÓ, F.P.; PEREIRA, J.C.; LEITE, C.A.M. et al. Eficiência bioeconômica de vacas de diferentes níveis de produção de leite por lactação e estratégias de alimentação. Revista Brasileira de Zootecnia, v.37, n.4, p.765-772, 2008c.
ROOK, A.J.; FRANCE, J.; DHANOA, M.S. On the mathematical description of lactation curves. Journal of Agriculture Science, v.121, p.97-102, 1993.
ROTZ, C.A. ; MERTENS, D.R.; BUCKMASTER, D.R. et al. A dairy herd model for use in whole farm simulations.Journal of Dairy Science, v.82, p.2826-2840, 1999.
ROTZ, C.A.; BUCKMASTER, D.R.; COMERFORD, J.W. A beef herd model for simulating feed intake, animal performance, and manure excretion in farm systems. Journal of Animal Science, v.83, p.231-242, 2005.
SCHNEEBERGER, M. Inheritance of lactation curve in swiss brown cattle. Journal of Dairy Science, v.64, p.475-483, 1981. STATISTICAL ANALISYS SYSTEM – SAS. User’s guide. Cary:
2003. 1496p.
THORNLEY, J.H.M.; FRANCE, J. Mathematical models in agriculture: a quantitative methods for the plant, animal and ecological sciences. 2.ed. Wallingford: CABI, 2007. 906p. VAL-ARREOLA, D.; KEBREAB, E.; DIJKSTRA, J.F.J. Study of
the lactation curve in dairy cattle on farms in Central Mexico.
Journal of Dairy Science, v.87, p.3789-3799, 2004. VARGAS, B.; KOOPS, W.J.; HERRERO, M. et al. Modeling extended
lactations of dairy cows. Journal of Dairy Science, v.83, n.13, p.1371-1380, 2000.
WILMINK, J.B.M. Adjustment of test-day milk, fat and protein yields for age, season and stage of lactation. L i v e s t o c k Production Science, v.16, p.335-348, 1987.
WOOD, P.D.P. Algebraic model of the lactation curve in cattle.