www.atmos-chem-phys.net/12/4477/2012/ doi:10.5194/acp-12-4477-2012
© Author(s) 2012. CC Attribution 3.0 License.
Chemistry
and Physics
Size-resolved measurement of the mixing state of soot in the
megacity Beijing, China: diurnal cycle, aging and parameterization
Y. F. Cheng1,2,7, H. Su3, D. Rose3, S. S. Gunthe3,*, M. Berghof2, B. Wehner2, P. Achtert2, A. Nowak2, N. Takegawa4, Y. Kondo5, M. Shiraiwa3,**, Y. G. Gong6, M. Shao1, M. Hu1, T. Zhu1, Y. H. Zhang1, G. R. Carmichael7,
A. Wiedensohler2, M. O. Andreae3, and U. P¨oschl3
1College of Environmental Sciences and Engineering, Peking University, Beijing 100871, China 2Leibniz Institute for Tropospheric Research, Leipzig 04318, Germany
3Biogeochemistry Department, Max Planck Institute for Chemistry, Mainz 55020, Germany 4Research Center for Advanced Science and Technology, the University of Tokyo, Tokyo, Japan
5Department of Earth and Planetary Science, Graduate School of Science, the University of Tokyo, Tokyo 1130033, Japan 6Research Institute of Chemical Defence, Beijing 102205, China
7Center for Global and Regional Environment Research, University of Iowa, IA 52242, USA
*now at: EWRE Division, Department of Civil Engineering, Indian Institute of Technology Madras, Chennai 600036, India **now at: Department of Chemical Engineering, California Institute of Technology, Pasadena, USA
Correspondence to:H. Su ([email protected])
Received: 4 November 2011 – Published in Atmos. Chem. Phys. Discuss.: 7 December 2011 Revised: 19 April 2012 – Accepted: 4 May 2012 – Published: 22 May 2012
Abstract.Soot particles are the most efficient light absorbing aerosol species in the atmosphere, playing an important role as a driver of global warming. Their climate effects strongly depend on their mixing state, which significantly changes their light absorbing capability and cloud condensation nu-clei (CCN) activity. Therefore, knowledge about the mixing state of soot and its aging mechanism becomes an important topic in the atmospheric sciences.
The size-resolved (30–320 nm diameter) mixing state of soot particles in polluted megacity air was measured at a sub-urban site (Yufa) during the CAREBeijing 2006 campaign in Beijing, using a volatility tandem differential mobility ana-lyzer (VTDMA). Particles in this size range with non-volatile residuals at 300◦C were considered to be soot particles. On average, the number fraction of internally mixed soot in total soot particles (Fin), decreased from 0.80 to 0.57 when ini-tialDpincreased from 30 to 320 nm. Further analysis reveals that: (1)Finwas well correlated with the aerosol hygroscopic mixing state measured by a CCN counter. More externally mixed soot particles were observed when particles showed more heterogeneous features with regard to hygroscopicity. (2) Fin had pronounced diurnal cycles. For particles in the accumulation mode (Dpat 100–320 nm), largestFinwere
ob-served at noon time, with “apparent” turnover rates (kex→in) up to 7.8 % h−1. (3)Finwas subject to competing effects of both aging and emissions. While aging increasesFinby con-verting externally mixed soot particles into internally mixed ones, emissions tend to reduce Fin by emitting more fresh and externally mixed soot particles. Similar competing ef-fects were also found with air mass age indicators. (4) Un-der the estimated emission intensities, actual turnover rates of soot (kex→in) up to 20 % h−1were derived, which showed a pronounced diurnal cycle peaking around noon time. This result confirms that (soot) particles are undergoing fast ag-ing/coating with the existing high levels of condensable va-pors in the megacity Beijing. (5) Diurnal cycles ofFinwere different between Aitken and accumulation mode particles, which could be explained by the faster growth of smaller Aitken mode particles into larger size bins.
as [NOz]/[NOy], [E]/[X] ([ethylbenzene]/[m,p-xylene]) and ([IM] + [OM])/[EC] ([inorganic + organic matter]/[elemental carbon]), respectively. Such a parameterization consumes lit-tle additional computing time, but yields a more realistic de-scription ofFincompared with the simple treatment of soot mixing state in regional/global models.
1 Introduction
Soot particles are generally regarded as the most efficient light absorbing component of atmospheric aerosols (Rosen et al., 1979; Japar et al., 1986; Horvath, 1993; Bergstrom et al., 2007). They are produced by incomplete combustion of fossil fuel and biomass and they consist mainly of black or elemental carbon but may also contain some refractory organic matter (Horvath, 1993; Smith and O’Dowd, 1996; Burtscher et al., 2001; Novakov et al., 2003; P¨oschl, 2005; Sadezky et al., 2005; Andreae and Gelencs´er, 2006; Kondo et al., 2006, 2010; Rose et al., 2006; Frey et al., 2008; Cheng et al., 2009; Wehner et al., 2009). In the atmospheric sci-ence literature, the terms black carbon (BC), elemental car-bon (EC), pyrogenic carcar-bon are frequently used as synonyms for soot (e.g., Kondo et al., 2006, 2009; P¨oschl et al., 2010). More discussion on this topic can be found in Andreae and Gelencs´er (2006).
Soot particles, after emission, generally undergo aging processes by condensation (Smith et al., 1989), coagulation (Riemer et al., 2004, and references therein), as well as ox-idation (Ivleva et al., 2007) and cloud/fog processing; and gradually become internally mixed (coated) with other chem-ical compounds. Depending on their mixing state, soot par-ticles can be classified as internally mixed (coated) or exter-nally mixed (uncoated). The mixing state of soot particles has a great influence on their climate effects. The light absorb-ing capability of soot (related to its direct radiative effects) can be enhanced by a factor of 1.5 to 3 when soot is coated by or internally mixed with other aerosol components in-cluding sulfate, nitrate, organics and water (Jacobson, 2000; Lesins et al., 2002; Bond et al., 2006; Cheng et al., 2006, 2008a, b, 2009; Shiraiwa et al., 2008, 2010). Moreover, the coating of soot particles can significantly enhance their abil-ity to be activated as cloud condensation nuclei (CCN) (Rose et al., 2011) and hence influence cloud formation processes (related to their indirect radiative effects) and the removal of soot particles from the atmosphere. For these reasons, the mixing state is a crucial parameter for soot particles, uncer-tainty about which has made it difficult to accurately assess its climatic impact (Jacobson, 2001).
In global/regional climate models, the turnover rate (kex→in) is used to describe the conversion rate of ex-ternally mixed to inex-ternally mixed soot particles. Due to limited knowledge and computational limits, a constant kex→in was assumed in most studies, varying from 1.25 to
2.5 % h−1 (Cooke and Wilson, 1996; Cooke et al., 1999, 2002; Lohmann et al., 2000; Jacobson, 2001; Koch, 2001). To obtain a more realistic kex→in, several aerosol model-ing studies have been carried out to examine quantitatively kex→in of soot particles (Riemer et al., 2004, 2010). How-ever, it is challenging to validate the modeling results against atmospheric conditions, since modeling of the soot mixing state is almost equivalent to modeling all physico-chemical processes in the gas and aerosol phases.
Decades ago, information about the soot mixing state re-lied on particle morphology measurements by Transmission Electron Microscopy (Katrinak et al., 1992, 1993; Hasegawa and Ohta, 2002). This technique does not always give reliable information, as volatile coatings may be lost, or thin coat-ings may not be evident. Later on, several online instruments with high time resolution were developed, i.e., volatility tandem differential mobility analyzer (VTDMA) (Philippin et al., 2004), single particle soot photometer (SP2) (Stephens et al., 2003) and aerosol time-of-flight mass spectrometer (ATOFMS) (Moffet and Prather, 2009). Among these meth-ods, only the VTDMA is able to detect particle smaller than 0.1 µm. Based on these online methods, several field studies have been carried out in recent years at regional (Engler et al., 2007), suburban (Shiraiwa et al., 2007; Cheng et al., 2009; Wehner et al., 2009), and urban sites (Rose et al., 2006), and by aircraft measurements (Moteki et al., 2007). The aging of soot particles was found to be well correlated with several air mass age indicators, e.g., ratios of C2H4to C2H2(Moteki et al., 2007), 2-pentyl nitrate (2-PeONO2) ton-pentane (n -C5H12) (Shiraiwa et al., 2007) and OC to EC (organic car-bon/elemental carbon) (Cheng et al., 2006). Under certain assumptions on the air mass history and OH concentrations, rates of change ofFin(number fraction of internally mixed soot particles) around 1 to 2.3 % h−1 were derived (Moteki et al., 2007; Shiraiwa et al., 2007).
2 Methods
2.1 Overview of the campaign
As part of the “Campaign of Air Quality Research in Bei-jing and Surrounding Region 2006” (CAREBeiBei-jing 2006), air pollutants including aerosol and gases were compre-hensively measured at a suburban site, Yufa (39.51467◦N, 116.30533◦E,∼25 m above ground level), during the sum-mer of 2006. The Yufa site is located in the south of Beijing, roughly 50 km away from the urban center. One major road passes east of the measurement site, at a distance of less than 200 m. Figure S1 (in the Supplement) shows the meteorolog-ical conditions at the Yufa site from 15 August to 9 Septem-ber. During this period, the averages (±one standard devia-tion) of temperature, relative humidity (RH) and wind speed were 26.2±3.7◦C, 68±17 % and 1.6±1.4 m s−1, respec-tively (based on 5-min resolution meteorological data, see Supplement Fig. S1).
2.2 VTDMA measurement
A volatility tandem differential mobility analyzer (VTDMA) (Orsini et al., 1996; Philippin et al., 2004) was used to mea-sure the number size distributions of the non-volatile residu-als of pre-selected mono-disperse particles that were heated at 300◦C (7 selected particle diameters in the range of 30 to 320 nm; time resolution of 1 h for a complete cycle of 7 diameters). In the thermal chamber (i.e., at 300◦C) of the VTDMA, the coating materials undergo volatilization leav-ing behind the non-volatile cores. Details about the VTDMA measurements at the Yufa site in 2006 can be found in Cheng et al. (2009) and Wehner et al. (2009). The volatilization results in a change of particle size, where unchanged parti-cles indicate no coating material while big changes indicate a large fraction of coating materials. In continental polluted megacity air, the material of sub-micrometer particles that is non-volatile at this temperature (i.e., 300◦C) is considered to be mostly “soot” (Smith and O’Dowd, 1996; Burtscher et al., 2001; Kondo et al., 2006, 2010; Rose et al., 2006; Frey et al., 2008; Cheng et al., 2009; Wehner et al., 2009), which consists mainly of black or elemental carbon but may also contain some refractory organic matter (P¨oschl, 2005; Sadezky et al., 2005; Andreae and Gelencs´er, 2006). Since the VTDMA actually measures non-volatile-core containing particles (NVP), the notation “soot (NVP)” was mostly used instead of “soot” when referring to the VTDMA results.
In VTDMA measurements, the size distribution of non-volatile residuals is classified into three groups according to Dp,300◦C/Dp, where Dp is the initial diameter of the sampled dry particles and Dp,300◦C is the diameter of the particle residual after being heated at 300◦C. Following Wehner et al. (2009), (1) particles with Dp,300◦C/Dp< 45 % were denoted as “high-volatile” and not considered as soot particles; (2) particles with 45 %< Dp,300◦C/Dp<
82 % were denoted as “medium-volatile” and considered as internally mixed (coated) soot particles; and (3) Particles with 82 %< Dp,300◦C/Dp were denoted as “low-volatile” and considered as externally mixed (uncoated) soot particles. Fin, the number fraction of internally mixed soot particles (among all soot-containing particles), was intensively used for discussion in this paper and calculated as,
Fin=nin/(nin+nex) (1)
wherenin is the number concentration of internally mixed soot (NVP) particles, andnexis the number concentration of externally mixed soot (NVP) particles.
2.3 The turnover rate of soot particles
The turnover rate,kex→in, can be used to describe the con-version/aging rate of the externally mixed soot to internally mixed particles. It is defined as the rate of percentage change of externally mixed soot particles due to conversion/aging processes (Eq. 2).
∂nex ∂t
ex→in
= −kex→innex (2) where(∂nex/∂t )ex→inis the rate of change ofnexdue to con-version/aging processes.
In case condensation dominates the conversion,ntot, the number concentration of total (ex + in) soot particles can be considered as a constant. Dividing Eq. (2) byntot, we have
∂Fin ∂t
ex→in
=kex→in(1−Fin) (3) Thekex→in, however, can’t be directly solved by substitut-ingnexorFinobtained from field measurements into Eqs. (2) or (3). This is because the observed changes of nex and Fin are subject to multiple processes in the atmosphere, in-cluding horizontal/vertical transport (subscribed by “Tran”), emissions (subscribed by “Emis”), deposition (subscribed by “Depo”), condensation (subscribed by “Cond”) and coagula-tion (subscribed by “Coag”) as in Eq. (4).
∂Fin ∂t =
aging(ex→in)
z }| {
∂Fin ∂t
Cond
+
∂Fin ∂t
Coag
+
∂Fin ∂t
Tran
+
∂Fin ∂t
Emis
+
∂Fin ∂t
Depo
(4) in whichFincould also be replaced bynexornin.
et al., 2008; Wiedensohler et al., 2009). Therefore, we as-sume that∂Fin/∂tis mainly controlled by the condensational aging process (“Cond”) and emissions (“Emis”) while other processes are supposed to be unimportant and not considered in this study.
When the emission term in Eq. (4) is also neglected, an “apparent” turnover rate can be determined by kex→in= (1Fin/1t )/(1−Fin), which attributes all variations inFinto an “apparent” conversion process. In previous studies, “ap-parent” kex→in of 1.3–5.8 % h−1 has been reported, corre-sponding to(1Fin/1t )of 1.0–2.3 % h−1andFinof 0.2–0.6 (Moteki et al., 2007; Shiraiwa et al., 2007).
2.4 CCN measurement and hygroscopicity (κ) distribution
Size-resolved CCN efficiency spectra (activation curves) were measured with a Droplet Measurement Technologies continuous flow CCN counter (DMT-CCNC) coupled to a differential mobility analyzer (DMA; TSI 3071) and a con-densation particle counter (CPC; TSI 3762). The CCNC was operated at a total flow rate of 0.5 l min−1with a sheath-to-aerosol flow ratio of 10. The effective water vapor supersat-uration (S) was regulated by the temperature difference be-tween the upper and lower end of the CCNC flow column (1T) and calibrated with ammonium sulfate aerosol as de-scribed by Rose et al. (2008).
For each CCN measurement cycle,1T was set to 5 dif-ferent levels (2.0–11.9 K) corresponding toS values in the range of 0.07–0.86 %. For each1T and the respectiveS, the diameter of the dry aerosol particles selected by the DMA (Dp) was set to 9 different values in the range of 20–290 nm depending on the supersaturation selected. At eachDp, the number concentration of total aerosol particles (condensa-tion nuclei, CN),NCNwas measured with the CPC, and the number concentration of CCN,NCCN, was measured with the CCNC. The integration time for each measurement data point was 30 s, the recording of a CCN efficiency spectrum took∼16 min (including a 50 s adjustment time for each new particle size and 4 min for adjustment to the next supersatu-ration level), and the completion of a full measurement cycle comprising CCN efficiency spectra at 5 different supersatu-ration levels took∼85 min (including 5 min of settling time for the changeover from highest to lowestS). For a detailed description of CCN measurements in the campaign, see Gun-the et al. (2011).
Size-resolved CCN efficiency spectra can be used to derive the cumulative distribution function of particle hygroscopic-ity,H(κ, Dp), which is defined as the number fraction of particles with a given dry diameter,Dp, and with an effective hygroscopicity parameter smaller than the parameterκ (Pet-ters and Kreidenweis, 2007; Su et al., 2010). The data pair of DpandNCCN/NCNin a CCN spectrum can be converted to a corresponding data pair ofκ andH(κ,Dp) by solving the
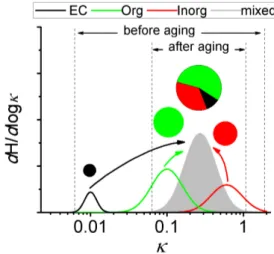
Fig. 1. Evolution of the mixing state and hygroscopicity (κ) in the aging process. Solid lines refer to dH /d logκ, the normalized number distributions of particle hygroscopicity. The areas of the pie diagrams refer to the abundance of individual chemical com-ponents (EC: elemental carbon, Org: organics, Inorg: inorganics). After aging, the externally mixed particles become internally mixed (coated).
κ-K¨ohler model equation (refer to Eqs. (21) and (22) in Su et al., 2010).
By fittingH (κ,Dp) with a cumulative single-mode log-normal distribution function, the following parameters were calculated:κg, the geometric mean ofκ in the fitted mode; andσκ,g, the geometric standard deviation ofκ in the fitted mode. The spread of theκdistribution, e.g.,σκ,g, reflects the mixing state of aerosols: under internally mixed conditions, all particles have the same composition and a uniform hy-groscopicity mode, while under externally mixed conditions, particles can have distinct hygroscopicity modes (see Fig. 1).
2.5 Air mass age indicator
The aging of soot particles results in a change of their mix-ing state, i.e., conversion of externally mixed to internally mixed soot. An aged air mass has a larger fraction of inter-nally mixed soot than a fresh air mass. Therefore, correla-tions can be expected between an air mass age indicator and the soot mixing state parameter (e.g.,Fin). If such a correla-tion is significant, the soot mixing state could be parameter-ized by the air mass age indicators.
The age of air mass is a concept under the Lagrangian sys-tem. Ideally, the most fresh air mass is assigned an age of zero and its age will increase as the air mass becomes aged. The longer the air mass travels in the atmosphere, the older it will be. However, this does not mean that the age of an air mass can become infinitely large as injection of fresh emis-sions into the air mass would reduce its age.
Table 1.Statistics ofFinat different diameters (429 data points).
Fin 30 nm 50 nm 100 nm 150 nm 200 nm 260 nm 320 nm
Arithmetic mean 0.80 0.74 0.70 0.64 0.60 0.62 0.57
Standard deviation 0.075 0.078 0.084 0.090 0.100 0.100 0.102
parameters reflecting such changes can indicate the aging stage. Three indicators were used in this study.
[NOz]/[NOy]
In a fresh air mass from combustion sources, NOx (NOx=NO+NO2) are the dominant components of NOy (the total odd nitrogen compounds in the atmosphere). As photochemical reactions proceed, NOx evolves to other N-containing compounds such as HNO3and PAN, and the ra-tio of [NOz]/[NOy] (NOz=NOy−NOx) will increase (Parrish et al., 1992; O’Brien et al., 1997). In this study, the nitrogen oxides (NOx) and total reactive nitrogen (NOy) were mea-sured using a NO-O3chemiluminescence detector combined with a photolytic converter and a gold tube catalytic con-verter (Takegawa et al., 2006)
[E]/[X]
The ratios of hydrocarbons have been used as measures of photochemical age since Calvert (1976). Different reactiv-ities of hydrocarbons result in different removal rates and monotonic change of their ratios in the aging process. We used the ratio of ethylbenzene and m,p-xylene ([E]/[X]) in this study. Ethylbenzene and m,p-xylene were measured by an online GC-PID (gas chromatograph-photo ionization de-tector) system, as detailed by Xie et al. (2008).
([IM] + [OM])/[EC]
As an air mass ages, more secondary aerosol is pro-duced, which reduces the mass fraction of soot particles. ([IM] + [OM])/([EC]) could hence be used as an indicator (Cheng et al., 2006), in which
[IM]=[NH+4] + [NO3−] + [SO24−] + [Cl−](inorganic ions in PM1 measured by aerosol mass spectrometer, AMS) and [OM] was the organic matter mass (in PM1) determined by AMS. An online Sunset EC/OC analyzer was used to measure the mass concentrations of EC, [EC]. Details about the EC/OC analyzer and AMS can be found in Takegawa et al. (2009).
3 Results and discussion
3.1 The mixing state of soot and hygroscopicity
Table 1 summarizes statistics ofFinmeasurements from this campaign. TheFinvalues show a decreasing trend as the par-ticle sizeDpincreases, ranging from anFinof 0.80±0.075
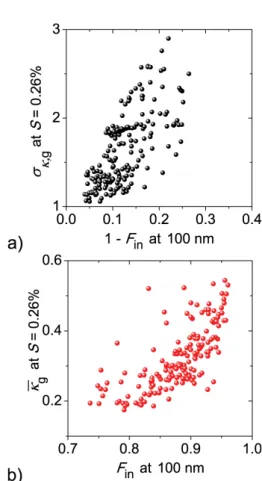
Fig. 2.Comparison of aerosol hygroscopicity and soot (NVP) mix-ing state parameters durmix-ing the CAREBeijmix-ing-2006 campaign. The parametersκgandσκ,gwere calculated from the aerosol hygroscop-icity (i.e.,κ) distribution measured at supersaturationS=0.26 % (Su et al., 2010); andFinwas determined for particles of diameters at 100 nm by the VTDMA measurements. Note that the mean ac-tivation diameter observed atS=0.26 % is 85 nm (Gunthe et al., 2011).
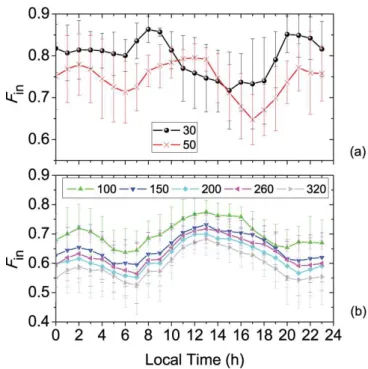
Fig. 3.Average diurnal variation ofFinat different size bins (30, 50, 100, 150, 200, 260, and 320 nm). Symbols represent arith-metic mean values and error bars represent the standard deviation. Since transport might significantly affect the evolution ofFin, days with average wind speed>2 m s−1(20, 22 August, 3, 4, 5, 6 and 8 September) were completely removed from the statistics.
confidence about the robustness of both parameters and the reliability of the measuring systems.
During the CAREBeijing campaign, positive correlation between hourlyκgandFinwas also found (Fig. 2b) as a re-sult of their concurrent increase during the aging process. The increasedκg can be attributed to the increase of frac-tion of inorganic matter (IM) in aerosol particles. The IM is in general more hygroscopic and CCN-active than the rest of the aerosol chemical species (P¨oschl, 2011; Rose et al., 2011). The increase of IM fraction leads to a corresponding increase of the overall aerosol hygroscopicity and henceκg, which represents an averaged hygroscopicity of aerosols (Su et al., 2010).
3.2 Diurnal cycle of the soot mixing state
Figure 3 shows a pronounced diurnal cycle ofFin, which also has a strong size dependence. For accumulation mode parti-cles (i.e., 100 nm to 320 nm, Fig. 3b), similar diurnal profiles ofFin can be found, with a maximum at∼13:00 LT (local time) and two minimums, in the early morning∼07:00 LT and at night∼21:00 LT, respectively. As the day progresses, an increase inFin(08:00–13:00 LT) is observed for accumu-lation mode particles with “apparent” turnover rates of 6.7– 7.8 % h−1.
Table 2.Correlation matrix ofFinat different diameters (429 data points).
R 30 nm 50 nm 100 nm 150 nm 200 nm 260 nm 50 nm 0.49
100 nm −0.12 0.40 150 nm −0.09 0.25 0.86
200 nm −0.04 0.24 0.73 0.93
260 nm −0.01 0.24 0.65 0.87 0.95
320 nm 0.00 0.28 0.58 0.80 0.89 0.94
Fig. 4.Averaged diurnal variation of [NOz]/[NOy], [E]/[X] and ([IM] + [OM])/[EC]. Symbols represent arithmetic mean values and error bars represent the standard deviation.
In the Aitken mode, however, the variation ofFin is dif-ferent to that in the accumulation mode (Fig. 3a). The max-imum of Fin appears earlier at∼08:00 LT (atDp=30 nm) and 12:00 LT (atDp=50 nm), and the afternoon minimum Finappears earlier as well. The distinct behaviors of Aitken mode particles are shown by the correlation matrix in Ta-ble 2, whereFinof Aitken mode particles show poor correla-tions with the accumulation mode particles. The reasons for such correlations will be further discussed in Sect. 3.5.
For accumulation mode particles presented in Fig. 3b,Fin shows a peak around noon time. Such a diurnal cycle indi-cates that ground-based measurements were subject to com-peting effects from physico-chemical aging and the introduc-tion of fresh emissions. While the aging increases Fin by turning externally mixed particles into internally mixed ones, the fresh emissions, with lowFin, tend to reduce theFin val-ues. Similar competing effects can also be found in the diur-nal courses of the air mass age indicators (e.g.,[NOz]/[NOy],
Fig. 5. Diurnal variation of normalized parameters: (a) emission rates of EC,(∂[EC]/∂t )Emis, which is assumed the same as CO emission rates in Beijing (green dashed lines); (b) EC concentra-tions measured by an online Sunset EC/OC analyzer (red dotted lines); and (c) ratio of emission rate to EC concentration (black solid lines). All parameters are normalized by their diurnal means, respectively. Shaded areas represent the time period of 08:00– 19:00 LT when vertical mixing is supposed to significantly affect EC concentrations.
3.3 Estimation of soot emission rate
Emissions have a significant impact on the measuredFinand the “apparent”kex→in(soot turnover rate). Before determin-ing the actualkex→in, we need to first quantify the emissions. The emission rate can be divided into a diurnal profile de-scribing its relative variation and the absolute value of any point on this profile. In this study, we adopt the diurnal profile of CO (carbon monoxide) emissions in Beijing areas (Zhou et al., 2010) and assume that soot emissions have a simi-lar diurnal pattern. Then measured EC loadings are used to estimate the absolute emission rate at certain period during night-time. With these two kinds of information, the whole emission profile can be quantified.
Note that the emission rate is often expressed as a flux in mass per area per time while its impact on EC concentrations, (∂[EC]/∂t )Emis, has a unit of mass per volume per time. From the aspect of Eulerian grid models, the diurnal profile (relative variation) of the emission flux and(∂[EC]/∂t )Emis is the same while their absolute values differ by a factor of the grid height.
Figure 5 shows the diurnal profile of the emission rate (∂[EC]/∂t )Emis used in this study. To estimate its absolute values, we tried to find a time period when the concentra-tion variaconcentra-tion is dominated by emissions, i.e., ∂[EC]/∂t≈
(∂[EC]/∂t )Emis. The EC concentration is also shown in Fig. 5. It is clear that [EC] is not always increasing though (∂[EC]/∂t )Emisis always positive. This is because transport plays an important role on the diurnal variation of [EC].
To minimize the impact of transport and obtain an optimal estimate on absolute values of(∂[EC]/∂t )Emis, we take the following criteria, eliminating days with average wind speed >2 m s−1 (20, 22 August, 3, 4, 5, 6 and 8 September), ex-cluding time periods with strong vertical mixing (from 08:00 to 19:00 LT), and choosing periods with largest ratio of nor-malized (∂[EC]/∂t )Emis to [EC] (at 20:00 LT). The reason for choosing low wind speeds and night-time periods is to minimize the impact of horizontal and vertical transport pro-cesses on [EC]. Large ratios of(∂[EC]/∂t )Emis/[EC] ensures that the emission term dominates the variation of [EC].
Finally, 1[EC]/1t at 20:00 (∼0.89 µg m−3h−1) was taken as an optimal estimation of(∂[EC]/∂t )Emisat 20:00. It was then used to calculate(∂[EC]/∂t )Emis for the rest of the day by applying the diurnal profile in Fig. 5. Table 3 summa-rizes the diurnal variation of the measured [EC] and the cal-culated(∂[EC]/∂t )Emis. The mean emission rate is∼13 % of the mean soot concentration per hour (13 % h−1).
3.4 Actual turnover rate of soot
In this section, a conceptual model is used to analyze the observed variation ofFin. SinceFin of particles of all sizes in the accumulation mode (i.e., 100–320 nm) showed similar behaviors,Finat 150 nm is taken as an example and will be discussed through this section.
Two processes are considered in the model: emissions and the condensational aging process that converts equal amounts of externally mixed particles into internally mixed particles. We also assume that all (or most) particles stay in the same size bin after the 1-h aging process. This assumption, to a large extent, simplifies the following analysis, and could at least be valid for a broader size bracket, e.g., [100 nm, 350 nm]. The transport and dry deposition processes are sup-posed not to significantly changeFin(assumingninandnex have the same gradient and dry deposition velocity) and are therefore ignored in this analysis.
Then the variation of Fin in the time interval1t can be derived by Eq. (5):
1Fin= nin+
∂nin
∂t
ex→in+
∂nin ∂t
Emis ntot+
∂ntot
∂t
Emis
−Fin
=
nin+kex→innex+β
∂ntot ∂t
Emis ntot+
∂ntot
∂t
Emis
−Fin (5)
Table 3.Mean diurnal variation of [EC] (EC concentrations) and(∂[EC]/∂t )Emis(emission rates).
Time [EC] (∂[EC]/∂t )Emis (∂[EC[]EC/∂t )] Emis Time [EC] (∂[EC]/∂t )Emis
(∂[EC]/∂t )Emis
[EC] h µg m−3 µg m−3h−1 % h−1 h µg m−3 µg m−3h−1 % h−1
0 6.1 0.191 3.1 12 3.9 0.954 24.5
1 5.8 0.120 2.1 13 3.1 1.092 35.2
2 6.3 0.088 1.4 14 2.7 0.952 35.3
3 6.7 0.074 1.1 15 2.7 0.856 31.7
4 7.2 0.058 0.8 16 2.6 1.114 42.8
5 7.7 0.108 1.4 17 2.8 1.168 41.7
6 8.3 0.407 4.9 18 2.7 0.986 36.5
7 8.0 0.832 10.4 19 3.3 1.052 31.9
8 7.5 0.934 12.5 20 4.4 0.894 20.3
9 7.8 1.022 13.1 21 5.1 0.564 11.1
10 5.1 1.020 20.0 22 5.7 0.495 8.7
11 4.4 1.052 23.9 23 6.1 0.232 3.8
Fig. 6.The actual turnover rate of soot (NVP),kex→in, assuming different emission factorsβ(number fraction of internally mixed soot particles to total soot particles in the emissions).
Dividing the numerator and fraction of the first term on the right-hand side of Eq. (5) byntot, we have
1Fin=
Fin+kex→in(1−Fin)+β[n1tot
∂n
tot ∂t
Emis ]
1+ [n1 tot
∂ntot ∂t
Emis]
−Fin (6)
Assuming n1
tot(∂ntot/∂t )Emis= 1
[EC](∂[EC]/∂t )Emis (see Ta-ble 3),kex→inbecomes the only unknown parameter and can be calculated by solving Eq. (6).
Figure 6 shows the diurnal cycles of campaign-averaged kex→in calculated for particles at 150 nm with different β. Compared to a fixedkex→invalue commonly used in regional and global models, the observation-constrainedkex→inshows higher values with a maximum around 11:00–15:00 LT, and low values in the early morning and late afternoon. Such a di-urnal cycle always holds, even after varying(∂[EC]/∂t )Emis by a factor of two (see Fig. S2). The cycle of the turnover
rate, kex→in, supports previous results in modeling stud-ies (Riemer et al., 2004, 2010), which show high day-timekex→in dominated by condensation processes, and low kex→in resulting from both slower condensation and coag-ulation processes in the early morning and late afternoon. Although kex→in for night-time periods are also presented in Fig. 6, these night-time values require caveats because the coagulation-induced aging could become more important than the condensation during night-time (Riemer et al., 2004, 2010), which violates our assumption onkex→incalculations. Since the condensation-induced turnover rate is propor-tional to the condensable vapor pressure, the derived day-timekex→inimplies a peak of condensable vapor pressure at the same period (11:00–15:00 LT). It is already known that gaseous sulfuric acid (precursor of sulfate in particles) often shows a peak around noon. Our results indicate that even the potentially present un-identified condensable vapors might have similar diurnal cycles as sulfuric acid. Instead of com-plete characterizations of these un-identified vapors, the sim-ilarity in their diurnal variations enables the use of a simple parameterization method as an alternative solution in aerosol modeling studies, as will be discussed below.
Due to the presence of primary emission sources, the ac-tual turnover rate of soot, kex→in is higher than the “ap-parent”kex→in. The freshly emitted particles contain more externally mixed soot than the aged ambient air. The ob-served “aging” of soot (NVP) is to a certain extent compen-sated by the fresh emissions, the extent of which depends on the emission intensity. For the estimated emission intensity, (∂[EC]/∂t )Emis/[EC]of 13 % h−1 andβ=0.6,kex→in val-ues reached up to 20 % h−1(see Fig. 6), much faster than the “apparent”kex→inof 6.7–7.8 % h−1.
2001; Koch, 2001; Tsigaridis and Kanakidou, 2003; Riemer et al., 2004). The fast turnover rate in the polluted megacity air is consistent with the observed rapid particle growth in the same area (Wiedensohler et al., 2009), both of which can be attributed to the fast formation and condensation of sec-ondary aerosols in the megacity. The flow of soot particles from megacities influences the global background of soot to a large extent. If those soot particles are already coated or internally mixed in a very short time due to strong condensa-tion, the background soot should be mostly internally mixed, as has been suggested by Andreae and Rosenfeld (2008).
Figure 6 also shows that the absolute value of kex→in strongly depends on the choice of the emission factor β, while the relative variation of kex→in does not. Smaller β values (large fraction of externally mixed soot in emissions) require fasterkex→into explain the observedFinvariations. For example,β=0.2 requireskex→inup to 70 % h−1to meet the observations. On the other hand,kex→inup to 20 % h−1 require a largeβ=0.6, which means that 60 % of the emit-ted soot particles should have already been internally mixed when they arrive at the measurement site.
3.5 Distinct diurnal variations ofFinfor Aitken and accumulation mode particles
In the conceptual model, we assume that particle growth will not lead to significant change inntotandnex, which means no significant shift of the particle size distribution occurs over a short time. While such an assumption is valid for large par-ticles in the accumulation mode (i.e.,>100 nm), it might be violated by the faster growth of small particles (e.g., 30 nm) in the Aitken mode, which was reflected by the different di-urnal cycles ofFinat smaller diameters (see Fig. 3).
To describe the rate of change of a particle size distribution n(Dp) resulting from condensation, we adopted a general condensation equation (Seinfeld and Pandis, 2006, pp. 591) in the form
∂n n∂t = −
∂ n∂Dp
(n 4DM
RTDpρp
f (Kn, α)P ) (7)
wherendenotes the particle number concentration atDp,M is the molecular weight for the condensable species,Dis its diffusion coefficient in air,R is the molar gas constant,T is the temperature (in Kelvin),ρpis the density of the particles, P is the supersaturated vapor pressure of the condensable species,Knis the Knudsen number (Kn=2λ/Dp),λis the mean free path of the condensable species in air, andα is the accommodation coefficient of the condensable species. f(Kn,α) is the correction due to non-continuum effects and imperfect surface accommodation and can be calculated by
f (Kn, α)= 0.75α(1+Kn)
Kn2+Kn+0.283Knα+0.75α (8)
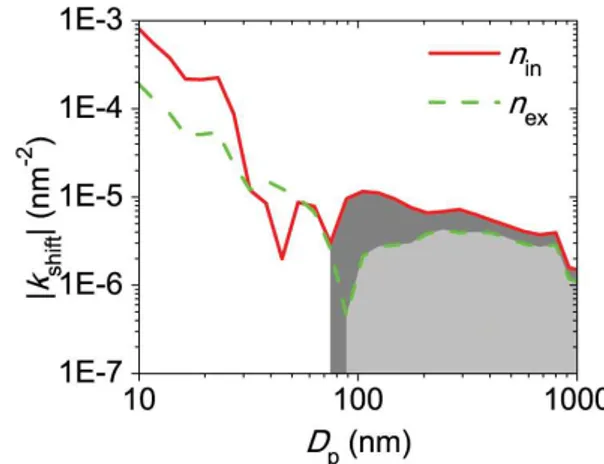
Fig. 7.The size dependence of the particle size distributionn(Dp) variation due to condensation growth.kshiftequals(∂n/∂t )/ndue to condensation growth divided by a constant (in Eq. 20).kshiftcan ei-ther be positive or negative, which indicates increases and decreases ofn(Dp)due to condensation growth, respectively. The shaded ar-eas (with gray and light gray forninandnex, respectively) indicate the size ranges wherekshiftare positive whilekshiftare negative in the un-shaded ranges.
Dividing both sides of Eq. (7) byA=4DMP/(RTρp), we get a parameterkshift:
kshift= 1 A
∂n n∂t = −
∂ n∂Dp
( n Dp
f (Kn, α)) (9)
kshift differs from (∂n/∂t )/n in Eq. (7) by a factor of A, which is generally/mostly independent of particle sizes. So, kshift is equivalent to (∂n/∂t )/n in representing the size dependence of the rate of change of n due to condensa-tion. By taking the measured n(Dp) and λ=λair (298 K, 1 atm)=65.1 nm (Seinfeld and Pandis, 2006, p. 399),kshift can be calculated for eachDp.
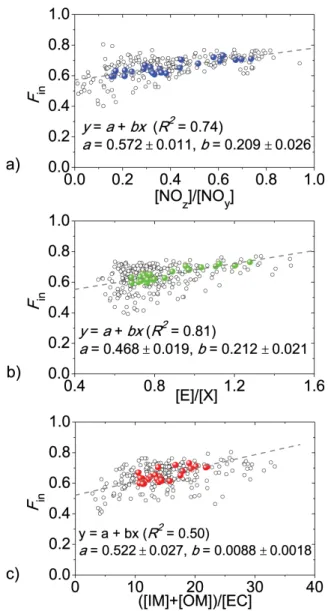
Fig. 8.Correlations betweenFinand(a)[NOz]/[NOy],(b)[E]/[X], and (c)([IM] + [OM])/[EC]. The open circles are measurement data with a time resolution of 1 h; while the colored solid dots are average diurnal data. The average diurnal data can be linearly fitted by equation “y=a+bx” (dashed line) withRbeing the correlation coefficient.
3.6 Size-resolved parameterizations ofFin
Due to insufficient knowledge concerning the soot mixing state (and its temporal evolution) and the computational costs associated with explicit modeling of the mixing processes, it is still difficult to explicitly and accurately predict the varia-tion ofFinin regional/climate models. In an aging air mass, the change of soot mixing state is generally accompanied by the change of other indicators representing the air mass age. We suggest parameterizing the mixing state of soot by using these correlations. If the other indicators are easier to mea-sure and model, such parameterizations might provide an al-ternative solution, narrowing down the differences between
Fig. 9.Measured and predictedFinover 100 nm to 320 nm (2145 data points). The dashed line represents the 1:1 line.
ambient and modeled soot mixing state without significant additional computational costs.
The proposed parameterization approach involves two steps to calculateFin from other indicators. First, the aver-age diurnal values of Fin and other parameters (as shown in Figs. 3 and 4) are adopted to calculate a linear fit, re-sulting in the parameterization Eqs. (10)–(12). The reason for using average values is to smooth out fluctuations which may greatly reduce the correlation coefficientR and intro-duce large uncertainties into the fitting results. Fin at cer-tain diameter (i.e., 150 nm) can be predicted by parameteri-zation Eqs. (10)–(12). Figure 8a–c shows comparisons ofFin at 150 nm with individual indicators, namely,[NOz]/[NOy],
[E]/[X]and([IM] + [OM])/[EC]. Fin(150 nm)=0.572+0.209
[NOz]
[NOy]
(10)
Fin(150 nm)=0.468+0.212
[E]
[X] (11)
Fin(150 nm)=0.522+0.0088
[IM] + [OM]
[EC] (12)
Second, we find that the size-resolvedFinin the accumula-tion mode can be calculated by the following equaaccumula-tion from Finat 150 nm:
Fin(Dp)=(alog 10(Dp/1 nm)+b)Fin(150 nm) (13) whereaandbare constant parameters.
Table 4.Correlation of measured and predictedFin(429 data points for individual size bins; 2145 data points for all size bins).
Dp
100 nm 150 nm 200 nm 260 nm 320 nm all
k∗ 0.99±0.01 1.01±0.00 1.02±0.01 0.96±0.01 1.00±0.01 0.99
R2 0.75 1.00 0.80 0.68 0.41 0.77
∗kis the fit parameter in the equation:F
in(predicted)=kFin(measured).
This parameterization method requires caveats because considerable variability can be expected between different sites or even at a given site, like the scattered data shown in Figs. 8 and 9. To validate the parameterization methods, more measurements should be carried out in other environ-ments.
3.7 Coating thickness distribution
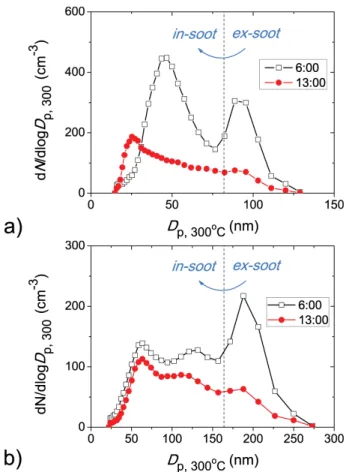
In both the existing literature and the present study, the soot particles are often classified into two distinct groups (inter-nally and exter(inter-nally mixed soot particles) by certain thresh-old core/shell ratios (e.g.,Dp,300◦C/Dp). However, the tran-sition between the two groups in the atmosphere can be quite smooth, especially in aged air mass (Fig. 10, results at 13:00), and the threshold core/shell ratio should be considered as an arbitrary definition. Such “arbitrary” ratios (e.g., core/shell ratio=0.5) have also been used to distinguish different mix-ing states of soot particles in SP2 studies (e.g., Shiraiwa et al., 2007).
In our case, the use of different threshold ratios will change the absolute values ofFinbut leave the same/similar trends (see Fig. S3 for example). For a better description of the mix-ing state of soot particles, we suggest to consider the distri-bution concept, e.g., the distridistri-bution of the relative coating thickness (Dp,300◦C/Dp) in future studies.
4 Conclusions
Analysis of VTDMA results from the megacity Beijing shows a pronounced diurnal variation ofFin with different behaviors in the Aitken and accumulation modes. For accu-mulation mode particles, maxima of Fin were observed at 12:00–13:00 LT, which can be explained by competing ef-fects of physico-chemical conversion and direct emissions. The distinct diurnal cycles ofFinof Aitken and accumulation mode particles are likely caused by faster growth of smaller Aitken mode particles.
To calculate the actual turnover rate of soot from exter-nal to interexter-nal mixture (kex→in), measurement data were an-alyzed by a conceptual model, which considered both di-rect emissions and the aging process. The analysis shows that the actualkex→in has high values during daytime, i.e., a maximum around 11:00–15:00 LT, and low values during the night-time. Turnover rates reached values of 20–70 % h−1
Fig. 10.Size distributions of nonvolatile residuals with initial diam-eterDpof(a)100 nm and(b)200 nm.Dp,300◦Cis the diameter of the nonvolatile residuals, i.e., particles after being heated at 300◦C. The presence of particles withDp,300◦C> Dpis due to the transfer function of the DMA used for initial particle selections.
Table A1.Acronyms.
Symbol Description
AMS Aerosol mass spectrometer
ATOFMS Aerosol time-of-flight mass spectrometer CAREBeijing Campaign of air quality research in Beijing CCN Cloud condensation nuclei
DMA Differential mobility analyzer EC Elemental carbon
GC-PID Gas chromatography-photo ionization detector OC Organic carbon
PAN Peroxyacetyl nitrates
PM1 Particles of 1 µm or less in aerodynamic diameter PM10 Particles of 10 µm or less in aerodynamic diameter SP2 Single particle soot photometer
Soot (NVP) Non-volatile-core containing particles, measured by the VTDMA, and taken as soot particles VTDMA Volatility tandem differential mobility analyzer
In this study, the calculated kex→in might be subject to potential uncertainties due to: (1) the estimation of
1
[EC](∂[EC]/∂t )Emis (relative emission rate of soot) and β (number fraction of internally mixed soot particles in emis-sions); (2) the effect of transport process; and (3) the influ-ence of particle growth and coagulation. To better understand the soot aging process, we suggest measuring β in some emission studies, combining regional models to quantify the transport effects, and implementing aerosol dynamic models instead of the current conceptual model.
Fin shows a similar diurnal course as the other air mass age indicators (e.g., [NOz]/[NOy], [E]/[X] and ([IM] + [OM])/[EC]), which are subject to competing ef-fects between emissions and aging processes as well. The good agreement of their correlations can be expressed as a linear relationship. Given the difficulty of making direct measurements of soot mixing state (Fin), these relationships might be of great practical value in regional/global-scale studies on the influence of the various direct and indirect soot aerosol effects on climate, as it provides an easily measured proxy that does not consume significant additional comput-ing time. However, such parameterizations require caveats because considerable variability can be expected between different sites or even at a given site, like the scattered data shown in Figs. 8 and 9. To validate the parameterization methods, improve our understanding and refine the range of the fitting parameters, more measurements should be carried out in other environments. In addition, validation for particles larger than 320 nm needs to be performed in future studies.
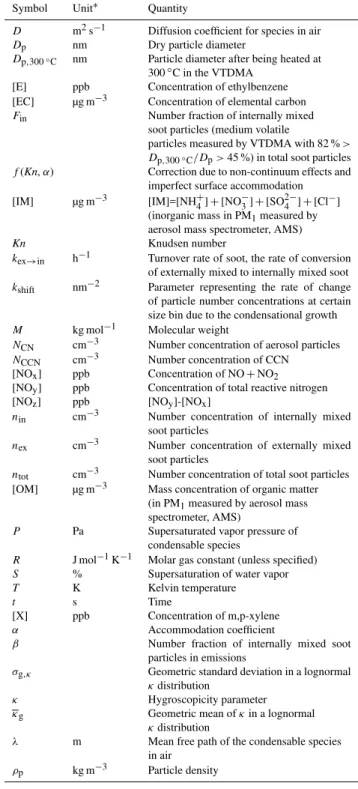
Table A2.Symbols.
Symbol Unit∗ Quantity
D m2s−1 Diffusion coefficient for species in air Dp nm Dry particle diameter
Dp,300◦C nm Particle diameter after being heated at 300◦C in the VTDMA
[E] ppb Concentration of ethylbenzene [EC] µg m−3 Concentration of elemental carbon
Fin Number fraction of internally mixed soot particles (medium volatile
particles measured by VTDMA with 82 %> Dp,300◦C/Dp>45 %) in total soot particles
f(Kn,α) Correction due to non-continuum effects and imperfect surface accommodation [IM] µg m−3 [IM]=[NH+
4] + [NO
−
3] + [SO 2−
4 ] + [Cl−] (inorganic mass in PM1measured by aerosol mass spectrometer, AMS)
Kn Knudsen number
kex→in h−1 Turnover rate of soot, the rate of conversion of externally mixed to internally mixed soot kshift nm−2 Parameter representing the rate of change of particle number concentrations at certain size bin due to the condensational growth M kg mol−1 Molecular weight
NCN cm−3 Number concentration of aerosol particles
NCCN cm−3 Number concentration of CCN [NOx] ppb Concentration of NO+NO2 [NOy] ppb Concentration of total reactive nitrogen [NOz] ppb [NOy]-[NOx]
nin cm−3 Number concentration of internally mixed soot particles
nex cm−3 Number concentration of externally mixed soot particles
ntot cm−3 Number concentration of total soot particles [OM] µg m−3 Mass concentration of organic matter
(in PM1measured by aerosol mass spectrometer, AMS)
P Pa Supersaturated vapor pressure of condensable species
R J mol−1K−1 Molar gas constant (unless specified) S % Supersaturation of water vapor
T K Kelvin temperature
t s Time
[X] ppb Concentration of m,p-xylene
α Accommodation coefficient
β Number fraction of internally mixed soot particles in emissions
σg,κ Geometric standard deviation in a lognormal κdistribution
κ Hygroscopicity parameter
κg Geometric mean ofκin a lognormal
κdistribution
λ m Mean free path of the condensable species in air
ρp kg m−3 Particle density ∗if not specified.
Supplementary material related to this article is
Acknowledgements. The CAREBeijing 2006 campaign was supported by the Beijing Council of Science and Technology (HB200504-6, HB200504-2). This study was supported by the Max Planck Society (MPG), the Leibniz Institute for Tropospheric Research (IfT), Peking University, and the University of Tokyo (UT). Hang Su’s work was supported in part by MPG, the Pan-European Gas-AeroSOls-climate interaction Study (No. 265148, PEGASOS) and the European integrated project on aerosol cloud climate and air quality interactions (No. 036833-2, EUCAARI). Y. Kondo and N. Takegawa were supported by the Ministry of Education, Culture, Sports, Science, and Technology (MEXT) and the global environment research fund of the Japanese Ministry of the Environment (A-0803 and A-1101). Thanks are owed to all the team members of CAREBeijing 2006 for support during the campaign. We acknowledge the referees for the constructive suggestions.
Edited by: D. Parrish
References
Andreae, M. O. and Gelencs´er, A.: Black carbon or brown car-bon? The nature of light-absorbing carbonaceous aerosols, At-mos. Chem. Phys., 6, 3131–3148, doi:10.5194/acp-6-3131-2006, 2006.
Andreae, M. O. and Rosenfeld, D.: Aerosol-cloud-precipitation interactions. Part 1. The nature and sources of cloud-active aerosols, Earth-Sci. Rev., 89, 13–41, doi:10.1016/j.earscirev.2008.03.001, 2008.
Bergstrom, R. W., Pilewskie, P., Russell, P. B., Redemann, J., Bond, T. C., Quinn, P. K., and Sierau, B.: Spectral absorp-tion properties of atmospheric aerosols, Atmos. Chem. Phys., 7, 5937–5943, doi:10.5194/acp-7-5937-2007, 2007.
Bond, T. C., Habib, G., and Bergstrom, R. W.: Limitations in the enhancement of visible light absorption due to mixing state, J. Geophys. Res., 111, D20211, doi:10.1029/2006JD007315, 2006. Burtscher, H., Baltensperger, U., Bukowiecki, N., Cohn, P., H¨uglin, C., Mohr, M., Matter, U., Nyeki, S., Schmatloch, V., Streit, N., and Weingartner, E.: Separation of volatile and non-volatile aerosol fractions by thermodesorption: instrumen-tal development and applications, J. Aerosol Sci., 32, 427–442, doi:10.1016/s0021-8502(00)00089-6, 2001.
Calvert, J.: Hydrocarbon involvement in photochemical smog for-mation in Los Angeles atmosphere, Environ. Sci. Technol., 10, 256–262, 1976.
Cheng, Y. F., Eichler, H., Wiedensohler, A., Heintzenberg, J., Zhang, Y. H., Hu, M., Herrmann, H., Zeng, L. M., Liu, S., Gnauk, T., Br¨uggemann, E., and He, L. Y.: Mixing state of elemental carbon and non-light-absorbing aerosol components derived from in situ particle optical properties at Xinken in Pearl River Delta of China, J. Geophys. Res., 111, D20204, doi:10.1029/2005JD006929, 2006.
Cheng, Y. F., Wiedensohler, A., Eichler, H., Heintzenberg, J., Tesche, M., Ansmann, A., Wendisch, M., Su, H., Althausen, D., Herrmann, H., Gnauk, T., Br¨uggemann, E., Hu, M., and Zhang, Y. H.: Relative humidity dependence of aerosol optical properties and direct radiative forcing in the surface boundary layer at Xinken in Pearl River Delta of China: an observation based numerical study, Atmos. Environ., 42, 6373–6397, 2008a.
Cheng, Y. F., Wiedensohler, A., Eichler, H., Su, H., Gnauk, T., Br¨uggemann, E., Herrmann, H., Heintzenberg, J., Slanina, J., Tuch, T., Hu, M., and Zhang, Y. H.: Aerosol optical properties and related chemical apportionment at Xinken in Pearl River Delta of China, Atmos. Environ., 42, 6351–6372, 2008b. Cheng, Y. F., Berghof, M., Garland, R. M., Wiedensohler, A.,
Wehner, B., M¨uller, T., Su, H., Zhang, Y. H., Achtert, P., Nowak, A., P¨oschl, U., Zhu, T., Hu, M., and Zeng, L. M.: In-fluence of soot mixing state on aerosol light absorption and sin-gle scattering albedo during air mass aging at a polluted regional site in Northeastern China, J. Geophys. Res., 114, D00G10, doi:10.1029/2008jd010883, 2009.
Cooke, W. F. and Wilson, J. J. N.: A global black carbon aerosol model, J. Geophys. Res., 101, 19395–19409, 1996.
Cooke, W. F., Liousse, C., Cachier, H., and Feichter, J.: Con-struction of a 1◦×1◦fossil fuel emission data set for carbona-ceous aerosol and implementation and radiative impactor in the ECHAM4 model, J. Geophys. Res., 104, 22137–22162, 1999. Cooke, W. F., Ramaswamy, V., and Kasibhatla, P.: A general
circu-lation model study of the global carbonaceous aerosol distribu-tion, J. Geophys. Res., 107, 4279, doi:10.1029/2001JD001274, 2002.
Engler, C., Rose, D., Wehner, B., Wiedensohler, A., Br¨uggemann, E., Gnauk, T., Spindler, G., Tuch, T., and Birmili, W.: Size distributions of non-volatile particle residuals (Dp<800 nm) at a rural site in Germany and relation to air mass origin, Atmos. Chem. Phys., 7, 5785–5802, doi:10.5194/acp-7-5785-2007, 2007.
Frey, A., Rose, D., Wehner, B., M¨uller, T., Cheng, Y., Wieden-sohler, A., and Virkkula, A.: Application of the volatility-TDMA technique to determine the number size distribution and mass concentration of less volatile particles, Aerosol Sci. Tech., 42, 817–828, doi:10.1080/02786820802339595, 2008.
Garland, R. M., Yang, H., Schmid, O., Rose, D., Nowak, A., Achtert, P., Wiedensohler, A., Takegawa, N., Kita, K., Miyazaki, Y., Kondo, Y., Hu, M., Shao, M., Zeng, L. M., Zhang, Y. H., Andreae, M. O., and P¨oschl, U.: Aerosol optical properties in a rural environment near the mega-city Guangzhou, China: implications for regional air pollution, radiative forc-ing and remote sensforc-ing, Atmos. Chem. Phys., 8, 5161–5186, doi:10.5194/acp-8-5161-2008, 2008.
Garland, R. M., Schmid, O., Nowak, A., Achtert, P., Wieden-sohler, A., Gunthe, S. S., Takegawa, N., Kita, K., Kondo, Y., Hu, M., Shao, M., Zeng, L. M., Zhu, T., Andreae, M. O., and P¨oschl, U.: Aerosol optical properties observed during Cam-paign of Air Quality Research in Beijing 2006 (CAREBeijing-2006): Characteristic differences between the inflow and out-flow of Beijing city air, J. Geophys. Res., 114, D00G04, doi:10.1029/2008jd010780, 2009.
Gunthe, S. S., Rose, D., Su, H., Garland, R. M., Achtert, P., Nowak, A., Wiedensohler, A., Kuwata, M., Takegawa, N., Kondo, Y., Hu, M., Shao, M., Zhu, T., Andreae, M. O., and P¨oschl, U.: Cloud condensation nuclei (CCN) from fresh and aged air pollution in the megacity region of Beijing, Atmos. Chem. Phys., 11, 11023– 11039, doi:10.5194/acp-11-11023-2011, 2011.
Horvath, H.: Atmospheric light absorption – a review, Atmos. Env-iron., 27A, 293–317, 1993.
Ivleva, N. P., Messerer, A., Yang, X., Niessner, R., and P¨oschl, U.: Raman microspectroscopic analysis of changes in the chemical structure and reactitivity of soot in a diesel exhaust aftertreatment model system, Environ. Sci. Technol., 41, 3702–3707, 2007. Jacobson, M. Z.: Development and application of a new air
pollution modeling system – II. Aerosol module structure and design, Atmos. Environ., 31, 131–144, doi:10.1016/1352-2310(96)00202-6, 1997.
Jacobson, M. Z.: A physically-based treatment of elemental carbon optics: implications for global direct forcing of aerosols, Geo-phys. Res. Lett., 27, 217–220, 2000.
Jacobson, M. Z.: Strong radiative heating due to the mixing state of black carbon in atmospheric aerosol, Nature, 409, 695–697, 2001.
Japar, S. M., Brachaczek, W. W., Gorse, R. A., Norbeck, J. M., and Pierson, W. R.: The contribution of elemental carbon to the op-tical properties of rural atmospheric aerosols, Atmos. Environ., 20, 1281–1289, 1986.
Katrinak, K. A., Rez, P., and Buseck, P. R.: Structural variations in individual carbonaceous particles from an urban aerosol, Envi-ron. Sci. Technol., 26, 1967–1976, 1992.
Katrinak, K. A., Rez, P., Perkes, P. R., and Bueseck, P. R.: Frac-tal geometry of carbonaceous aggregates from an urban aerosol, Environ. Sci. Technol., 27, 539–547, 1993.
Koch, K.: Transport and direct radiative forcing of carbonaceous and sulphate aerosols in the GISS GCM, J. Geophys. Res., 106, 20311–20332, 2001.
Kondo, Y., Komazaki, Y., Miyazaki, Y., Moteki, N., Takegawa, N., Kodama, D., Deguchi, S., Nogami, M., Fukuda, M., Miyakawa, T., Morino, Y., Koike, M., Sakurai, H., and Ehara, K.: Temporal variations of elemental carbon in Tokyo, J. Geophys. Res., 111, D12205, doi:10.1029/2005jd006257, 2006. Kondo, Y., Sahu, L., Kuwata, M., Miyazaki, Y., Takegawa, N., Moteki, N., Imaru, J., Han, S., Nakayama, T., Oanh, N. T. K., Hu, M., Kim, Y. J., and Kita, K.: Stabilization of the mass ab-sorption cross section of black carbon for filter-based abab-sorption photometry by the use of a heated inlet, Aerosol Sci. Tech., 43, 741–756, doi:10.1080/02786820902889879, 2009.
Kondo, Y., Sahu, L., Moteki, N., Khan, F., Takegawa, N., Liu, X., Koike, M., and Miyakawa, T.: Consistency and trace-ability of black carbon measurements made by laser-induced incandescence, thermal-optical transmittance, and filter-based photo-absorption techniques, Aerosol Sci. Tech., 45, 295–312, doi:10.1080/02786826.2010.533215, 2010.
Lesins, G., Chylek, P., and Lohman, U.: A study of internal and external mixing scenarios and its effect on aerosol optical prop-erties and direct radiative forcing, J. Geophys. Res., 107, 4094, doi:10.1029/2001JD000973, 2002.
Lohmann, U., Feichter, J., Penner, J., and Leaitch, R.: Indirect effect of sulfate and carbonaceous aerosols: a mechanistic treatment, J. Geophys. Res., 105, 12193–12206, 2000.
Moffet, R. C. and Prather, K. A.: In-situ measurements of the mix-ing state and optical properties of soot with implications for ra-diative forcing estimates, P. Natl. Acad. Sci. USA, 106, 11872– 11877, doi:10.1073/pnas.0900040106, 2009.
Moteki, N., Kondo, Y., Miyazaki, Y., Takegawa, N., Komazaki, Y., Kurata, G., Shirai, T., Blake, D. R., Miyakawa, T., and Koike, M.:
Evolution of mixing state of black carbon particles: aircraft mea-surements over the Western Pacific in March 2004, Geophys. Res. Lett., 34, L11803, doi:10.1029/2006GL028943, 2007. Novakov, T., Ramanathan, V., Hansen, J. E., Kirchstetter, T. W.,
Sato, M., Sinton, J. E., and Sathaye, J. A.: Large historical changes of fossil-fuel black carbon aerosols, Geophys. Res. Lett., 30, 1324, doi:10.1029/2002gl016345, 2003.
Orsini, D. A., Wiedensohler, A., and Covert, D. S.: Volatility mea-surements of atmospheric aerosols in the Mid and South Pa-cific using a Volatility-Tandem-Differential-Mobility-Analyzer, J. Aerosol Sci., 27, S53–S54, 1996.
O’Brien, J. M., Shepson, P. B., Wu, Q., Biesenthal, T., Botten-heim, J. W., Wiebe, H. A., Anlauf, K. G., and Brickell, P.: Pro-duction and distribution of organic nitrates, and their relation-ship to carbonyl compounds in an urban environment, Atmos. Environ., 31, 2059–2069, doi:10.1016/s1352-2310(97)80002-7, 1997.
Parrish, D. D., Hahn, C. J., Williams, E. J., Norton, R. B., Fehsen-feld, F. C., Singh, H. B., Shetter, J. D., Gandrud, B. W., and Ridley, B. A.: Indications of photochemical histories of pa-cific air masses from measurements of atmospheric trace species at point arena, california, J. Geophys. Res., 97, 15883–15901, doi:10.1029/92jd01242, 1992.
Petters, M. D. and Kreidenweis, S. M.: A single parameter repre-sentation of hygroscopic growth and cloud condensation nucleus activity, Atmos. Chem. Phys., 7, 1961–1971, doi:10.5194/acp-7-1961-2007, 2007.
Philippin, S., Wiedensohler, A., and Stratmann, F.: Measurements of non-volatile fractions of pollution aerosols with an eight-tube volatility tandem differential mobility analyzer (VTDMA-8), J. Aerosol Sci., 35, 185–203, 2004.
P¨oschl, U.: Atmospheric aerosols: composition, transformation, cli-mate and health effects, Angew. Chem. Int. Edit., 44, 7520–7540, doi:10.1002/anie.200501122, 2005.
P¨oschl, U.: Gas-particle interactions of tropospheric aerosols: Ki-netic and thermodynamic perspectives of multiphase chemi-cal reactions, amorphous organic substances, and the activa-tion of cloud condensaactiva-tion nuclei, Atmos. Res., 101, 562–573, doi:10.1016/j.atmosres.2010.12.018, 2011.
P¨oschl, U., Martin, S. T., Sinha, B., Chen, Q., Gunthe, S. S., Huffman, J. A., Borrmann, S., Farmer, D. K., Garland, R. M., Helas, G., Jimenez, J. L., King, S. M., Manzi, A., Mikhailov, E., Pauliquevis, T., Petters, M. D., Prenni, A. J., Roldin, P., Rose, D., Schneider, J., Su, H., Zorn, S. R., Artaxo, P., and An-dreae, M. O.: Rainforest aerosols as biogenic nuclei of clouds and precipitation in the Amazon, Science, 329, 1513–1516, doi:10.1126/science.1191056, 2010.
Riemer, N., Vogel, H., and Vogel, B.: Soot aging time scales in polluted regions during day and night, Atmos. Chem. Phys., 4, 1885–1893, doi:10.5194/acp-4-1885-2004, 2004.
Riemer, N., West, M., Zaveri, R., and Easter, R.: Estimating black carbon aging time-scales with a particle-resolved aerosol model, J. Aerosol Sci., 41, 143–158, doi:10.1016/j.jaerosci.2009.08.009, 2010.
Rose, D., Gunthe, S. S., Mikhailov, E., Frank, G. P., Dusek, U., Andreae, M. O., and P¨oschl, U.: Calibration and measurement uncertainties of a continuous-flow cloud condensation nuclei counter (DMT-CCNC): CCN activation of ammonium sulfate and sodium chloride aerosol particles in theory and experiment, Atmos. Chem. Phys., 8, 1153–1179, doi:10.5194/acp-8-1153-2008, 2008.
Rose, D., Gunthe, S. S., Su, H., Garland, R. M., Yang, H., Berghof, M., Cheng, Y. F., Wehner, B., Achtert, P., Nowak, A., Wieden-sohler, A., Takegawa, N., Kondo, Y., Hu, M., Zhang, Y., Andreae, M. O., and P¨oschl, U.: Cloud condensation nuclei in polluted air and biomass burning smoke near the mega-city Guangzhou, China – Part 2: Size-resolved aerosol chemical composition, di-urnal cycles, and externally mixed weakly CCN-active soot par-ticles, Atmos. Chem. Phys., 11, 2817–2836, doi:10.5194/acp-11-2817-2011, 2011.
Rosen, H., Hansen, A. D. A., Gundel, L., and Novakov, T.: Iden-tification of the optical absorbing component in urban aerosols, Appl. Optics, 17, 3859–3861, 1979.
Sadezky, A., Muckenhuber, H., Grothe, H., Niessner, R., and P¨oschl, U.: Raman microspectroscopy of soot and related car-bonaceous materials: spectral analysis and structural informa-tion, Carbon, 43, 1731–1742, doi:10.1016/j.carbon.2005.02.018, 2005.
Seinfeld, J. H. and Pandis, S. N.: Atmospheric Chemistry and Physics, from Air Pollution to Climate Change, Wiley, New York, 2006.
Shiraiwa, M., Kondo, Y., Moteki, N., Takegawa, N., Miyazaki, Y., and Blake, D. R.: Evolution of mixing state of black carbon in polluted air from Tokyo, Geophys. Res. Lett., 34, L16803, doi:10.1029/2007GL029819, 2007.
Shiraiwa, M., Kondo, Y., Moteki, N., Takegawa, N., Sahu, L. K., Takami, A., Hatakeyama, S., Yonemura, S., and Blake, D. R.: Radiative impact of mixing state of black carbon aerosol in Asian outflow, J. Geophys. Res., 113, D24210, doi:10.1029/2008jd010546, 2008.
Shiraiwa, M., Kondo, Y., Iwamoto, T., and Kita, K.: Amplification of light absorption of black carbon by organic coating, Aerosol Sci. Tech., 44, 46–54, doi:10.1080/02786820903357686, 2010. Smith, D. M., Akhter, M. S., Jassim, J. A., Sergides, C. A.,
Welch, W. F., and Chughtai, A. R.: Studies of the stucture and reactivity of soot, Aerosol Sci. Tech., 45, 1397–1415, 1989. Smith, M. H. and O’Dowd, C. D.: Observations of accumulation
mode aerosol composition and soot carbon concentrations by means of a high-temperature volatility technique, J. Geophys. Res., 101, 19583–19591, doi:10.1029/95jd01750, 1996. Stephens, M., Turner, N., and Sandberg, J.: Particle identification by
laser-induced incandescence in a solid-state laser cavity, Appl. Optics, 42, 3726–3736, 2003.
Su, H., Cheng, Y. F., Cheng, P., Zhang, Y. H., Dong, S., Zeng, L. M., Wang, X., Slanina, J., Shao, M., and Wiedensohler, A.: Obser-vation of nighttime nitrous acid (HONO) formation at a non-urban site during PRIDE-PRD2004 in China, Atmos. Environ., 42, 6219–6232, doi:10.1016/j.atmosenv.2008.04.006, 2008.
Su, H., Rose, D., Cheng, Y. F., Gunthe, S. S., Massling, A., Stock, M., Wiedensohler, A., Andreae, M. O., and P¨oschl, U.: Hygro-scopicity distribution concept for measurement data analysis and modeling of aerosol particle mixing state with regard to hygro-scopic growth and CCN activation, Atmos. Chem. Phys., 10, 7489–7503, doi:10.5194/acp-10-7489-2010, 2010.
Takegawa, N., Miyakawa, T., Kondo, Y., Jimenez, J. L., Zhang, Q., Worsnop, D. R., and Fukuda, M.: Seasonal and diurnal variations of submicron organic aerosol in Tokyo observed using the Aero-dyne serosol mass spectrometer, J. Geophys. Res., 111, D11206, doi:10.1029/2005JD006515, 2006.
Takegawa, N., Miyakawa, T., Watanabe, M., Kondo, Y., Miyazaki, Y., Han, S., Zhao, Y., van Pinxteren, D., Brugge-mann, E., Gnauk, T., HerrBrugge-mann, H., Xiao, R., Deng, Z., Hu, M., Zhu, T., and Zhang, Y.: Performance of an aerodyne aerosol mass spectrometer (AMS) during intensive campaigns in China in the summer of 2006, Aerosol Sci. Technol., 43, 189–204, 2009.
Tsigaridis, K. and Kanakidou, M.: Global modelling of secondary organic aerosol in the troposphere: a sensitivity analysis, At-mos. Chem. Phys., 3, 1849–1869, doi:10.5194/acp-3-1849-2003, 2003.
Wehner, B., Berghof, M., Cheng, Y. F., Achtert, P., Birmili, W., Nowak, A., Wiedensohler, A., Garland, R. M., P¨oschl, U., Hu, M., and Zhu, T.: Mixing state of nonvolatile aerosol particle fractions and comparison with light absorption in the polluted Beijing region, J. Geophys. Res., 114, D00G17, doi:10.1029/2008jd010923, 2009.
Wiedensohler, A., Cheng, Y. F., Nowak, A., Wehner, B., Achtert, P., Berghof, M., Birmili, W., Wu, Z. J., Hu, M., Zhu, T., Takegawa, N., Kita, K., Kondo, Y., Lou, S. R., Hofzumahaus, A., Holland, F., Wahner, A., Gunthe, S. S., Rose, D., Su, H., and P¨oschl, U.: Rapid aerosol particle growth and increase of cloud condensation nucleus activity by secondary aerosol for-mation and condensation: a case study for regional air pollu-tion in Northeastern China, J. Geophys. Res., 114, D00G08, doi:10.1029/2008jd010884, 2009.
Xie, X., Shao, M., Liu, Y., Lu, S., Chang, C.-C., and Chen, Z.-M.: Estimation of initial isoprene contribution to ozone formation potential in Beijing, China, Atmos. Environ., 42, 6000–6010, doi:10.1016/j.atmosenv.2008.03.035, 2008.
![Fig. 5. Diurnal variation of normalized parameters: (a) emission rates of EC, (∂[EC]/∂t) Emis , which is assumed the same as CO emission rates in Beijing (green dashed lines); (b) EC concentra-tions measured by an online Sunset EC/OC analyzer (red dotted](https://thumb-eu.123doks.com/thumbv2/123dok_br/16291784.185419/7.892.88.418.95.338/variation-normalized-parameters-emission-emission-concentra-measured-analyzer.webp)
![Table 3. Mean diurnal variation of [EC] (EC concentrations) and (∂[EC]/∂t) Emis (emission rates).](https://thumb-eu.123doks.com/thumbv2/123dok_br/16291784.185419/8.892.135.749.123.380/table-mean-diurnal-variation-concentrations-emis-emission-rates.webp)