ACPD
11, 32161–32204, 2011Measurement of the mixing state of soot
in the megacity Beijing
Y. F. Cheng et al.
Title Page
Abstract Introduction
Conclusions References
Tables Figures
◭ ◮
◭ ◮
Back Close
Full Screen / Esc
Printer-friendly Version Interactive Discussion
Discussion
P
a
per
|
Dis
cussion
P
a
per
|
Discussion
P
a
per
|
Discussio
n
P
a
per
|
Atmos. Chem. Phys. Discuss., 11, 32161–32204, 2011 www.atmos-chem-phys-discuss.net/11/32161/2011/ doi:10.5194/acpd-11-32161-2011
© Author(s) 2011. CC Attribution 3.0 License.
Atmospheric Chemistry and Physics Discussions
This discussion paper is/has been under review for the journal Atmospheric Chemistry and Physics (ACP). Please refer to the corresponding final paper in ACP if available.
Size-resolved measurement of the mixing
state of soot in the megacity Beijing,
China: diurnal cycle, aging and
parameterization
Y. F. Cheng1,2,7, H. Su3, D. Rose3, S. S. Gunthe3,*, M. Berghof2, B. Wehner2, P. Achtert2, A. Nowak2, N. Takegawa4, Y. Kondo5, M. Shiraiwa3, Y. G. Gong6, M. Shao1, M. Hu1, T. Zhu1, Y. H. Zhang1, A. Wiedensohler2, M. O. Andreae3, and U. P ¨oschl3
1
College of Environmental Sciences and Engineering, Peking University, Beijing 100871, China
2
Leibniz Institute for Tropospheric Research, Leipzig, Germany
3
Biogeochemistry Department, Max Planck Institute for Chemistry, Mainz 55020, Germany
4
Research Center for Advanced Science and Technology, the University of Tokyo, Tokyo, Japan
5
ACPD
11, 32161–32204, 2011Measurement of the mixing state of soot
in the megacity Beijing
Y. F. Cheng et al.
Title Page
Abstract Introduction
Conclusions References
Tables Figures
◭ ◮
◭ ◮
Back Close
Full Screen / Esc
Printer-friendly Version Interactive Discussion
Discussion
P
a
per
|
Dis
cussion
P
a
per
|
Discussion
P
a
per
|
Discussio
n
P
a
per
|
6
Research Institute of Chemical Defence, Beijing 102205, China
7
Center for Global and Regional Environment Research, University of Iowa, IA 52242, USA
∗
now at: EWRE Division, Department of Civil Engineering, Indian Institute of Technology Madras, Chennai 600036, India
Received: 4 November 2011 – Accepted: 22 November 2011 – Published: 7 December 2011
Correspondence to: H. Su ([email protected])
Published by Copernicus Publications on behalf of the European Geosciences Union.
ACPD
11, 32161–32204, 2011Measurement of the mixing state of soot
in the megacity Beijing
Y. F. Cheng et al.
Title Page
Abstract Introduction
Conclusions References
Tables Figures
◭ ◮
◭ ◮
Back Close
Full Screen / Esc
Printer-friendly Version Interactive Discussion
Discussion
P
a
per
|
Dis
cussion
P
a
per
|
Discussion
P
a
per
|
Discussio
n
P
a
per
|
Abstract
Soot particles are regarded as the most efficient light absorbing aerosol species in the atmosphere, playing an important role as a driver of global warming. Their climate effects strongly depend on their mixing state, which significantly changes their light ab-sorbing capability and cloud condensation nuclei (CCN) activity. Therefore, knowledge
5
about the mixing state of soot and its aging mechanism becomes an important topic in the atmospheric sciences.
The size-resolved (30–320 nm diameter) mixing state of soot particles in polluted megacity air was measured at a suburban site (Yufa) during the CAREBeijing 2006 campaign in Beijing, using a Volatility Tandem Differential Mobility Analyzer (VTDMA).
10
Particles in this size range with non-volatile residuals at 300◦C were considered to be soot particles. On average, the number fraction of internally mixed soot in total soot particles (Fin), decreased from 0.80 to 0.57 when initialDpincreased from 30 nm
to 320 nm. Further analysis reveals that: (1)Fin was well correlated with the aerosol
hygroscopic mixing state measured by a CCN counter. More externally mixed soot
15
particles were observed when particles showed more heterogeneous features with re-gard to hygroscopicity. (2) Fin had pronounced diurnal cycles. For particles in the
accumulation mode (Dp at 100–320 nm), largestFin were observed at noon time, with
“apparent” turnover rates (kex→in) up to 7.8 % h− 1
. (3) Fin was subject to competing
effects of both aging and emissions. While aging increasesFin by converting externally
20
mixed soot particles into internally mixed ones, emissions tend to reduceFin by
emit-ting more fresh and externally mixed soot particles. Similar compeemit-ting effects were also found with air mass age indicators. (4) Under the estimated emission intensi-ties, actual turnover rates of soot (kex→in) up to 20 % h−
1
were derived, which showed a pronounced diurnal cycle peaking around noon time. This result confirms that (soot)
25
particles are undergoing fast aging/coating with the existing high levels of condensable vapors in the megacity Beijing. (5) Diurnal cycles ofFin were different between Aitken
ACPD
11, 32161–32204, 2011Measurement of the mixing state of soot
in the megacity Beijing
Y. F. Cheng et al.
Title Page
Abstract Introduction
Conclusions References
Tables Figures
◭ ◮
◭ ◮
Back Close
Full Screen / Esc
Printer-friendly Version Interactive Discussion
Discussion
P
a
per
|
Dis
cussion
P
a
per
|
Discussion
P
a
per
|
Discussio
n
P
a
per
|
To improve the Fin prediction in regional/global models, we suggest
parameteriz-ing Fin by an air mass aging indicator, i.e., Fin=a+bx, where a and b are
empir-ical coefficients determined from observations, and x is the value of an air mass age indicator. At the Yufa site in the North China Plain, fitted coefficients (a, b) were determined as (0.57, 0.21), (0.47, 0.21), and (0.52, 0.0088) for x
(indica-5
tors) as [NOz]/[NOy], [E]/[X] ([ethylbenzene]/[m,p-xylene]) and ([IM]+[OM])/[EC]
([in-organic+organic matter]/[elemental carbon]), respectively. Such a parameterization consumes little additional computing time, but yields a more realistic description ofFin.
1 Introduction
Soot particles are generally regarded as the most efficient light absorbing component
10
of atmospheric aerosols (Hansen et al., 1979; Japar et al., 1986; Horvath, 1993; Bergstrom et al., 2007). They are produced by incomplete combustion of fossil fuel and biomass and they consist mainly of black or elemental carbon but may also contain some refractory organic matter (Horvath, 1993; Smith and O’Dowd, 1996; Burtscher et al., 2001; Novakov et al., 2003; P ¨oschl, 2005; Sadezky et al., 2005; Andreae and
15
Gelencs ´er, 2006; Kondo et al., 2006, 2010; Rose et al., 2006; Frey et al., 2008; Cheng et al., 2009; Wehner et al., 2009). In the atmospheric science literature, the terms black carbon (BC), elemental carbon (EC), pyrogenic carbon are frequently used as synonyms for soot (e.g., Kondo et al., 2006, 2009; P ¨oschl et al., 2010). More discus-sion on this topic can be found in Andreae and Gelencs ´er (2006).
20
Soot particles, after emission, are generally undergoing aging processes by conden-sation (Smith et al., 1989), coagulation (Riemer et al., 2004, and references therein), as well as oxidation (Ivleva et al., 2007) and cloud/fog processing; and gradually be-come internally mixed (coated) with other chemical compounds. Depending on their mixing state, soot particles can be classified as internally mixed (coated) or externally
25
mixed (uncoated). The mixing state of soot particles has a great influence on their climate effects. The light absorbing capability of soot (related to their direct radiative
ACPD
11, 32161–32204, 2011Measurement of the mixing state of soot
in the megacity Beijing
Y. F. Cheng et al.
Title Page
Abstract Introduction
Conclusions References
Tables Figures
◭ ◮
◭ ◮
Back Close
Full Screen / Esc
Printer-friendly Version Interactive Discussion
Discussion
P
a
per
|
Dis
cussion
P
a
per
|
Discussion
P
a
per
|
Discussio
n
P
a
per
|
effects) can be enhanced by a factor of 1.5 to 3 when soot is coated by or internally mixed with other aerosol components including sulfate, nitrate, organics and water (Ja-cobson, 2000; Lesins et al., 2002; Bond et al., 2006; Cheng et al., 2006, 2008a,b, 2009; Shiraiwa et al., 2008, 2010). Moreover, the coating of soot particles can signifi-cantly enhance their ability to be activated as cloud condensation nuclei (CCN) (Rose
5
et al., 2011) and hence influence the cloud formation processes (related to their in-direct radiative effects) and the removal of soot particles from the atmosphere. For these reasons, the mixing state is a crucial parameter for soot particles, uncertainty about which has been made difficult the accurate assessment of soot’s climatic impact (Jacobson, 2001).
10
In global/regional climate models, the turnover rate (kex→in) is used to describe the
conversion rate of externally mixed to internally mixed soot particles. Due to limited knowledge and computational limits, a constantkex→inwas taken in most studies,
vary-ing from 1.25 % h−1 to 2.5 % h−1 (Cooke and Wilson, 1996; Cooke et al., 1999, 2002; Lohmann et al., 2000; Jacobson, 2001; Koch, 2001). To obtain a more realistickex→in,
15
several aerosol modeling studies have been carried out to examine quantitativelykex→in
of soot particles (Riemer et al., 2004, 2010). However, it is challenging to validate the modeling results against atmospheric conditions, since modeling of the soot mixing state is almost equivalent to modeling all physicochemical processes in the gas and aerosol phases.
20
Decades ago, information about the soot mixing state relied on particle morphol-ogy measurements by Transmission Electron Microscopy (Katrinak et al., 1992, 1993; Hasegawa and Ohta, 2002). This technique does not always give reliable information, as volatile coatings may be lost, or thin coatings may not be evident. Later on, sev-eral online instruments with high time resolution were developed, i.e., volatility tandem
25
ACPD
11, 32161–32204, 2011Measurement of the mixing state of soot
in the megacity Beijing
Y. F. Cheng et al.
Title Page
Abstract Introduction
Conclusions References
Tables Figures
◭ ◮
◭ ◮
Back Close
Full Screen / Esc
Printer-friendly Version Interactive Discussion
Discussion
P
a
per
|
Dis
cussion
P
a
per
|
Discussion
P
a
per
|
Discussio
n
P
a
per
|
field studies have been carried out in recent years at regional (Engler et al., 2007), suburban (Shiraiwa et al., 2007; Cheng et al., 2009; Wehner et al., 2009), and urban sites (Rose et al., 2006), and by aircraft measurements (Moteki et al., 2007). The aging of soot particles was found to be well correlated with several air mass age indi-cators, e.g., ratios of C2H4to C2H2 (Moteki et al., 2007), 2-pentyl nitrate (2-PeONO2)
5
ton-pentane (n-C5H12) (Shiraiwa et al., 2007) and OC/EC (organic carbon/elemental
carbon) (Cheng et al., 2006). Under certain assumptions on the air mass history and OH concentrations, increase rates ofFin (number fraction of internally mixed soot
par-ticles) of about 1 % h−1to 2.3 % h−1 were derived (Moteki et al., 2007; Shiraiwa et al., 2007).
10
In the summer of 2006, measurements of the mixing state of non-volatile particles (here taken to be “soot particles”, see discussion in Sect. 2.2) were carried out at a suburban site of Beijing in the North China Plain by using a VTDMA (Cheng et al., 2009; Wehner et al., 2009). In this study, we perform an in-depth analysis of VTDMA results, focusing on the following topics: (1) comparison of the mixing state of soot
15
measured by a VTDMA and the aerosol hygroscopicity mixing state determined by a CCN (cloud condensation nuclei) counter; (2) diurnal variation and evolution of soot mixing state at different size ranges; (3) calculation ofkex→in and the influence on it of
emissions; and (4) potential parameterization methods.
2 Methods
20
2.1 Overview of the campaign
As part of the “Campaign of Air Quality Research in Beijing and Surrounding Region 2006” (CAREBeijing 2006), air pollutants including aerosol and gases were compre-hensively measured at a suburban site, Yufa (39.51467◦N, 116.30533◦E,∼25 m above
ground level), during the summer of 2006. The Yufa site is located in the south of
Bei-25
jing, roughly 50 km away from the urban center. One major road passes east of the
ACPD
11, 32161–32204, 2011Measurement of the mixing state of soot
in the megacity Beijing
Y. F. Cheng et al.
Title Page
Abstract Introduction
Conclusions References
Tables Figures
◭ ◮
◭ ◮
Back Close
Full Screen / Esc
Printer-friendly Version Interactive Discussion
Discussion
P
a
per
|
Dis
cussion
P
a
per
|
Discussion
P
a
per
|
Discussio
n
P
a
per
|
measurement site, at a distance of less than 200 m. Figure S1 (in the Supplement) shows the meteorological conditions at the Yufa site from 15 August to 9 September. During this period, the averages (±one standard deviation) of temperature, relative
humidity (RH) and wind speed were 26.2±3.7◦C, 68±17 % and 1.6±1.4 m s−1,
re-spectively (based on 5-min resolution meteorological data, see Supplement Fig. S1).
5
2.2 VTDMA measurement
A Volatility Tandem Differential Mobility Analyzer (VTDMA) (Orsini et al., 1996; Philip-pin et al., 2004) was used to measure the number size distributions of the non-volatile residuals of pre-selected mono-disperse particles that were heated at 300◦C (7 se-lected particle diameters in the range of 30 nm to 320 nm; time resolution of 1 h for
10
a complete cycle of 7 diameters). In the thermal chamber (i.e., at 300◦C) of the VT-DMA, the coating materials undergo volatilization leaving behind the non-volatile cores. Details about the VTDMA measurements at the Yufa site in 2006 can be found in Cheng et al. (2009) and Wehner et al. (2009). The volatilization results in a change of particle size, where unchanged particles indicate no coating material while big changes
indi-15
cate a large fraction of coating materials. In continental polluted megacity air, the ma-terial of sub-micrometer particles that is non-volatile at this temperature (i.e., 300◦C) is considered to be mostly “soot” (Smith and O’Dowd, 1996; Burtscher et al., 2001; Kondo et al., 2006, 2010; Rose et al., 2006; Frey et al., 2008; Cheng et al., 2009; Wehner et al., 2009), which consists mainly of black or elemental carbon but may also
20
contain some refractory organic matter (P ¨oschl, 2005; Sadezky et al., 2005; Andreae and Gelencs ´er, 2006). Since the VTDMA actually measures non-volatile-core contain-ing particles (NVP), the notation “soot (NVP)” was mostly used instead of “soot” when referring to the VTDMA results.
In VTDMA measurements, the size distribution of nonvolatile residuals is classified
25
into three groups according to Dp,300◦C/Dp, where Dp is the initial diameter of the
sampled dry particles andDp,300◦C is the diameter of the particle residual after being
heated at 300◦C. Following Wehner et al. (2009), (1) particles withD
ACPD
11, 32161–32204, 2011Measurement of the mixing state of soot
in the megacity Beijing
Y. F. Cheng et al.
Title Page
Abstract Introduction
Conclusions References
Tables Figures
◭ ◮
◭ ◮
Back Close
Full Screen / Esc
Printer-friendly Version Interactive Discussion
Discussion
P
a
per
|
Dis
cussion
P
a
per
|
Discussion
P
a
per
|
Discussio
n
P
a
per
|
were denoted as “high-volatile” and not considered as soot particles; (2) particles with 45 %< Dp,300◦C/Dp<82 % were denoted as “medium-volatile” and considered as
in-ternally mixed (coated) soot particles; and (3) Particles with 82 %< Dp,300◦C/Dp were
denoted as “low-volatile” and considered as externally mixed (uncoated) soot particles.
Fin, the number fraction of internally mixed soot particles (among all soot-containing
5
particles), was intensively used for discussion in this paper and calculated as,
Fin=nin/(nin+nex) (1)
whereninis the number concentration of internally mixed soot (NVP) particles, andnex
is the number concentration of externally mixed soot (NVP) particles.
2.3 The turnover rate of soot particles
10
The turnover rate,kex→in, is a parameter describing the conversion rate of the externally
mixed soot to internally mixed particles:
∂n
ex
∂t
ex→in
=
∂n
ex
∂t
cond
+
∂n
ex
∂t
coag
=−kex→innex+
∂n
ex
∂t
coag
(2)
where ∂nex/∂t
ex→inis the rate of change ofnexdue to aging (conversion) processes.
The two major aging processes are the condensation of sulfuric acid and organic
com-15
pounds and the coagulation of particles. For large particles or during daytime, the condensation dominates the aging processes (Jacobson, 1997; Riemer et al., 2004), which converted equal amounts of externally mixed soot to internally mixed. Then the rate of change ofnin due to aging (conversion) processes is
∂n
in
∂t
ex→in ≈ −
∂n
ex
∂t
ex→in
=kex→innex (3)
20
The values of nex and nin measured in field campaigns can be subject to other
pro-cesses, e.g., horizontal/vertical transport (Tranex and Tranin), emission (Emisex and
ACPD
11, 32161–32204, 2011Measurement of the mixing state of soot
in the megacity Beijing
Y. F. Cheng et al.
Title Page Abstract Introduction Conclusions References Tables Figures ◭ ◮ ◭ ◮ Back Close
Full Screen / Esc
Printer-friendly Version Interactive Discussion Discussion P a per | Dis cussion P a per | Discussion P a per | Discussio n P a per |
Emisin), and deposition (Depoex an Depoin):
∂nex
∂t =Tranex+Emisex+Depoex+
∂n
ex
∂t
ex→in
(4)
∂nin
∂t =Tranin+Emisin+Depoin+
∂n
in
∂t
ex→in
(5)
When aging is the only or dominant process affectingnexandnin,
∂nex ∂t ≈ ∂n ex ∂t
ex→in
=−kex→innex (6)
5 ∂nin ∂t ≈ ∂n in ∂t
ex→in
=kex→innex (7)
∂n
tot
∂t
ex→in
=
∂n
ex
∂t
ex→in
+
∂n
in
∂t
ex→in
=0 (8)
where∂ntot/∂tis the rate of change of total (ex+in) soot particles. (∂ntot/∂t)ex→in=0
indicates thatntotis constant in the aging (ex→in) process dominated by the
conden-sation.
10
In aging processes, the rate of change ofFin (Fin=nin/ntot) is
∂nin ntot
∂t
ex→in
=kex→in
nex ntot (9) ∂F in ∂t
ex→in
=kex→in(1−Fin) (10)
Then the turnover ratekex→in can be calculated by
kex→in=
∂Fin/∂t
ex→in
(1−Fin) ≈
∂Fin/∂t
(1−Fin)
≈ ∆
Fin/∆t
(1−Fin)
(11)
ACPD
11, 32161–32204, 2011Measurement of the mixing state of soot
in the megacity Beijing
Y. F. Cheng et al.
Title Page
Abstract Introduction
Conclusions References
Tables Figures
◭ ◮
◭ ◮
Back Close
Full Screen / Esc
Printer-friendly Version Interactive Discussion
Discussion
P
a
per
|
Dis
cussion
P
a
per
|
Discussion
P
a
per
|
Discussio
n
P
a
per
|
When aging (ex→in) dominates the variation of Fin, kex→in can be determined by
Eq. (11). When other processes become significant, this conclusion will not hold and
kex→in determined by Eq. (11) is called the “apparent” turnover rate. Increase rates
(∆Fin/∆t) of 1.0–2.3 % h− 1
andFinof 0.2–0.6 were reported in previous studies (Moteki
et al., 2007; Shiraiwa et al., 2007), corresponding to “apparent”kex→inof 1.3–5.8 % h− 1
.
5
2.4 CCN measurement and hygroscopicity (κ) distribution
Size-resolved CCN efficiency spectra (activation curves) were measured with a Droplet Measurement Technologies continuous flow CCN counter (DMT-CCNC) coupled to a Differential Mobility Analyzer (DMA; TSI 3071) and a Condensation Particle Counter (CPC; TSI 3762). The CCNC was operated at a total flow rate of 0.5 l min−1 with
10
a sheath-to-aerosol flow ratio of 10. The effective water vapor supersaturation (S) was regulated by the temperature difference between the upper and lower end of the CCNC flow column (∆T) and calibrated with ammonium sulfate aerosol as described by Rose et al. (2008). For a detailed description of CCN measurements in the campaign, see Gunthe et al. (2011).
15
Size-resolved CCN efficiency spectra can be used to derive the cumulative distri-bution function of particle hygroscopicity, H(κ, Dp), which is defined as the number
fraction of particles with a given dry diameter,Dp, and with an effective hygroscopicity
parameter smaller than the parameterκ (Su et al., 2010). The data conversion from
S-Dpspace toκ-Dpspace is achieved by solving theκ-K ¨ohler model equation (Petters
20
and Kreidenweis, 2007).
By fitting H(κ, Dp) with a cumulative single-mode lognormal distribution function
(CDF), the following parameters were calculated: κg, the geometric mean of κ in the
fitted mode; andσκ,g, the geometric standard deviation of κ in the fitted mode. The
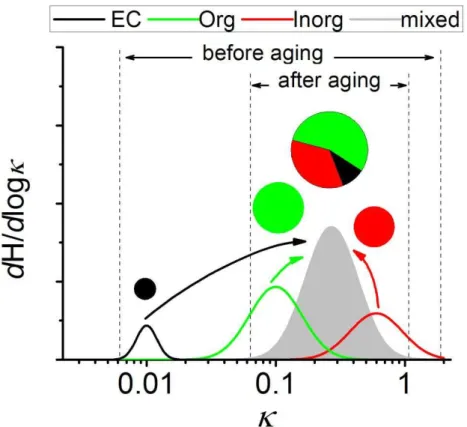
spread of the κ distribution, e.g., σκ,g, reflects the mixing state of aerosols: under
25
internally mixed conditions, all particles have the same composition and a uniform hy-groscopicity mode, while under externally mixed conditions, particles can have distinct hygroscopicity modes (see Fig. 1).
ACPD
11, 32161–32204, 2011Measurement of the mixing state of soot
in the megacity Beijing
Y. F. Cheng et al.
Title Page
Abstract Introduction
Conclusions References
Tables Figures
◭ ◮
◭ ◮
Back Close
Full Screen / Esc
Printer-friendly Version Interactive Discussion
Discussion
P
a
per
|
Dis
cussion
P
a
per
|
Discussion
P
a
per
|
Discussio
n
P
a
per
|
2.5 Air mass age indicator
The aging of soot particles results in a change of their mixing state, i.e., conversion of externally mixed to internally mixed soot. An aged air mass has a larger fraction of internally mixed soot than a fresh air mass. Therefore, correlations can be expected between an air mass age indicator and the soot mixing state parameter (e.g., Fin). If
5
such a correlation is significant, the soot mixing state could be parameterized by the air mass age indicators.
The age of air mass is a concept under the Lagrangian system. Ideally, the most fresh air mass is assigned an age of zero and its age will increase as the air mass becomes aged. The longer the air mass travels in the atmosphere, the older it will be.
10
However, this does not mean that the age of an air mass can become infinitely large, and injection of fresh emissions into the air mass would reduce its age.
To quantify air mass ages, several indicators have been proposed. They are based on the fact that the aging will change the chemical compositions of air masses and parameters reflecting such changes can indicate the aging stage. Three indicators
15
were used in this study.
[NOz]/[NOy]
In a fresh air mass from combustion sources, NOx(NOx=NO+NO2) are the dominant components of NOy (the total odd nitrogen compounds in the atmosphere). As
pho-tochemical reactions proceed, NOxevolves to other N-containing compounds such as
20
HNO3 and PAN, and the ratio of [NOz]/[NOy] (NOz=NOy−NOx) will increase. In this
study, the nitrogen oxides (NOx) and total reactive nitrogen (NOy) were measured
us-ing a NO-O3 chemiluminescence detector combined with a photolytic converter and
a gold tube catalytic converter (Takegawa et al., 2006)
[E]/[X]
25
ACPD
11, 32161–32204, 2011Measurement of the mixing state of soot
in the megacity Beijing
Y. F. Cheng et al.
Title Page
Abstract Introduction
Conclusions References
Tables Figures
◭ ◮
◭ ◮
Back Close
Full Screen / Esc
Printer-friendly Version Interactive Discussion
Discussion
P
a
per
|
Dis
cussion
P
a
per
|
Discussion
P
a
per
|
Discussio
n
P
a
per
|
and monotonic change of their ratios in the aging process. We used the ratio of ethyl-benzene and m,p-xylene ([E]/[X]) in this study. Ethylbenzene and m,p-xylene were measured by an online GC-PID (gas chromatograph-photo ionization detector) sys-tem, as detailed by Xie et al. (2008).
([IM]+[OM])/[EC]
5
As an air mass ages, more secondary aerosol is produced, which reduce the mass fraction of soot particles. ([IM]+[OM])/([EC]) could hence be used as an indicator, in which [IM]=[NH+4]+[NO−
3]+[SO 2−
4 ]+[Cl−] (inorganic ions in PM1measured by aerosol
mass spectrometer, AMS) and [OM] was the organic matter mass (in PM1)
deter-mined by AMS. An online Sunset EC/OC analyzer was used to measure the mass
10
concentrations of EC, [EC]. Details about the EC/OC analyzer and AMS can be found in Takegawa et al. (2009).
3 Results and discussion
3.1 The mixing state of soot and hygroscopicity
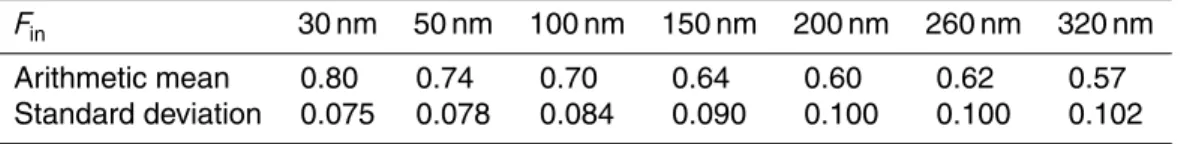
Table 1 summarizes statistics of Fin measurements from this campaign. The Fin
val-15
ues show a decreasing trend as the particle size Dp increases, ranging from an
Fin of 0.80±0.075 at Dp=30 nm to Fin of 0.57±0.102 at Dp=320 nm (arithmetic
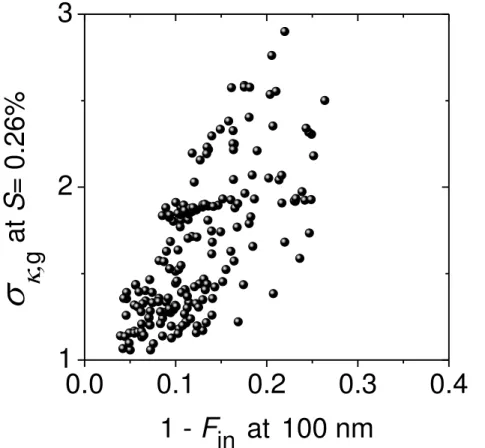
mean±standard deviation). Figure 2 shows a comparison of hourly Fin data with
σκ,g (the geometric standard deviation in a lognormal κ distribution, as detailed in
Sect. 2.4., and Su et al., 2010). The (1−Fin) is the number fraction of externally mixed
20
soot (NVP) particles. The two parameters,σκ,g and (1−Fin), are well correlated. This
means that more externally mixed soot (NVP) particles were observed when particles showed more heterogeneous features in their hygroscopicity distributions (largeσκ,g).
Such consistence gives confidence about the robustness of both parameters and the reliability of the measuring systems.
25
ACPD
11, 32161–32204, 2011Measurement of the mixing state of soot
in the megacity Beijing
Y. F. Cheng et al.
Title Page
Abstract Introduction
Conclusions References
Tables Figures
◭ ◮
◭ ◮
Back Close
Full Screen / Esc
Printer-friendly Version Interactive Discussion
Discussion
P
a
per
|
Dis
cussion
P
a
per
|
Discussion
P
a
per
|
Discussio
n
P
a
per
|
3.2 Diurnal cycle of the soot mixing state
Figure 3 shows a pronounced diurnal cycle ofFin, which also has a strong size
de-pendence. For accumulation mode particles (i.e., 100 nm to 320 nm, Fig. 3b), similar diurnal profiles ofFin can be found, with a maximum at∼13:00 LT (local time) and two
minimums, in the early morning∼7:00 LT and at night∼21:00 LT, respectively. As the
5
day progresses, an increase inFin (8:00–13:00 LT) is observed for accumulation mode
particles with “apparent” turnover rates of 6.7–7.8 % h−1.
In the Aitken mode, however, the variation ofFin is different to that in the
accumula-tion mode (Fig. 3a). The maximum ofFin appears earlier at ∼8:00 LT (atDp=30 nm)
and 12:00 LT (atDp=50 nm), and the afternoon minimumFin appears earlier as well.
10
The distinct behaviors of Aitken mode particles are shown by the correlation matrix in Table 2, whereFin of Aitken mode particles show poor correlations with the
accumu-lation mode particles. The reasons for such correaccumu-lations will be further discussed in Sect. 3.5.
For accumulation mode particles presented in Fig. 3b,Finshows a peak around noon
15
time. Such a diurnal cycle indicates that ground-based measurements were subject to competing effects from physico-chemical aging and the introduction of fresh emissions. While the aging increasesFinby turning externally mixed particles into internally mixed
ones, the fresh emissions, with lowFin, tend to reduce theFinvalues. Similar competing
effects can also be found in the diurnal courses of the air mass age indicators (e.g.,
20
[NOz]/[NOy], [E]/[X] and ([IM]+[OM])/[EC] in Fig. 4) and aerosol single scattering
albedo as reported in Garland et al. (2008).
3.3 Estimation of soot emission rate
Emissions have a significant impact on the measured Fin and the “apparent” kex→in
(soot turnover rate). Before determining the actualkex→in, we need to first quantify the
25
ACPD
11, 32161–32204, 2011Measurement of the mixing state of soot
in the megacity Beijing
Y. F. Cheng et al.
Title Page
Abstract Introduction
Conclusions References
Tables Figures
◭ ◮
◭ ◮
Back Close
Full Screen / Esc
Printer-friendly Version Interactive Discussion
Discussion
P
a
per
|
Dis
cussion
P
a
per
|
Discussion
P
a
per
|
Discussio
n
P
a
per
|
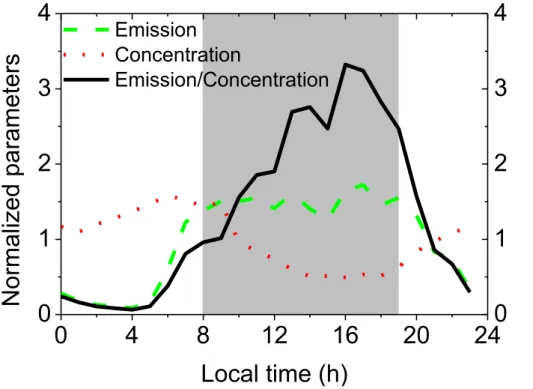
Figure 5 shows the diurnal cycles of three parameters: (1) normalized EC concen-trations during the campaign, (2) normalized total (ex+in) soot emission rates, and (3) the ratio of normalized emission rate to EC concentrations. The EC concentrations were determined by an online Sunset EC/OC analyzer (Takegawa et al., 2009); and the (total) soot emission rate was supposed to be proportional to the CO emissions in
5
Beijing (Zhou et al., 2010). The normalized parameters were defined as the ratio of the individual parameter to its daily average value. For example, given [EC] of 9 µg cm−3at 9:00 LT and a daily mean ([EC]) of 10 µg cm−3, the normalized EC concentration ([EC]∗) at 9:00 LT is then 0.9 (i.e., 0.9=9 µg cm−3/10 µg cm−3).
The sum of Eqs. (4) and (5) gives the total (ex+in) emissions of soot particles
10
Emistot=∆ntot
∆t −Trantot−Depotot and Emistot,m= ∆mtot
∆t −Trantot,m−Depotot,m (12)
where Emistot,m is the mass emission rate of soot, andmtot is the mass concentration
of soot.
To obtain an optimal estimate of Emistot (or Emistot,m), we adopted the following
cri-teria, eliminating days with average wind speed>2 m s−1(20, 22 August, 3, 4, 5, 6 and
15
8 September), excluding the time periods from 8:00 to 19:00 LT, and choosing periods with large Emistot,m/mtot. The goal is to minimize the impact of horizontal/vertical
trans-port and deposition, and choosing low wind speeds and night-time periods avoid large influence of horizontal transport and vertical mixing. Large Emistot,m/mtotensures that
the emission term could dominate the variation ofmtot.
20
In practice, we first calculated the diurnal variation of the three parameters (nor-malizedm∗
tot=[EC]∗, Emis∗tot,m, and Emis∗tot,m /m∗tot) on days with average wind speed
<2 m s−1. Then we looked for the highest ratios of Emis∗tot,m/m∗
tot (labeled as
“emis-sion/concentration” in Fig. 5) in the period of 20:00–7:00 LT. In the end, the optimal emission rate was determined by Emistot,m= ∆[EC]/∆tat 20:00 LT, when the selected
25
Emis∗tot,m/m∗
tot data reached its maximum. The ratio of the mean (mass) emission rate
to mean (mass) concentration, Emistot,m/[EC], can then be determined by
ACPD
11, 32161–32204, 2011Measurement of the mixing state of soot
in the megacity Beijing
Y. F. Cheng et al.
Title Page
Abstract Introduction
Conclusions References
Tables Figures
◭ ◮
◭ ◮
Back Close
Full Screen / Esc
Printer-friendly Version Interactive Discussion
Discussion
P
a
per
|
Dis
cussion
P
a
per
|
Discussion
P
a
per
|
Discussio
n
P
a
per
|
Emistot,m
[EC]
=Emistot,m
[EC] ×
[EC]∗ Emis∗
tot,m
≈∆[EC]/∆t
[EC] ×
[EC]∗ Emis∗
tot,m
at 20:00 LT≈13 % h−1 (13)
In the following analysis, we took the same value (13 % h−1) for the estimated ratio of the mean (number) emission rate to mean (number) concentration, Emistot/ntot.
3.4 Actual turnover rate of soot
In this section, a conceptual model was used to analyze the observed variation ofFin.
5
SinceFin of particles of all sizes in the accumulation mode (i.e., 100–320 nm) showed
similar behaviors,Fin at 150 nm is taken as an example and will be discussed through
this section.
Two processes were considered in the model: the aging process converting exter-nally mixed particles into interexter-nally mixed particles, and the addition of fresh emissions.
10
Equations (4) and (5) can be simplified as: ∆nin
∆t =
∂n
in
∂t
ex→in
+Emisin=kex→innex+Emisin (14)
∆nex
∆t =−kex→innex+Emisexand
∆ntot
∆t =Emistot (15)
wherekex→in denotes the turnover rate of externally mixed into internally mixed soot,
ntot is the number concentration of all soot particles (including both internally and
ex-15
ternally mixed ones), Emisin, Emisex, and Emistot are the emission rates of internally mixed, externally mixed, and total soot particles, respectively.
In Eqs. (14) and (15), we assumed that all (or most) particles stayed in the same size bin after the 1-h aging process. This assumption, to a large extent, simplified the following analysis, and could at least be valid for a broader size bracket, e.g., [100 nm,
20
350 nm]. The transport and dry deposition processes were supposed not to signifi-cantly changeFin (assuming nin and nex have the same gradient and dry deposition
ACPD
11, 32161–32204, 2011Measurement of the mixing state of soot
in the megacity Beijing
Y. F. Cheng et al.
Title Page
Abstract Introduction
Conclusions References
Tables Figures
◭ ◮
◭ ◮
Back Close
Full Screen / Esc
Printer-friendly Version Interactive Discussion
Discussion
P
a
per
|
Dis
cussion
P
a
per
|
Discussion
P
a
per
|
Discussio
n
P
a
per
|
The variation of Fin in the time interval ∆t can be derived by combining Eqs. (14)
and (15):
∆Fin=
nin+ ∆nin
ntot+ ∆ntot
−Fin=
nin+(kex→in(ntot−nin)+Emisin)∆t
ntot+Emistot∆t
−Fin (16)
Thenkex→in can be expressed as a function ofntot,Fin, Emistot and Emisin,
kex→in=
(∆Fin+Fin)(1+Emistot∆t
ntot )−Fin−
Emisin∆t ntot
(1−Fin)∆t
(17)
5
where, ntot and Fin can be determined by VTDMA measurements. Emistot can be
calculated by multiplying a generic diurnal cycle of emissions in Beijing (Fig. 5) by the estimated emission intensity (Emistot/ntot) of 13 % h−
1
(details in Sect. 3.3). Emisincan
be calculated by multiplying Emistot with an emission factor, β=Emisin/Emistot. The minimumFin∼0.6 can be considered as the upper limit ofβ, and we also chose several
10
otherβvalues (0.2 and 0.4) for sensitivity studies.
Figure 6 shows the diurnal cycles of campaign-averaged kex→in calculated for
par-ticles at 150 nm with different β. Compared to a fixedkex→in value commonly used in
regional and global models, the observation-constrained kex→in shows higher values
with a maximum around 11:00–15:00 LT, and low values in the early morning and late
15
afternoon. Such a diurnal course always holds, even after varying Emistot by a factor
of two (6.5–26 % h−1). The cycle of the turnover rate,kex→in, supports previous results
in modeling studies (Riemer et al., 2004, 2010), which show high daytimekex→in dom-inated by condensation processes, and lowkex→in contributed by both slower
conden-sation and coagulation processes in the early morning and late afternoon. Although
20
kex→in were also calculated for night-time periods, attention should be paid to these values. Because the coagulation-induced aging would become more important than the condensation, which violates the assumption of our model calculations.
Since the condensation-induced turnover rate is proportional to the condensable va-por pressure, the derived daytimekex→inimplies a peak of condensable vapor pressure
25
ACPD
11, 32161–32204, 2011Measurement of the mixing state of soot
in the megacity Beijing
Y. F. Cheng et al.
Title Page
Abstract Introduction
Conclusions References
Tables Figures
◭ ◮
◭ ◮
Back Close
Full Screen / Esc
Printer-friendly Version Interactive Discussion
Discussion
P
a
per
|
Dis
cussion
P
a
per
|
Discussion
P
a
per
|
Discussio
n
P
a
per
|
at the same period (11:00–15:00 LT). It is already known that gaseous sulfuric acid (precursor of sulfate in particles) often shows a peak around noon time. Our results indicate that even the potentially present un-identified condensable vapors might have similar diurnal cycles as sulfuric acid. Instead of complete characterizations of these un-identified vapors, the similarity in their diurnal variations enables the use of a simple
5
parameterization method as an alternative solution in aerosol modeling studies, as will be discussed below.
Due to the presence of primary emission sources, the actual turnover rate of soot,
kex→in is higher than the “apparent”kex→in. The freshly emitted particles contain more
externally mixed soot than the aged ambient air. The observed “aging” of soot (NVP) is
10
to a certain extent compensated by the fresh emissions, the extent of which depends on the emission intensity. For the estimated emission intensity (Emistot/ntot) of 13 % h−
1
andβ=0.6, kex→in values reached up to 20 % h− 1
(see Fig. 6), much faster than the apparentkex→inof 6.7–7.8 % h−
1
.
The aging process in Beijing is also much faster than kex→in of 1.3–5.8 % h− 1
in
15
previous field measurements (Moteki et al., 2007; Shiraiwa et al., 2007) and 1.25– 2.5 % h−1 in modeling studies (Cooke and Wilson, 1996; Cooke et al., 1999, 2002; Lohmann et al., 2000; Jacobson, 2001; Koch, 2001; Tsigaridis and Kanakidou, 2003; Riemer et al., 2004). The fast turnover rate in the polluted megacity air is consistent with the observed rapid particle growth in the same area (Wiedensohler et al., 2009),
20
both of which can be attributed to the fast formation and condensation of secondary aerosols in the megacity. The flow of soot particles from megacities influences the global background of soot to a large extent. If those soot particles are already coated or internally mixed in a very short time due to strong condensation, the background soot should be mostly internally mixed, as has been suggested by Andreae and Rosenfeld
25
(2008).
Figure 6 also shows that the absolute value ofkex→instrongly depends on the choice
of the emission factorβ, while the relative variation ofkex→indoes not. Smallerβvalues
ACPD
11, 32161–32204, 2011Measurement of the mixing state of soot
in the megacity Beijing
Y. F. Cheng et al.
Title Page
Abstract Introduction
Conclusions References
Tables Figures
◭ ◮
◭ ◮
Back Close
Full Screen / Esc
Printer-friendly Version Interactive Discussion
Discussion
P
a
per
|
Dis
cussion
P
a
per
|
Discussion
P
a
per
|
Discussio
n
P
a
per
|
observed Fin variations. For example, β=0.2 requireskex→in up to 70 % h− 1
to meet the observations. On the other hand, kex→in up to 20 % h−
1
require a large β=0.6, which means that 60 % of the emitted soot particles should have already been internally mixed when they arrive at the measurement site.
3.5 Distinct diurnal variations ofFinfor Aitken and accumulation mode particles
5
In the conceptual model, we assume that particle growth will not lead to significant change inntot andnex, which means no significant shift of the particle size distribution
occurs over a short time. While such an assumption is valid for large particles in the accumulation mode (i.e.,>100 nm), it might be violated by the faster growth of small particles (e.g., 30 nm) in the Aitken mode, which was reflected by the different diurnal
10
cycles ofFin at smaller diameters (see Fig. 3).
To describe the rate of change of a particle size distributionn(Dp) resulting from
con-densation, we adopted a general condensation equation (Seinfeld and Pandis, 2006, pp. 591) in the form
∂n n∂t=−
∂ n∂Dp
(n 4DM RT Dpρp
f(Kn,α)P) (18)
15
wherendenotes the particle number concentration atDp, M is the molecular weight
for the condensable species, D is its diffusion coefficient in air, R is the molar gas constant, T is the temperature (in Kelvin),ρp is the density of the particles, P is the
supersaturated vapor pressure of the condensable species,Knis the Knudsen number (Kn=2λ/Dp), λis the mean free path of the condensable species in air, andα is the
20
accommodation coefficient of the condensable species. f(Kn,α) is the correction due to non-continuum effects and imperfect surface accommodation and can be calculated by
f(Kn,α)= 0.75α(1+Kn)
Kn2+Kn+0.283Knα+0.75α (19)
ACPD
11, 32161–32204, 2011Measurement of the mixing state of soot
in the megacity Beijing
Y. F. Cheng et al.
Title Page
Abstract Introduction
Conclusions References
Tables Figures
◭ ◮
◭ ◮
Back Close
Full Screen / Esc
Printer-friendly Version Interactive Discussion
Discussion
P
a
per
|
Dis
cussion
P
a
per
|
Discussion
P
a
per
|
Discussio
n
P
a
per
|
Dividing both sides of Eq. (18) byA=4DMP/(RT ρp), we get a parameterkshift:
kshift=
1
A ∂n n∂t=−
∂ n∂Dp
( n
Dp
f(Kn,α)) (20)
kshift differs from (∂n/∂t)/n in Eq. (18) by a factor of A, which is generally/mostly
independent of particle sizes. So, kshift is equivalent to (∂n/∂t)/n in representing
the size dependence of the rate of change ofn due to condensation. By taking the
5
measuredn(Dp) and λ=λair (298 K, 1 atm)=65.1 nm (Seinfeld and Pandis, 2006, p.
399),kshift can be calculated for eachDp.
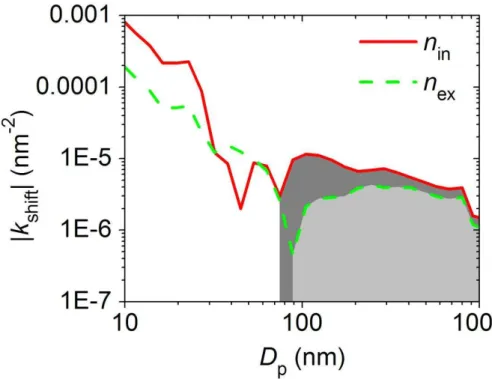
Figure 7 showskshiftas a function of the particle sizeDp, calculated with Eqs. (18)–
(20) for the CAREBeijing 2006 campaign. The (mean) size distributions of the internally (externally) mixed soot (NVP) particles were used in the calculation (Wehner et al.,
10
2009). Since VTDMA measurements covered only a limited size range (from 30 nm to 320 nm), nearest neighbor extrapolation were performed for out of range values, i.e. [1 nm, 30 nm) and (320 nm, 1000 nm] as shown in Fig. 7. kshift shows positive values
roughly on the right side of the peak of the particle size distributions and negative values on the left side. Positive kshift (at Dp in shaded areas) indicate
condensation-15
induced increases in n(Dp) while negative kshift (at Dp in un-shaded areas) indicate
condensation-induced decreases inn(Dp). Since the peaks of thenin(Dp) andnex(Dp)
distributions appears at sizes smaller than 100 nm, the condensation growth generally increasesnin(Dp) in the accumulation mode and reducesnin(Dp) at theDpof 30 nm.
Equation (21) describes the rate of change of internally mixed soot particles due to
20
the condensational growth
∆nin
∆t =Aninkin,shift (21)
wherekin,shiftrepresentkshiftof internally mixed soot particles.
For externally mixed soot particles, the condensational growth results in a rate of change in the opposite direction of Eq. (21). Laboratory experiments showed that
ACPD
11, 32161–32204, 2011Measurement of the mixing state of soot
in the megacity Beijing
Y. F. Cheng et al.
Title Page
Abstract Introduction
Conclusions References
Tables Figures
◭ ◮
◭ ◮
Back Close
Full Screen / Esc
Printer-friendly Version Interactive Discussion
Discussion
P
a
per
|
Dis
cussion
P
a
per
|
Discussion
P
a
per
|
Discussio
n
P
a
per
|
(externally mixed) soot agglomerates after sulfuric acid exposure (condensation) ex-hibit a considerable restructuring and shrinking to a more compact form (Zhang et al., 2008). By assuming a shrink speed (ofnex) similar to the growth speed (ofnin), the rate
of change of externally mixed soot particles due to condensational growth can be ex-pressed by Eq. (22), in whichεis the conversion coefficient of the growing to shrinking
5
speed.
∆nex
∆t =−Aεnexkex,shift (22)
∆ntot
∆t =
∆nin+ ∆nex
∆t =Aninkin,shift−Aεnexkex,shift (23)
According to Eqs. (22) and (23), the condensation-induced shift of size distributions tends to reduce Fin of Aitken mode particles (a decrease in nin and an increase in
10
nex) while the emissions begin to counteract (or buffer) the influence of condensation.
In Fig. 3a, the variation of Fin at Dp=30 nm is a good example of such competition:
the condensation overwhelmed the emissions at 8:00–15:00 LT causing a decrease in
Fin, while the emission became more important from 15:00 to 19:00 LT resulting in an
increasingFin. For particles atDp=50 nm, kin,shift is not as fast as that at 30 nm. So
15
the emissions andkex→in needed to be considered along withkin,shift, which results in
an intermediate variation ofFin.
3.6 Size-resolved parameterizations ofFin
Because of our insufficient knowledge on mixing states and their change and the com-putational costs associated with explicit modeling of the mixing processes, it is still
20
difficult to explicitly and accurately predict the variation ofFin in regional/climate
mod-els. In an aging air mass, the change of soot mixing state is generally accompanied by the change of other indicators representing the air mass age. We suggest param-eterizing the mixing state of soot by using these correlations. If the other indicators
ACPD
11, 32161–32204, 2011Measurement of the mixing state of soot
in the megacity Beijing
Y. F. Cheng et al.
Title Page
Abstract Introduction
Conclusions References
Tables Figures
◭ ◮
◭ ◮
Back Close
Full Screen / Esc
Printer-friendly Version Interactive Discussion
Discussion
P
a
per
|
Dis
cussion
P
a
per
|
Discussion
P
a
per
|
Discussio
n
P
a
per
|
are easier to measure and model, such parameterizations might provide an alternative solution, narrowing down the differences between ambient and modeled soot mixing state without significant additional computational costs.
The proposed parameterization approach involves two steps to calculate Fin from
other indicators. First, the average diurnal values of Fin and other parameters (as
5
shown in Figs. 3 and 4) are adopted to calculate a linear fit, resulting in the parameteri-zation Eqs. (24)–(26). The reason for using average values is to smooth out fluctuations which may greatly reduce the correlation coefficientR and introduce large uncertain-ties into the fitting results. Fin at certain diameter (i.e., 150 nm) can be predicted by
parameterization Eqs. (24)–(26). Figure 8a–c shows comparisons ofFinat 150 nm with
10
individual indicators, namely, [NOz]/[NOy], [E]/[X] and ([IM]+[OM])/[EC].
Fin(150 nm)=0.572+0.209
[NOz]
[NOy]
(24)
Fin(150 nm)=0.468+0.212
[E]
[X] (25)
Fin(150 nm)=0.522+0.0088
[IM]+[OM]
[EC] (26)
Secondly, the size-resolved Fin in the accumulation mode can be calculated by the
15
following equation fromFin at 150 nm:
Fin(Dp)=(alog10(Dp/1 nm)+b)Fin(150 nm) (27)
whereaandbare constant parameters.
Fitting Eq. (27) to the measuredFin over the diameter range 100 nm to 320 nm, we gota=−0.353 (−0.370,−0.336) (coefficients with 95 % confidence bounds), b=1.78
20
(1.74, 1.82), andR2=0.80. Figure 9 and Table 3 shows that Eq. (27) performs well in predicting the size-resolvedFinover the size range between 100 nm and 320 nm. There
ACPD
11, 32161–32204, 2011Measurement of the mixing state of soot
in the megacity Beijing
Y. F. Cheng et al.
Title Page
Abstract Introduction
Conclusions References
Tables Figures
◭ ◮
◭ ◮
Back Close
Full Screen / Esc
Printer-friendly Version Interactive Discussion
Discussion
P
a
per
|
Dis
cussion
P
a
per
|
Discussion
P
a
per
|
Discussio
n
P
a
per
|
the same as the 1 : 1 line. Most variations, i.e., up to 77 %, ofFin can be predicted by
the parameterization.
4 Conclusions
Analysis of VTDMA results from the megacity Beijing shows a pronounced diurnal variation ofFin with different time courses in the Aitken and accumulation modes. For
5
accumulation mode particles, maxima ofFin were observed at 12:00–13:00 LT, which
can be explained by competing effects of physicochemical conversion and direct emis-sions. The distinct diurnal cycles ofFin of Aitken and accumulation mode particles are
likely to be caused by faster growth of smaller Aitken mode particles.
To calculate the actual turnover rate of soot from external to internal mixture (kex→in),
10
measurement data were analyzed by a conceptual model, which considered both direct emissions and the aging process. The analysis shows that the actualkex→in has high
values during daytime, i.e., a maximum around 11:00–15:00 LT, and low values during the night-time. Turnover rates reached values of 20–70 % h−1
around mid-day, which implies that soot (NVP) particles are present to a large extent as internal mixtures by
15
the time the leave the urban environment. This enables them to act as CCN and also facilitates their removal by wet deposition (Andreae and Rosenfeld, 2008). The cycle of
kex→in supports previous modeling results implying that the un-identified condensable
vapors might have similar diurnal variations as sulfuric acid and other short life-time compounds produced by photochemistry. We also found that due to injection of fresh
20
emissions, the “apparent” turnover rates derived from the variation in Fin were much
smaller than the actualkex→in.
In this study, the calculated kex→in might be subject to potential uncertainties due
to: (1) the estimation of Emistot (soot emission intensity) and β (number fraction of
internally mixed soot particles in emissions); (2) the effect of transport process; and
25
(3) the influence of particle growth and coagulation. To better understand the soot aging process, we suggest measuringβin some emission studies, combining regional
ACPD
11, 32161–32204, 2011Measurement of the mixing state of soot
in the megacity Beijing
Y. F. Cheng et al.
Title Page
Abstract Introduction
Conclusions References
Tables Figures
◭ ◮
◭ ◮
Back Close
Full Screen / Esc
Printer-friendly Version Interactive Discussion
Discussion
P
a
per
|
Dis
cussion
P
a
per
|
Discussion
P
a
per
|
Discussio
n
P
a
per
|
models to quantify the transport effects, and implementing aerosol dynamic models instead of the current conceptual model.
Fin shows a similar diurnal course as the other air mass age indicators (e.g.,
[NOz]/[NOy], [E]/[X] and ([IM]+[OM])/[EC]), which are subject to competing effects
between emissions and aging processes as well. The good agreement of their
corre-5
lations can be expressed as a linear relationship. Given the difficulty of making direct measurements of soot mixing state (Fin), these relationships might be of great practical
value in regional/global-scale studies on the influence of the various direct and indirect soot aerosol effects on climate, as it provides an easily measured proxy that does not consume significant additional computing time. However, such parameterizations
re-10
quire caveats because considerable variability can be expected between different sites or even at a given site, like the scattered data shown in Figs. 8 and 9. To validate the parameterization methods, improve our understanding and refine the range of the fitting parameters, more measurements should be carried out in other environments. In addition, validation for particles larger than 320 nm needs to be performed in future
15
studies.
Appendix A
See Tables A1 and A2 for acronyms and symbols.
Supplementary material related to this article is available online at: http://www.atmos-chem-phys-discuss.net/11/32161/2011/
20
acpd-11-32161-2011-supplement.pdf.
Acknowledgements. The CAREBeijing 2006 campaign was supported by the Beijing Council of Science and Technology (HB200504-6, HB200504-2). This study was supported by the Max Planck Society (MPG), the Leibniz Institute for Tropospheric Research (IfT), Peking Uni-versity, and the University of Tokyo (UT). Hang Su’s work was supported in part by MPG, the
ACPD
11, 32161–32204, 2011Measurement of the mixing state of soot
in the megacity Beijing
Y. F. Cheng et al.
Title Page
Abstract Introduction
Conclusions References
Tables Figures
◭ ◮
◭ ◮
Back Close
Full Screen / Esc
Printer-friendly Version Interactive Discussion
Discussion
P
a
per
|
Dis
cussion
P
a
per
|
Discussion
P
a
per
|
Discussio
n
P
a
per
|
Pan-European Gas-AeroSOls-climate interaction Study (No. 265148, PEGASOS) and the Eu-ropean integrated project on aerosol cloud climate and air quality interactions (No. 036833-2, EUCAARI). Y. Kondo and N. Takegawa were supported by the Ministry of Education, Culture, Sports, Science, and Technology (MEXT) and the global environment research fund of the Japanese Ministry of the Environment (A-0803 and A-1101). Thanks are owed to all the team
5
members of CAREBeijing 2006 for support during the campaign.
References
Andreae, M. O. and Gelencs ´er, A.: Black carbon or brown carbon? The nature of light-absorbing carbonaceous aerosols, Atmos. Chem. Phys., 6, 3131–3148, doi:10.5194/acp-6-3131-2006, 2006.
10
Andreae, M. O. and Rosenfeld, D.: Aerosol-cloud-precipitation interactions. Part 1. The nature and sources of cloud-active aerosols, Earth-Sci. Rev., 89, 13–41, doi:10.1016/j.earscirev.2008.03.001, 2008.
Bergstrom, R. W., Pilewskie, P., Russell, P. B., Redemann, J., Bond, T. C., Quinn, P. K., and Sierau, B.: Spectral absorption properties of atmospheric aerosols, Atmos. Chem. Phys., 7,
15
5937–5943, doi:10.5194/acp-7-5937-2007, 2007.
Bond, T. C., Habib, G., and Bergstrom, R. W.: Limitations in the enhancement of visible light absorption due to mixing state, J. Geophys. Res., 111, D20211, doi:10.1029/2006JD007315, 2006.
Burtscher, H., Baltensperger, U., Bukowiecki, N., Cohn, P., H ¨uglin, C., Mohr, M., Matter, U.,
20
Nyeki, S., Schmatloch, V., Streit, N., and Weingartner, E.: Separation of volatile and non-volatile aerosol fractions by thermodesorption: instrumental development and applications, J. Aerosol Sci., 32, 427–442, doi:10.1016/s0021-8502(00)00089-6, 2001.
Calvert, J.: Hydrocarbon involvement in photochemical smog formation in Los Angeles atmo-sphere, Environ. Sci. Technol., 10, 256–262, 1976.
25
Cheng, Y. F., Eichler, H., Wiedensohler, A., Heintzenberg, J., Zhang, Y. H., Hu, M., Herr-mann, H., Zeng, L. M., Liu, S., Gnauk, T., Br ¨uggeHerr-mann, E., and He, L. Y.: Mixing state of elemental carbon and non-light-absorbing aerosol components derived from in situ parti-cle optical properties at Xinken in Pearl River Delta of China, J. Geophys. Res., 111, D20204, doi:10.1029/2005JD006929, 2006.
30
ACPD
11, 32161–32204, 2011Measurement of the mixing state of soot
in the megacity Beijing
Y. F. Cheng et al.
Title Page
Abstract Introduction
Conclusions References
Tables Figures
◭ ◮
◭ ◮
Back Close
Full Screen / Esc
Printer-friendly Version Interactive Discussion
Discussion
P
a
per
|
Dis
cussion
P
a
per
|
Discussion
P
a
per
|
Discussio
n
P
a
per
|
Cheng, Y. F., Wiedensohler, A., Eichler, H., Heintzenberg, J., Tesche, M., Ansmann, A., Wendisch, M., Su, H., Althausen, D., Herrmann, H., Gnauk, T., Br ¨uggemann, E., Hu, M., and Zhang, Y. H.: Relative humidity dependence of aerosol optical properties and direct radiative forcing in the surface boundary layer at Xinken in Pearl River Delta of China: an observation based numerical study, Atmos. Environ., 42, 6373–6397, 2008a.
5
Cheng, Y. F., Wiedensohler, A., Eichler, H., Su, H., Gnauk, T., Br ¨uggemann, E., Herrmann, H., Heintzenberg, J., Slanina, J., Tuch, T., Hu, M., and Zhang, Y. H.: Aerosol optical properties and related chemical apportionment at Xinken in Pearl River Delta of China, Atmos. Environ., 42, 6351–6372, 2008b.
Cheng, Y. F., Berghof, M., Garland, R. M., Wiedensohler, A., Wehner, B., M ¨uller, T., Su, H.,
10
Zhang, Y. H., Achtert, P., Nowak, A., P ¨oschl, U., Zhu, T., Hu, M., and Zeng, L. M.: Influence of soot mixing state on aerosol light absorption and single scattering albedo during air mass aging at a polluted regional site in Northeastern China, J. Geophys. Res., 114, D00G10, doi:10.1029/2008jd010883, 2009.
Cooke, W. F. and Wilson, J. J. N.: A global black carbon aerosol model, J. Geophys. Res., 101,
15
19395–19409, 1996.
Cooke, W. F., Liousse, C., Cachier, H., and Feichter, J.: Construction of a 1◦
×1◦fossil fuel emission data set for carbonaceous aerosol and implementation and radiative impactor in the ECHAM4 model, J. Geophys. Res., 104, 22137–22162, 1999.
Cooke, W. F., Ramaswamy, V., and Kasibhatla, P.: A general circulation model study
20
of the global carbonaceous aerosol distribution, J. Geophys. Res., 107(D16), 4279, doi:10.1029/2001JD001274, 2002.
Engler, C., Rose, D., Wehner, B., Wiedensohler, A., Br ¨uggemann, E., Gnauk, T., Spindler, G., Tuch, T., and Birmili, W.: Size distributions of non-volatile particle residuals (Dp<800 nm) at a rural site in Germany and relation to air mass origin, Atmos. Chem. Phys., 7, 5785–5802,
25
doi:10.5194/acp-7-5785-2007, 2007.
Frey, A., Rose, D., Wehner, B., M ¨uller, T., Cheng, Y., Wiedensohler, A., and Virkkula, A.: Application of the volatility-TDMA technique to determine the number size distribution and mass concentration of less volatile particles, Aerosol Sci. Tech., 42, 817–828, doi:10.1080/02786820802339595, 2008.
30


![Fig. 4. Averaged diurnal variation of [NO z ]/[NO y ], [E]/[X] and ([IM] + [OM])/[EC]](https://thumb-eu.123doks.com/thumbv2/123dok_br/18431465.362158/39.918.96.618.113.499/fig-averaged-diurnal-variation-e-im-om-ec.webp)