www.ann-geophys.net/29/1113/2011/ doi:10.5194/angeo-29-1113-2011
© Author(s) 2011. CC Attribution 3.0 License.
Annales
Geophysicae
Could periodic patterns in human mortality be sensitive to solar
activity?
R. D´ıaz-Sandoval1, R. Erd´elyi1, and R. Maheswaran2
1Solar Physics and Space Plasma Research Centre, School of Mathematics and Statistics, University of Sheffield,
Hicks Building, Hounsfield Rd, Sheffield S3 7RH, UK
2Public Health GIS Unit, School of Health and Related Research, University of Sheffield, Regent Court, 30 Regent St,
Sheffield S1 4DA, UK
Received: 31 December 2010 – Revised: 11 March 2011 – Accepted: 18 March 2011 – Published: 25 June 2011
Abstract. Seasonal behaviour of human diseases have been observed and reported in the literature for years. Although the Sun plays an essential role in the origin and evolution of life on Earth, it is barely taken into account in biological processes for the development of a specific disease. Higher mortality rates occur during the winter season in the Northern Hemisphere for several diseases, particularly diseases of the cardiovascular and respiratory systems. This increment has been associated with seasonal and social causes. However, is there more behind these correlations, in particular in terms of solar variability? In this paper we attempt to make a first step towards answering this question. A detailed wavelet analysis of periodicities for diseases from England and Wales seem to reveal that mortality periodicities (3 days to half a year) could be due to the Earth’s position around the Sun. Moreover, crosswavelet and wavelet coherence analysis show common features between medical diseases and solar proxies around solar maximum activity suggesting that this relation, if any, has to be searched in times of high solar activity.
Keywords. Electromagnetics (Biological effects) – Geo-magnetism and paleoGeo-magnetism (BioGeo-magnetism; Time vari-ations, diurnal to secular)
1 Introduction
Periodic behaviour in mortality is reported elsewhere in the literature (e.g., Healy, 2003). The annual increment at the end of the year in cardiac, mental and asthma diseases is well known and has been often associated with weather conditions (Weiss, 1990; Sheth et al., 1999). These increments have also
Correspondence to: R. D´ıaz-Sandoval ([email protected])
been related to the social behaviour of humans during holi-days and close to Christmas and New Year time (Phillips et al., 2004). Moreover, there are some claims (Breus et al., 2008) that propose solar activity as an environmental condi-tion for the resonant response of human diseases. Solar ac-tivity is changing all the time; following well known periodic patterns that reach a minimum approximately every 11 years, passing for periods of maximum activity. The most stud-ied feature of this activity has been the sunspots, which have been registered on a daily basis since 1818 (NOAA Solar Data Services website). Transient phenomena as solar flares and coronal mass ejections are more common during peri-ods of high activity and propagate along the interplanetary medium (see Kane, 2005, for a review) reaching the planets of the solar system and even screening the arrival of cosmic rays coming from galactic sources. Depending on the elec-tromagnetic conditions of the Earth’s magnetosphere, some of these transients can affect the Earth’s environment caus-ing geomagnetic storms, auroras or changes in the electronic content of the ionosphere (Kane, 2005). Solar transient and cosmic ray behaviour has also been related with electric at-mospheric conditions such as lightning (Schlegel et al., 2001) and Schumann resonances (S´atori et al., 2005) which have periodic components similar to brain wave frequencies (Di-renfeld, 1983). Some hypotheses suggest that these atmo-spheric resonances could affect the human nervous system and as a consequence alter the human being homoeostasis causing or contributing to the development of a particular disease in weak biologic systems (Cherry, 2002).
1114 R. D´ıaz-Sandoval et al.: Periodic patterns in human mortality and solar activity years in order to elucidate this controversial conjecture.
An-nual, weekly, and semi-weekly periodicities have been found in cardiac diseases from diverse databases (Corn´elissen et al., 2002; D´ıaz-Sandoval et al., 2008, and references therein) and also in geomagnetic proxies. Moreover, cardiac and mental diseases show statistical relations with solar cycle, Ap geomagnetic index, and sudden decrements (Forbush de-creases) in cosmic ray counts (Palmer et al., 2006, and refer-ences therein) in ground-based monitors. Electroencephalo-graphic patterns present alterations during severe geomag-netic storms (Babayev and Allahverdiyeva, 2007). Cell ions and proteins show periodic behaviour in the presence of mag-netic fields (Ulmer, 2002) and recently, there are hypotheses that ultraviolet radiation coming from the Sun in different so-lar activity stages could be a main factor for the development of human immune system (Davis Jr. and Lowell, 2006).
In this paper we analyse periodicities of medical data from England and Wales covering most of Solar Cycle 23. Using wavelets (Torrence and Compo, 1998), a recent mathemat-ical tool developed to study the periodic behaviour of non-stationary series in the time-frequency space, we explore pe-riodic patterns in medical data during the months when the Earth’s relative position is close and far away from the Sun. We found a higher content of high-frequency periodicities (above the 95% confidence level for wavelet scale average) when the Earth is closer to the Sun. This occurs mostly for short period bands for 88.9% of the cases; in fact, 77.8% of them show increases larger than 1.5 times. Moreover, we determine the level of coherence between periodicities of medical series and solar/geomagnetic activity proxies using cross wavelet and wavelet coherence analysis (Grinsted et al., 2004), finding a high coherence of annual and semi-annual frequencies when the sunspots and AA and Ap geomagnetic indices are close to their maxima.
2 Data and methodology
Medical data was obtained from the Office for National Statistics, United Kingdom for England and Wales and con-sisted in dataset of the number of daily mortality for the period dating from 1 January 1997 to 31 December 2005 (3287 days) for the following diseases: 409 984 cases of Heart attack known as Myocardial Infarction Disease (MID); 450 011 cases of Cerebrovascular Disease (CVD); 82 412 cases of Heart Failure (HF); and 10 877 cases of Asthma. MID is split in three age groups: 0–64 years (58 248 cases), 65–74 years (95 206 cases) and over 75 years (256 530 cases). CVD has the same division groups: 0–64 years (23 721 cases), 65–74 years (57 948 cases) and over 75 years (368 342 cases). Asthma is split in two age groups: 0–74 years (5579 cases) and over 75 years (5298 cases). HF is not split.
Based on previous studies about the analysis of the rela-tionship between solar activity and medical diseases (Palmer
et al., 2006, and references therein), sunspot, AA and Ap geomagnetic indices were chosen. The sunspots daily num-ber is a widely used proxy of solar activity (Kane, 2005). AA geomagnetic index is a proxy of daily global geomag-netic activity measured for two antipodal stations and the Ap geomagnetic index is a proxy of daily global geomag-netic activity averaged for twelve stations (Mayaud, 1980). The three of them were obtained from the National Oceanic and Atmospheric Administration (NOAA), USA database (http://www.ngdc.noaa.gov/stp/SOLAR) and cover the same period as the medical diseases series (from 1 January 1997 to 31 December 2005). The studied time period began sixth months after the solar minimum of Solar Cycle 23 that oc-curred in May 1996 (Kane, 2001). On the other hand, sunspot maximum took place on March 2000 (Kane, 2001). The solar minimum of Solar Cycle 24 has not yet fully de-termined at the present due to a recent long and unusual pe-riod of low solar activity. AA and Ap indices reached their maximum values on 11 May 2003 (381.25γ) and 19 June 2003 (246γ), respectively (numbers extracted from NOAA databases).
For medical and heliogeophysical data, we performed a time behaviour analysis and an analysis of frequencies using the Fast Fourier Transform (Press, 1992) and the Wavelets Transform methods (Torrence and Compo, 1998; Grinsted et al., 2004). The Fast Fourier Transform (FFT) computes the Discrete Fourier Transform, which extracts the periodic com-ponents of a time series using sinus and cosines basis (Press, 1992). The obtained plot is a variation of power spectral density as a function of frequency until a certain limit value, called the Nyquist frequency which is equal to 1/(21t) where 1t is the sampling time. The FFT spectrum gives informa-tion about frequency content in a time series within a given period of time. In order to determine significant peaks, we used a t-test following the methodology explained by Jenk-ins and Watts (1967). However, for non-stationary series, FFT does not give enough information about time evolution of frequency peaks but only gives a global spectrum of the periodicities. On the other hand, wavelet transform is capa-ble of analysing variations of power in the time-frequency space. It means that the wavelet transform may extract fre-quency information from a signal in a defined period of time. Assuming a time seriesxnwith equal time spacing1t, the continuous wavelet transform is defined as the convolution ofxn with a wavelet function called “mother wavelet” that depends on two parameters, time and scale. By varying the scale and translating the wavelet in time, it is possible to con-struct a rather complete picture of periodic features in the time-frequency space (Torrence and Compo, 1998).
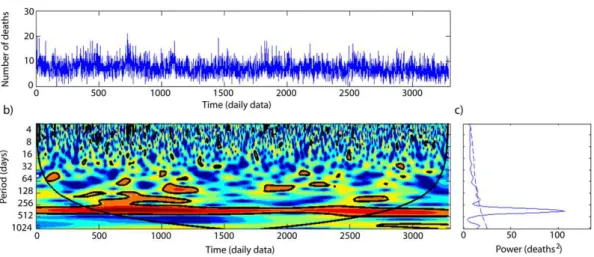
Fig. 1. Wavelet analysis for CVD 0–64 years group. (a) Time series. (b) Power wavelet spectrum. (c) Global wavelet spectrum. (d) Scale
average time series for the following frequency bands: 3–4, 6–8, 12–16, 25–32, 32–64, 64–128, 128–256, 330–400, 500–600, 601–700 days.
to determine the level of coherence of two time series based on the wavelet transform (Grinsted et al., 2004). The cross wavelet transform shows the common power and the rela-tive phase of two series in time-frequency space. This is an initial measurement of the level of relation between two se-ries in time-frequency space. Wavelet coherence is analo-gous to cross wavelet analysis but introduces a smoothing operator in order to localize all possible common power and relative phase of the two series and not only the higher com-mon power. These two analyses are used in a complementary way here.
3 Time trends of diseases
All MID groups and CVD 65–74 show a decreasing trend of the number of deaths that could be related with reductions of risk factors for these diseases in England and Wales (Unal et al., 2004). MID, CVD and HF show a clear annual be-haviour with maxima at the end (start) of every year (e.g. see Fig. 1 for the case of CVD 0–64). For most of the diseases, maximum values occurred at the beginning of 1997. After performing a year-superposed analysis (Chapman and Bar-tels, 1962) for every group removing the 29 February for leap years (2000 and 2004), the yearly behaviour pattern is clearly recognisable in all the diseases, even for Asthma groups. However, for CVD 0–64, maximum values take place dur-ing January or December while minimum values occur for summer months.
4 Frequency behaviour of diseases
In an FFT analysis of the raw data we found the principal periodicities of each series. There are low frequency peaks in all diseases corresponding mainly to∼1 year (±50 days),
0.5 year (±6 days for most of them) and 120±4 days (except MID 0–64), as we expected from the time series behaviour. There are conspicuous peaks of 1.6±0.3 years for MID≥75 and CVD 0–64, 1.6±0.4 years for HF and 1.6±0.2 years for Asthma 0–74; 1.4±0.4 years for CVD 65–74 and Asthma
≥75 years, 1.4±0.6 years for CVD≥75 years; and 1.2±
0.2 years for Asthma 0–74. At high frequencies, the presence of peaks was only evident for Asthma groups with 4.1±0.1 days the highest peak for Asthma 0–74 and 40.6±0.3 days for Asthma≥75 years. All the considered peaks were above the 95% level of confidence. However, for some series there are a few clear peaks at high frequencies under this level of confidence (clear peaks of 7 and 3.5 days for MID 65–74 and of 7 days for MID≥75).
1116 R. D´ıaz-Sandoval et al.: Periodic patterns in human mortality and solar activity
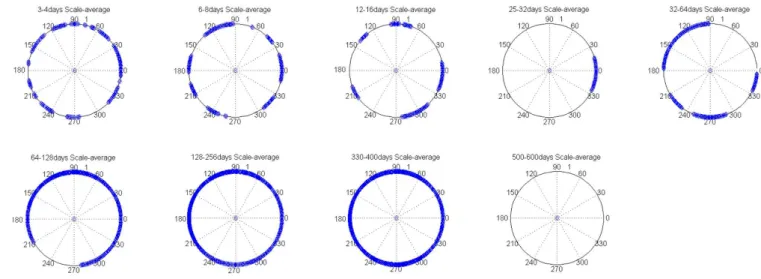
Fig. 2. Scale-average behaviour along a year (from wavelet analysis) for CVD 0–64 years group. Each plot represents a turn around the Sun.
An angle of 0 degrees corresponds to 1 January of each year and every year is represented for a complete turn of 360 degrees. 90 degrees is around spring equinox, 270 degrees is around autumn equinox and 180 degrees to summer solstice.
1998). It is suggestive to perform an average along frequency bands of the power wavelet spectrum vertical axis (scale av-erage). In this way, we are able to see specific scale/period ranges for wavelet analysis. For our study, we have arbitrar-ily chosen the following frequency bands: 3–4, 6–8, 12–16, 25–32, 32–64, 64–128, 128–256, 330–400, 500–600, 601– 700 days. The result is that the appearance of∼1 year pe-riodicity (330–400 days band) is present for all series in the wavelets within the cone of influence.
In order to analyse more carefully these frequencies and other frequency band contents, we plot the frequency con-tent in polar graphs that represent a turn of the Earth around the Sun (see Fig. 2 as a representative example for the same data shown in Fig. 1). As the studied complete period con-tains 9 years (9 turns), the result of each plot is the average behaviour of the periodicity content around a year (a turn) beginning from the 1 January of each year and represented by angle 0. For a rough reference guide, angles of 0, 90, 180 and 270 degrees are close to winter solstice, spring equinox, summer solstice and autumn equinox, respectively. Taking data from the right half circle (autumn–winter) as data when Earth’s orbit is closer to Sun and data from the left circle (spring–summer) as data when Earth’s orbit is farther away from the Sun, we are able to see the apparent distribution of periodicities for each band either close or far away from the Sun.
In relation with short period region, the presence of period-icities is higher in epochs close to the Sun for all the diseases, except for CVD groups for 6–8 days band; Asthma 0–74 for the 12–16 and 25–32 days bands and CVD 0–64 for 32–64 days band. Considering only the appearance of periodicities for time scales larger than the double or triple of the studied periodicity (e.g. for 3–4 days band, we focus on the appear-ance of this periodicity in time periods of at least 8 days for
the two-times criterion and periods of at least 12 days for the three-times criterion) we found that regardless of the crite-rion, 3–4 days band content continued being always higher when Earth is closest to the Sun and occasionally it is only present during these months. The 6–8 days band has a sim-ilar behaviour except for CVD 0–64 which has an opposite result for the two times criterion. However, a stricter three-times criterion left only one result for Asthma 75 (higher 6–8 days band content during autumn–winter time). The 12–16 days band content is higher when the Earth is closer to the Sun only for CVD 0–64 for two-times criterion. No period-icities appear for the three-times criterion. For the two-times criterion, 25–32 days band content is higher during autumn-winter time for Asthma groups but for the stricter three-times criterion this behaviour was reversed for Asthma 0– 64 and not present any more for Asthma 75. We found that only the two-times criterion gives a result for 32–64 and 64– 128 days band content being always greater during autumn-winter time for Asthma 0–74 and Asthma 75, respectively. Finally, applying the two and three-times criteria to 128–256 and 330–400 days bands, we obtained more or less the same content regardless of Earth’s position around the Sun.
5 Medical diseases and heliogeophysical proxies
As for the medical data, we performed an FFT analysis for several heliogeophysical proxies. For sunspot numbers, there are peaks of low frequencies corresponding to∼1.9±
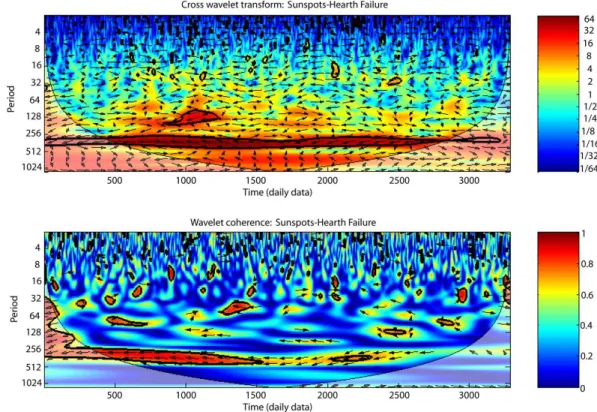
Fig. 3. Cross wavelet and wavelet coherence analysis of sunspots and HF group.
harmonics of these frequencies (13.5±0.2 and 6.96±0.02 days) among others. For the Ap-index, there is also the presence of peaks for 1.6±0.3 and 1±0.08 year, their har-monics, 27.7±0.14 days and its harmonics (13.5±0.07, 6.96±0.03, 3.65±0.005 days) among others. Periodicities close to 1 year and half year have been reported in the litera-ture previously. A∼1.3 year periodicity has been reported in helioseismical data (Krikova and Solanki, 2002) and a lower periodicity of 154–158 days period (about 0.43 years), known as Rieger periodicity, has been found in connection to solar flares (Rieger et al., 1984; Krikova and Solanki, 2002; Bouwer, 1992). The 27–28 day periodicity is associated with solar rotation (Lawrence et al., 2008) and ∼13.5 day peri-odicity has been related with opposite sources activity per solar rotation and the structure of interplanetary magnetic field (Fenimore et al., 1978; Pap et al., 1990; Gonzalez et al., 1993). About 7 and 3.5 days periodicity could be har-monics of∼13.5 days although they only appear in AA and Ap-indices and not in sunspots. They have also been reported in relation to solar activity and human health (Breus et al., 2008, and references therein).
In order to search for statistically relevant correlation be-tween the periodicities found in medical data and heliogeo-physical data, we performed a cross wavelet and wavelet co-herence analyses to pairs of medical and heliogeophysical series. Typical results of these two analyses are shown in Fig. 3 for sunspots and HF. In both panels, the curved line in the bottom indicates the cone of influence under which the
signals must be discarded. A colour level bar indicates the intensity of each signal. A contour black line determines a 95% level of confidence for the existence of a periodicity for certain scale/period and time. The arrows in each plot in-dicate the phase difference between the components of the two series (Grinsted et al., 2004). A right arrow indicates an in-phase relation while a left arrow means anti-phase. An annual anti-phase relation is present in most of the series for both cross wavelet and wavelet coherence analyses. The ex-ceptions are AA-index and CVD 65–74 and Asthma 75, re-spectively.
1118 R. D´ıaz-Sandoval et al.: Periodic patterns in human mortality and solar activity
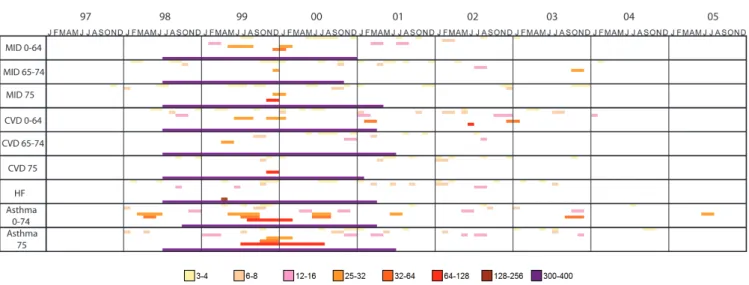
Fig. 4. Cross wavelet and wavelet coherence coincident time periods by band for sunspots and all diseases.
half year periodicity (128–256 days band) around 1999 for all of the diseases except for MID 65–74 and CVD≥75. The behaviour of the high frequency content for cross wavelet and wavelet coherence coincidence periods is not so evident. However, for sunspots there are few or none coincidences during 1997, 2004 and 2005.
6 Discussion
Time series behaviour, FFT and wavelet analyses show that there is a presence of a predominant yearly periodicity in all time series. FFT also revealed a 1.4–1.6 year periodicity for all series except MID 0–64 and MID 65–74; an∼1.5 year periodicity for HF and Asthma 75;∼1.8 years for HF; and
∼2.05 years for CVD 65–74, CVD 75 and HF. Most of the series show a half year periodicity as well. This periodicity is rather interesting from a physical point of view because of the relevance in solar physics and space weather research. What the actual physical connection could be requires fur-ther detailed modelling and investigation. In the context of weather or social explanations for these periodicities, only the annual and semi-annual ones have been explained as a result of a seasonal variation for cardiac and mental diseases (Sheth et al., 1999) and asthma (Weiss, 1990) or a state of mind because of the holidays or the proximity to the end of the year (Phillips et al., 2004). Wavelet analysis reveals a frequency content of yearly and semi-yearly periodicities for all diseases as well as 601–700 days (1.64–1.92 years) only for HF and a frequency content of 500–600 days (1.37– 1.64 years) only for Asthma 75. In wavelet analysis the yearly signal seems to be predominant over the other possible signals in the long period region. Previous results in the liter-ature show the existence of similar periodicities in solar ac-tivity as Rieger periodicity of about 0.43 years in solar flares (Rieger et al., 1984; Krikova and Solanki, 2002; Bouwer,
1992) and 1.3 years periodicity in helioseismic data (Krikova and Solanki, 2002). Medical series exhibit intermittent peri-odicities in the short period region for 3–4, 6–8, 25–32, 32– 64, 64–128 day bands as well. 6–8 days periodicity found in some diseases has often explanation in terms of a social weekly behaviour of work and rest (Spielberg et al., 1996; Wang et al., 2002). Nevertheless, the 3.5 days periodicity does not have a convincing explanation in this sense but has been found in the spectral behaviour of Kp-index and seems to be related to physiological human parameters (Breus et al., 2008). This periodicity has also been seen in the peak flux distribution of solar radio burst which produces dam-age to wireless communication systems (Nita et al., 2002). The∼3.5 and 7 days periodicities could be harmonics of the
∼13.5 day periodicity which has been directly found in solar activity (Fenimore et al., 1978; Pap et al., 1990; Gonzalez et al., 1993). Finally, the 25–32 days band is around 27–28 day of solar rotation (Lawrence et al., 2008).
In this sense, polar plots from wavelet analysis revealed higher occurrence of short period band periodicities when the Earth is closer to the Sun around its annual orbit. The 3–4 and 6–8 days band periodic content is higher in autumn-winter time for all the diseases. For long period bands the behaviour of frequency appearance varies. Yearly periodic-ity (330–400 days band content) does not show any prefer-ence for times when the Earth is close or far away from the Sun. On the other hand, medical and heliogeophysical cross-wavelet and cross-wavelet coherence analysis reveal coincidences of 1-year periodicity (330–400 days band) only around solar maximum. This is a very interesting result with some impor-tant potential for further biophysical research.
year periodicity (128–256 days band) around solar maxi-mum for most diseases with the exception of MID groups and Asthma 75 for AA; and MID 75 and CVD 75 for Ap. An appearance of a 64–128 days band after AA/Ap maxima (May–June 2003) is shown for all groups except for MID 0– 64, MID 65–74, CVD 0–64 for AA and Ap comparison and Asthma 75 only for AA comparison. Coincidences of long period bands around solar maximum and AA/Ap maximum show that the level of coherence measured through these two wavelet analyses is higher around high solar/geomagnetic ac-tivity.
7 Conclusions
In summary, our study seems to indicate a higher presence of short-period periodicities for the investigated diseases in the range of 3 days to half year during epochs when the Earth is closest to the Sun (3 to 8 days for the strictest criterion re-garding the length of the time scale where these periodicities appear) and a high level of coherence of year and semi-year periodicities during epochs of solar and geomagnetic activity maxima.
Further studies are needed to actually assess the present results for more than one solar cycle. Also, in order to at-tribute the behaviour of mortality frequencies in these kinds of diseases to the Earth’s orbit position around the Sun (i.e. in relevance to the Sun’s electromagnetic field) and not due to seasonal changes, more analysis has to be carried out in other high-latitude countries overall or even including the Southern Hemisphere. Our results, however, must be taken into ac-count at least at an indicative level for future more extensive studies of Sun-health relationship in the sense of searching for this relation, if any, during times of high heliogeophysi-cal activity.
Acknowledgements. We thank the Office for National Statistics for
providing us with the medical data set. R. D´ıaz-Sandoval edges J. E. Gonz´alez-Gallego for all support. R. Erd´elyi acknowl-edges M. Keray for patient encouragement and is also grateful to NSF, Hungary (OTKA, Ref. No. K83133) for financial support re-ceived.
Guest Editor M. Balikhin thanks N. Beloff and another anony-mous referee for their help in evaluating this paper.
References
Babayev, E. S. and Allahverdiyeva, A. A.: Effects of geomagnetic activity variations on the physiological and psychological state of functionally healthy humans: Some results of Azerbaijani stud-ies, Adv. Space Res., 40, 1941–1951, 2007.
Bouwer, S. D.: Periodicities of solar irradiance and solar activity indices II, Sol. Phys., 142, 365–389, 1992.
Breus, T. K., Ozheredov, V. A., Syutkina, E. V., and Rogoza, A. N.: Some aspects of the biological effects of space weather, J. Atmos. Solar-Terr Phys., 70, 436–441, 2008.
Bureau, Y. R. J. and Persinger, M. A.: Decreased latencies for lim-bic seizures induced in rats by lithiumpilocarpine occur when daily average geomagnetic activity exceeds 20 nanoTesla, Neu-rosc. Lett., 192, 142–144, 1995.
Chapman, S. and Bartels, J.: Geomagnetism Vol. 1., Oxford Press, Oxford, 1962.
Cherry, N.: Schumann Resonances, a plausible biophysical mecha-nism for the human health effects of Solar/Geomagnetic Activity, Nat. Hazards, 26, 279–331, 2002.
Corn´elissen, G., Halberg, F., Breus, T., Syutkina, E. V., Baevsky, R., Weydahl, A., Watanabe, Y., Kuniaki, O., Siegelova, J., Fiser B., and Bakken, E. E.: Non-photic solar associations of heart rate variability and myocardial infarction, J. Atmos. Solar-Terr. Phys., 64, 707-720, 2002: Non-photic solar associations of heart rate variability and myocardial infarction, J. Atmos. Solar-Terr. Phys., 64, 707–720, 2002.
Davis Jr., G. E. and Lowell, W. E.: Solar cycles and their relation-ship to human disease and adaptability, Med. Hypotheses, 67, 447–461, 2006.
D´ıaz-Sandoval, R. and Mendoza, B.: Study of the interaction be-tween biological cells of different shapes and sizes and electro-magnetic fields produced by natural phenomena, Nat. Hazards, 31, 143–156, 2004.
D´ıaz-Sandoval, R., S´anchez de la Pe˜na, S., and Ch´avez-Negrete, A.: Seven and 3.5-day rhythms in the incidence of myocardiopathies in Mexico, Arch. Med. Res., 39(1), 134–138, 2008.
Direnfeld, L. K.: The genesis of the EEG and its relation to electro-magnetic radiation, Elec. Biol. Med., 2(2), 111–121, 1983. Fenimore, E. E., Asbridge, J. R., Bame, S. J., Feldman, W. C., and
Gosling, J. T.: The power spectrum of the solar wind speed for periods greater than 10 days, J. Geophys. Res., 83, 4353–4357, 1978.
Gonzalez, A. L. C., Gonzalez, W. D., Dutra, S. L. G., and Tsurutani, B. T.: Periodic variation in the geomagnetic activity: A study based on the Ap index, J. Geophys. Res., 98, 9215–9231, 1993. Grinsted, A., Moore, J. C., and Jevrejeva, S.: Application of
the cross wavelet transform and wavelet coherence to geophys-ical time series, Nonlin. Processes Geophys., 11, 561–566, doi:10.5194/npg-11-561-2004, 2004.
Healy, J. D.: Excess winter mortality in Europe: a cross country analysis identifying key risk factors, J. Epidemiol. Community Health, 57, 784–789, 2003.
Jenkins, G. M. and Watts, D. G.: Spectral analysis and its applica-tions, Holden-Day Inc, San Francisco, p. 105, 1967.
Kane, R. P.: Did predictions of the maximum sunspot number for solar cycle 23 come true? Sol. Phys., 202, 395–406, 2001. Kane, R. P.: Sun-Earth relation: Historical development and present
status – A brief review, Adv. Space. Res., 35, 866–881, 2005. Krikova, N. A. and Solanki, S. K.: The 1.3-year and 156-day
pe-riodicities in sunspot data: wavelet analysis suggests a common origin, A&A, 394, 701–706, 2002.
Lawrence, J. K., Cadavid, A. C., and Ruzmaikin, A.: Rotational quasi-periodicities and the Sun heliosphere connection, Sol. Phys., 252(1), 179–193, 2008.
Mayaud, P. N.: Derivation, Meaning, and Use of Geomagnetic Indices, Geophysical Monograph 22, American Geophysical Union, Washington, p. 82–84, 1980.
1120 R. D´ıaz-Sandoval et al.: Periodic patterns in human mortality and solar activity
423–438, 2002.
Palmer, S. J., Rycroft, M. J., and Cermack, E. M.: Solar and geo-magnetic activity, extremely low frequency geo-magnetic and electric fields and human health at the Earth’s surface, Surv. Geophys., 27, 557–595, 2006.
Panagopoulos, D. J., Karabarbounis, A., and Margaritis, L. H.: Mechanism for action of electromagnetic fields on cells, Bioch. & Biophys. Res. Comm., 298, 95–102, 2002.
Pap, J., Tobiska, W. K., and Bouwer, S. D.: Periodicities of solar irradiance and solar activity indices I, Sol. Phys., 129, 165–189, 1990.
Phillips, D. P., Jarvinen, J. R., Abramson, I. S., and Phillips, R. R.: Cardiac mortality is higher around Christmas and New Year’s than at any other time: The holidays as a risk factor for death, Circulation, 110, 3781–3788, 2004.
Press, W. H.: Numerical recipes in C: The art of scientific comput-ing, 2nd edition, Cambridge Press, New York, 1992.
Rieger, E., Share, G. H., Forrest, D. J., Kanbach, G., Reppin, C., and Chupp, E. L.: A 154-day periodicity in the occurrence of hard solar flares?, Nature, 312, 623–625, 1984.
S´atori, G., Williams, E., and Mushtak, V.: Response of the Earth-ionosphere cavity resonator to the 11-year solar cycle in X-radiation, J. Atmos. Solar-Terr. Phys., 67, 553–562, 2005.
Schlegel, K., Diendorfer, G., Thern, S., and Schmidt, M.: Thunder-storms, lightning and solar activity – Middle Europe, J. Atmos. Solar-Terr Phys., 63, 1705–1713, 2001.
Sheth, T., Nair, C., Muller, J., and Yusuf, S.: Increased winter mor-tality from acute myocardial infarction and stroke: The effect of age, J. Am. Coll. Cardiol, 33(7), 1916–1919, 1999.
Spielberg, C., Falkenhahn, D., Willich, S. N., Wegscheider, K., and VSller, H.: Circadian, day-of-week, and seasonal variability in myocardial infarction: Comparison between working and retired patients, Am. Heart J., 132(3), 579–585, 1996.
Torrence, C. and Compo, G. P.: A practical guide to wavelet analy-sis, Bull. Am. Meteorol. Soc., 79, 61–78, 1998.
Ulmer, W.: On the role of the interactions of ions with external magnetic fields in physiologic processes and their importance in chronobiology, In vivo, 16(1), 31–36, 2002.
Unal, B., Critchley, J. A., and Capewell, S.: Explaining the de-cline in coronary heart disease mortality in England and Wales between 1981 and 2000, Circulation, 109, 1101–1107, 2004. Wang, H., Sekine, M., Chen, X., and Kagamimori, S.: A study of
weekly and seasonal variation of stroke onset, Int. J. Biomet., 47(1), 13–20, 2002.